

Hsp70 displaces small heat shock proteins from aggregates to initiate protein refolding
- PMID: 28219929
- PMCID: PMC5350560
- DOI: 10.15252/embj.201593378
Hsp70 displaces small heat shock proteins from aggregates to initiate protein refolding
Abstract
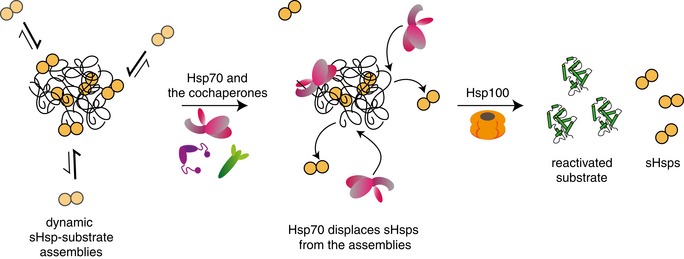
Small heat shock proteins (sHsps) are an evolutionary conserved class of ATP-independent chaperones that protect cells against proteotoxic stress. sHsps form assemblies with aggregation-prone misfolded proteins, which facilitates subsequent substrate solubilization and refolding by ATP-dependent Hsp70 and Hsp100 chaperones. Substrate solubilization requires disruption of sHsp association with trapped misfolded proteins. Here, we unravel a specific interplay between Hsp70 and sHsps at the initial step of the solubilization process. We show that Hsp70 displaces surface-bound sHsps from sHsp-substrate assemblies. This Hsp70 activity is unique among chaperones and highly sensitive to alterations in Hsp70 concentrations. The Hsp70 activity is reflected in the organization of sHsp-substrate assemblies, including an outer dynamic sHsp shell that is removed by Hsp70 and a stable core comprised mainly of aggregated substrates. Binding of Hsp70 to the sHsp/substrate core protects the core from aggregation and directs sequestered substrates towards refolding pathway. The sHsp/Hsp70 interplay has major impact on protein homeostasis as it sensitizes substrate release towards cellular Hsp70 availability ensuring efficient refolding of damaged proteins under favourable folding conditions.
Keywords: Hsp100 disaggregase; Hsp70; protein aggregation; protein refolding; sHsps.
© 2017 The Authors.
Figures
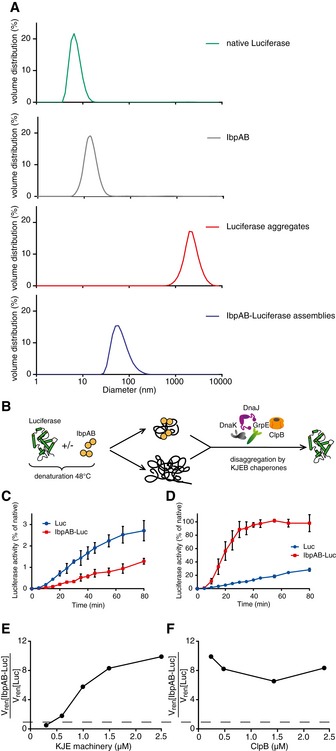
- A
Dynamic light scattering graphs depicting the size distribution of the following entities: native luciferase (green), IbpAB (grey), luciferase aggregates (red), IbpAB–luciferase assemblies (blue), shown as volume distribution of analysed species. Luciferase was present at 1.5 μM, IbpA at 3 μM, IbpB at 7 μM concentration.
- B
Scheme of the disaggregation experiment.
- C, D
Renaturation kinetics for luciferase denatured in the presence or absence of IbpAB. Luciferase (1.5 μM) was denatured in the presence of IbpA (3 μM) and IbpB (7 μM), diluted to 40 nM and refolded at limited (0.3 μM; C) or elevated (2.4 μM; D) KJE machinery concentrations and standard (1.5 μM) ClpB concentration. The KJE machinery concentration is given with respect to DnaK with a constant DnaK:DnaJ:GrpE ratio 1:0.3:0.3. Data are the mean ± SD of three independent experiments.
- E
A comparison of renaturation rates for luciferase denatured in the presence or absence of IbpAB in changing KJE and constant ClpB concentrations. The KJE machinery concentration is given with respect to DnaK with a constant DnaK:DnaJ:GrpE ratio 1:0.3:0.3.
- F
A comparison of renaturation rates for luciferase denatured in the presence or absence of IbpAB in changing ClpB and constant KJE concentrations. The dashed line indicates the theoretical scenario that luciferase refolding from aggregates and sHsp assemblies proceeds with identical refolding rates.
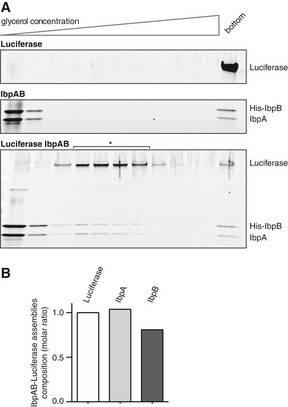
Comparison of sedimentational properties of IbpAB–luciferase assemblies and luciferase aggregates. Luciferase (1.5 μM)(upper gel), IbpA (3 μM) and IbpB (7 μM)(middle gel) or luciferase (1.5 μM), IbpA (3 μM) and IbpB (7 μM)(lower gel) were incubated at 48°C for 10 min and subjected to glycerol gradient sedimentation (SW 60 Ti rotor, 40,000 rpm, 1 h, 10°C). Fractions were collected from the top of the gradient. Proteins in the fractions were visualized by SYPRO Ruby staining following SDS–PAGE.
Stoichiometry of the proteins in the IbpAB–luciferase assemblies. Fractions marked with an asterisk containing IbpAB–luciferase assemblies were pooled and following SDS–PAGE and SYPRO Ruby staining, a densitometric analysis was performed. The relative molar ratio of proteins in assemblies was calculated by taking into account the respective molecular masses.
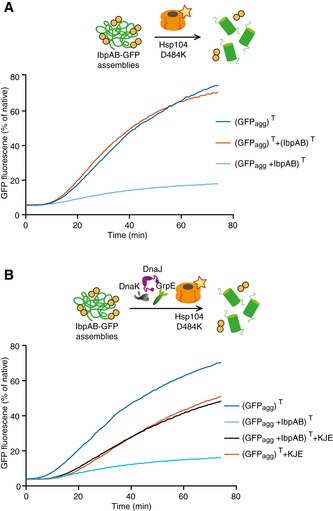
IbpAB association with GFP aggregates blocks substrate translocation through the central Hsp100 pore. Aggregated GFP (1.5 μM) was incubated for 10 min at 48°C (marked “T” in the Figure) alone (blue) or with IbpA and IbpB (3 μM and 7 μM, respectively; sky blue) or aggregated GFP and IbpAB were incubated separately at 48°C and then mixed (orange). Hsp104 D484K hyperactive variant (1 μM) was added, and GFP reactivation was monitored.
KJE machinery allows to overcome the IbpAB‐dependent inhibition of IbpAB–GFP disaggregation by hyperactive Hsp104 D484K. Aggregated GFP was incubated alone at 48°C (blue and orange) or with IbpAB at 48°C (sky blue and black). After addition of the Hsp104 D484K hyperactive mutant (all plots) and KJE machinery (black and magenta), GFP reactivation was monitored. DnaK, DnaJ and GrpE were present at 1 μM, 0.3 μM and 0.3 μM. Aggregated GFP, IbpAB and Hsp104 D484K were in concentrations as in (A).
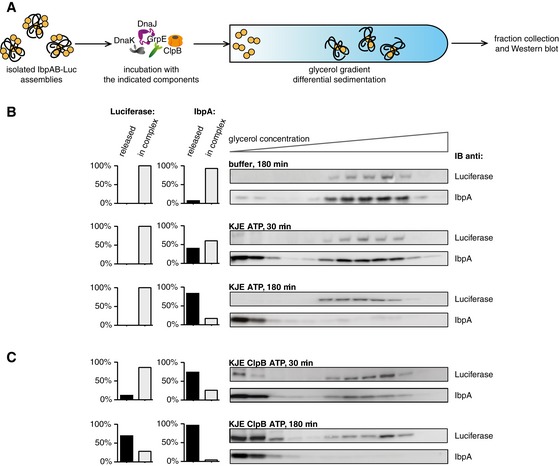
Experimental scheme. Purified IbpAB–luciferase assemblies were incubated with indicated components for the indicated time and resubjected to glycerol gradient sedimentation.
KJE releases IbpAB from IbpAB–luciferase assemblies. Fractions were collected from the top of the gradient, and luciferase and IbpA were visualized by Western blot following SDS–PAGE. The band intensities of luciferase and IbpA retained in the core assembly (fractions 5–12) or released from the assembly (fractions 1–3) were quantified and plotted on the graphs on the left. IbpA–IbpB–luciferase assemblies (approximate stoichiometry 1:0.8:1), DnaK, DnaJ and GrpE were present at 100 nM (calculated for luciferase monomer), 1 μM, 0.3 μM and 0.3 μM concentrations, respectively.
Concerted action of ClpB‐KJE results in release of IbpAB and luciferase from IbpAB–luciferase assemblies. Experiments were performed and analysed as in (B). ClpB was present at 1.5 μM concentration.
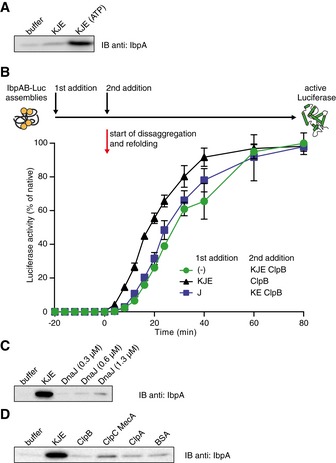
KJE requires ATP to release IbpAB from IbpAB–luciferase assemblies. The isolated assemblies were incubated with the indicated components for 60 min and resubjected to glycerol gradient sedimentation as in Fig 4B, but instead of showing the entire gradients, the fractions corresponding to the released material (1–3) were pooled together and IbpA was visualized by Western blot following SDS–PAGE.
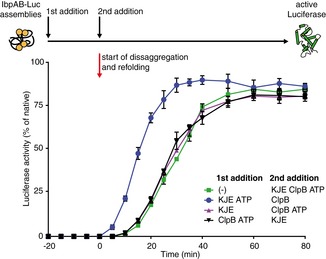
An order of addition experiment as in Fig 2. IbpAB–luciferase assemblies were first incubated with the components listed in the legend and then complemented with the missing components of the functional ClpB‐KJE bichaperone system. The DnaK, DnaJ, GrpE and ClpB concentrations used were as follows: 1, 0.6, 0.3 and 1.5 μM. Data are the mean ± SD of three independent experiments.
Incubation of the IbpAB–luciferase assemblies in the presence of DnaJ alone does not lead to IbpAB release. Experiment performed as in (A).
Incubation of the IbpAB–luciferase assemblies in the presence of Hsp100 family members does not lead to IbpAB release. Experiments were performed as in (A). ClpB, ClpC, MecA, ClpA and BSA were present at 1 μM concentration.
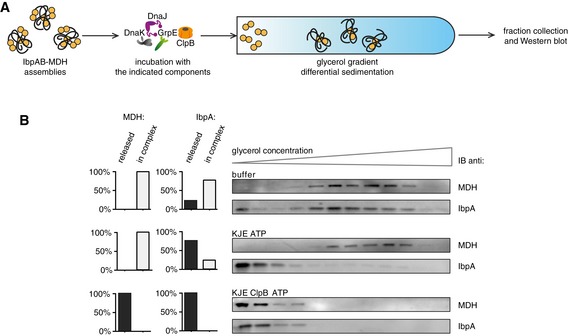
Experimental scheme. IbpAB–MDH assemblies, isolated from unbound IbpAB via sedimentation in glycerol gradient, were incubated with the indicated components for 120 min and resubjected to a second round of sedimentation.
KJE dissociates IbpAB from IbpAB–MDH assemblies. Fractions were collected from the top of the gradient, and MDH and IbpA were visualized by Western blot following SDS–PAGE. IbpA and MDH levels in each fraction were determined by quantitative immunoblot analysis using IbpA‐ and MDH‐specific antibodies, respectively. The band intensities of IbpA and MDH retained in the core assembly (fractions 5–12) or released from the assembly (fractions 1–3) were quantified and plotted on the graphs on the left. IbpAB–MDH assemblies (approximate stoichiometry 1:0.5:1), DnaK, DnaJ, GrpE and ClpB were present at 400 nM (calculated for MDH monomers), 1 μM, 0.3 μM, 0.3 μM and 1.5 μM concentrations, respectively.
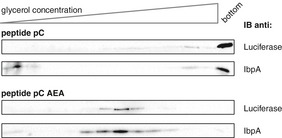
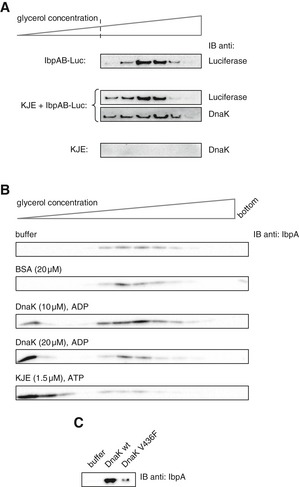
Purified IbpAB–luciferase assemblies were incubated with buffer or KJE and 2 mM ATP at 25°C for 60 min and resubjected to glycerol gradient sedimentation. Fractions were collected from the top of the gradient, and luciferase and DnaK were visualized by Western blot analysis. To avoid visualizing dominant, unbound DnaK, only the lower, IbpAB–luciferase assembly‐containing fractions of the gradient are shown. Sedimentation analysis of KJE only is provided as a control. IbpAB–luciferase assemblies (approximate stoichiometry 1:0.8:1), DnaK, DnaJ and GrpE were present at 100 nM (calculated for luciferase monomer), 1 μM, 0.3 μM and 0.3 μM concentrations, respectively.
DnaK binding to IbpAB–luciferase assemblies is sufficient to release IbpAB. Purified IbpAB–luciferase assemblies (100 nM) were incubated with the indicated components for 60 min and subjected to glycerol gradient sedimentation. Fractions were collected from the top of the gradient and IbpA was visualized by Western blot following SDS–PAGE.
Purified IbpAB–luciferase assemblies (100 nM) were incubated for 60 min with buffer or DnaK (10 μM) or DnaK V436F (10 μM) and subjected to glycerol gradient sedimentation as in Fig 4B, but instead of showing the entire gradients, the fractions corresponding to the released material (1–3) were pooled together and IbpA was visualized by Western blot following SDS–PAGE.
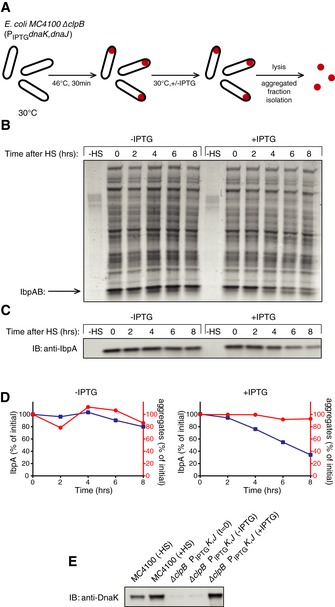
Experimental scheme. BB6410 (PA1lacO‐1) dnaK, dnaJ, lacIq, ΔclpB cells were grown at 30°C in LB medium until late log phase, heat‐shocked at 46°C for 30 min, then the culture was separated into two flasks and IPTG was added at 1 mM. At indicated time points, aliquots were taken, cells were lysed and protein aggregates were isolated.
The isolated fraction of aggregates was analysed by SDS–PAGE followed by staining with Coomassie brilliant blue at the indicated time points.
Levels of IbpA present in aggregates at the indicated time points were determined by quantitative immunoblot analysis using IbpA‐specific antibodies.
Quantification of (B) and (C).
DnaK cellular levels were determined by quantitative immunoblot analysis using DnaK‐specific antibodies.
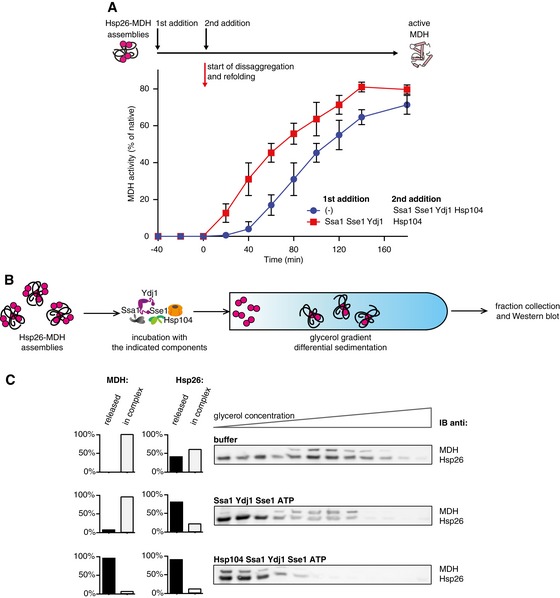
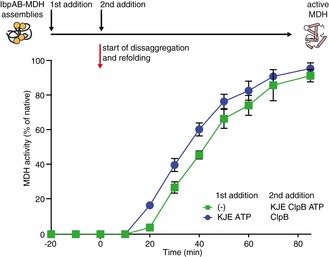
Yeast Hsp70 system acts prior to disaggregation of Hsp26–MDH assemblies. An order of addition experiment. MDH (5 μM) denatured in the presence of Hsp26 (5 μM) was diluted 10‐fold and first incubated with the components listed in the legend and then complemented with the missing components of the functional Hsp104‐SYS (Ssa1, Ydj1, Sse1) bichaperone system present at 1.5 μM, 4 μM, 2 μM and 0.15 μM concentrations, respectively. Data are the mean ± SD of three independent experiments.
Experimental scheme. Purified Hsp26–MDH assemblies were incubated with indicated components and subjected to glycerol gradient sedimentation.
SYS (Ssa1, Ydj1, Sse1) dissociates Hsp26 from Hsp26–MDH assemblies. Fractions were collected from the top of the gradient, and MDH and Hsp26 were visualized by Western blot following SDS–PAGE. The band intensities of MDH and Hsp26 retained in the core assembly (fractions 5–12) or released from the assembly (fractions 1–3) were quantified and presented on the graphs on the left. Hsp26–MDH assemblies (approximate stoichiometry 1.25:1), Ssa1, Ydj1, Sse1 and Hsp104 were present at 400 nM (calculated for MDH monomers), 4 μM, 2 μM, 0.15 μM and 1.5 μM concentrations, respectively.
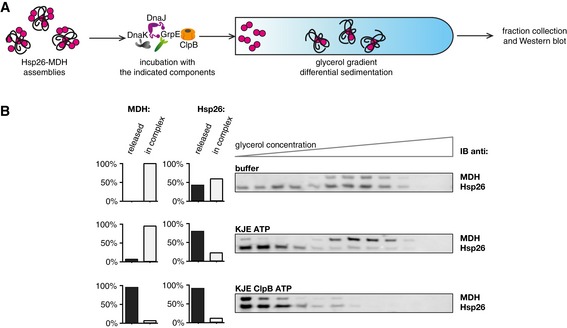
Experimental scheme. Hsp26–MDH assemblies isolated from unbound Hsp26 via sedimentation in a glycerol gradient were incubated with the indicated components for 120 min and resubjected to a second round of sedimentation.
DnaK, DnaJ, GrpE dissociate Hsp26 from Hsp26–MDH assemblies. Fractions were collected from the top of the gradient and MDH and Hsp26 were visualized by Western blot following SDS–PAGE. MDH and Hsp26 levels in each fraction were determined by quantitative immunoblot analysis using MDH‐ and Hsp26‐specific antibodies, respectively. The band intensities of Hsp26 and MDH retained in the core assembly (fractions 5–12) or released from the assembly (fractions 1–3) were quantified and presented on the graphs on the left. Hsp26–MDH assemblies (approximate stoichiometry 1.25:1), DnaK, DnaJ, GrpE and ClpB were present at 400 nM (calculated for MDH monomers), 1 μM, 0.3 μM, 0.3 μM and 1.5 μM concentrations, respectively.
Similar articles
-
Duplicate divergence of two bacterial small heat shock proteins reduces the demand for Hsp70 in refolding of substrates.PLoS Genet. 2019 Oct 25;15(10):e1008479. doi: 10.1371/journal.pgen.1008479. eCollection 2019 Oct. PLoS Genet. 2019. PMID: 31652260 Free PMC article.
-
The Diverse Functions of Small Heat Shock Proteins in the Proteostasis Network.J Mol Biol. 2022 Jan 15;434(1):167157. doi: 10.1016/j.jmb.2021.167157. Epub 2021 Jul 14. J Mol Biol. 2022. PMID: 34271010 Review.
-
Small heat shock proteins sequester misfolding proteins in near-native conformation for cellular protection and efficient refolding.Nat Commun. 2016 Nov 30;7:13673. doi: 10.1038/ncomms13673. Nat Commun. 2016. PMID: 27901028 Free PMC article.
-
Role of sHsps in organizing cytosolic protein aggregation and disaggregation.Cell Stress Chaperones. 2017 Jul;22(4):493-502. doi: 10.1007/s12192-017-0762-4. Epub 2017 Jan 24. Cell Stress Chaperones. 2017. PMID: 28120291 Free PMC article. Review.
-
Two Bacterial Small Heat Shock Proteins, IbpA and IbpB, Form a Functional Heterodimer.J Mol Biol. 2021 Jul 23;433(15):167054. doi: 10.1016/j.jmb.2021.167054. Epub 2021 May 20. J Mol Biol. 2021. PMID: 34022209
Cited by
-
Small Heat Shock Proteins in Cancers: Functions and Therapeutic Potential for Cancer Therapy.Int J Mol Sci. 2020 Sep 10;21(18):6611. doi: 10.3390/ijms21186611. Int J Mol Sci. 2020. PMID: 32927696 Free PMC article. Review.
-
The α-crystallin Chaperones Undergo a Quasi-ordered Co-aggregation Process in Response to Saturating Client Interaction.J Mol Biol. 2024 Apr 15;436(8):168499. doi: 10.1016/j.jmb.2024.168499. Epub 2024 Feb 23. J Mol Biol. 2024. PMID: 38401625
-
Cellular sequestrases maintain basal Hsp70 capacity ensuring balanced proteostasis.Nat Commun. 2019 Oct 24;10(1):4851. doi: 10.1038/s41467-019-12868-1. Nat Commun. 2019. PMID: 31649258 Free PMC article.
-
Regulation of germline proteostasis by HSF1 and insulin/IGF-1 signaling.Biochem Soc Trans. 2023 Apr 26;51(2):501-512. doi: 10.1042/BST20220616. Biochem Soc Trans. 2023. PMID: 36892215 Free PMC article.
-
Neuromuscular Diseases Due to Chaperone Mutations: A Review and Some New Results.Int J Mol Sci. 2020 Feb 19;21(4):1409. doi: 10.3390/ijms21041409. Int J Mol Sci. 2020. PMID: 32093037 Free PMC article. Review.
References
-
- Ahmad MF, Raman B, Ramakrishna T, Rao CHM (2008) Effect of phosphorylation on alpha B‐crystallin: differences in stability, subunit exchange and chaperone activity of homo and mixed oligomers of alpha B‐crystallin and its phosphorylation‐mimicking mutant. J Mol Biol 375: 1040–1051 - PubMed
Publication types
MeSH terms
Substances
LinkOut - more resources
Full Text Sources
Other Literature Sources
Molecular Biology Databases
