. 2017 Feb 17;13(2):e1006213.
doi: 10.1371/journal.ppat.1006213. eCollection 2017 Feb.

A calmodulin-like protein suppresses RNA silencing and promotes geminivirus infection by degrading SGS3 via the autophagy pathway in Nicotiana benthamiana

Affiliations

A calmodulin-like protein suppresses RNA silencing and promotes geminivirus infection by degrading SGS3 via the autophagy pathway in Nicotiana benthamiana

Fangfang Li et al. PLoS Pathog. .

Abstract

A recently characterized calmodulin-like protein is an endogenous RNA silencing suppressor that suppresses sense-RNA induced post-transcriptional gene silencing (S-PTGS) and enhances virus infection, but the mechanism underlying calmodulin-like protein-mediated S-PTGS suppression is obscure. Here, we show that a calmodulin-like protein from Nicotiana benthamiana (NbCaM) interacts with Suppressor of Gene Silencing 3 (NbSGS3). Deletion analyses showed that domains essential for the interaction between NbSGS3 and NbCaM are also required for the subcellular localization of NbSGS3 and NbCaM suppressor activity. Overexpression of NbCaM reduced the number of NbSGS3-associated granules by degrading NbSGS3 protein accumulation in the cytoplasm. This NbCaM-mediated NbSGS3 degradation was sensitive to the autophagy inhibitors 3-methyladenine and E64d, and was compromised when key autophagy genes of the phosphatidylinositol 3-kinase (PI3K) complex were knocked down. Meanwhile, silencing of key autophagy genes within the PI3K complex inhibited geminivirus infection. Taken together these data suggest that NbCaM acts as a suppressor of RNA silencing by degrading NbSGS3 through the autophagy pathway.


Conflict of interest statement

The authors have declared that no competing interests exist.

Figures
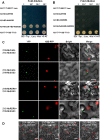
Fig 1
Fig 1. Interactions between NbCaM, NbSGS3 and NbRDR6.
(A and B) Yeast two-hybrid assays using NbCaM and NbSGS3 (A) or NbCaM and NbRDR6 (B). Serial 10-fold dilutions of yeast cells were made as indicated. Cells co-transformed with AD-T7-T+BD-T7-53 served as a positive control, and cells co-transformed with AD-T7-T+BD-T7-Lam, or with empty vectors pGBKT7 (BD) and pGADT7 (AD) served as negative controls. BD, GAL4 DNA binding domain; AD, GAL4 activation domain. (C and D) BiFC assays using NbCaM, NbSGS3 and NbRDR6 in H2B-RFP transgenic N. benthamiana leaves at 48 hours post infiltration. YFP fluorescence (green) was observed as a consequence of complementation of NbCaM and NbSGS3, or NbSGS3 and NbRDR6 tagged with 2YN and 2YC. Nuclei of tobacco leaf epidermal cells are indicated by expression of the H2B-RFP transgene (red). No YFP fluorescence was found between pairwise expression NbCaM and NbRDR6, or NbSGS3 and P3N-PIPO (D). Single channels from the merged image shown in (D) are shown in S2 Fig. Bars = 25 μm.
Fig 2
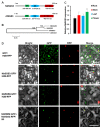
Fig 2. Sequence analysis, expression pattern and subcellular localization of NbSGS3.
(A) The linear diagram represents the domain structure of AtSGS3 and NbSGS3, ZF: Zinc finger, XS: Rice protein X and SGS3, CC: Coiled-coil. (B) Phylogenetic tree showing the evolutionary relationships between NbSGS3, NtSGS3, SlSGS3 and AtSGS3 proteins. Amino acid sequence alignment was performed in ClustalX2 and tree construction was conducted in MEGA6 using the Neighbour Joining method. The scale bar represents the number of changes per site. (C) RT-qPCR analysis of NbSGS3 expression levels in different tissues of N. benthamiana. Expression was normalized to NbGAPDH levels, which serves as an internal standard. The relative mRNA level of NbSGS3 in root was arbitrarily set to 1. R: Root, S: Stem, L: Leaf, F: Flower. Student’s t test was performed to compare differences between root and stem, leaf or flower tissues. Each mean value was derived from three independent experiments (n = 9). Values represent the mean ± standard deviation (SD). Double asterisks indicate a highly significant difference (p<0.01) between root and flower tissues. (D) Micrographs showing cells from leaves of H2B-RFP transgenic N. benthamiana expressing GFP, NbSGS3:GFP or NbRDR6:GFP (panels in top three rows), or NbRDR6:GFP and NbSGS3:RFP in Wt N. benthamiana (bottom row). Bars = 50 μm.
Fig 3
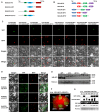
Fig 3. Function of conserved domains in NbCaM and NbSGS3.
(A) Schematic representation of wild type NbSGS3 and its deletion derivatives. ZF: zinc finger domain; XS: rice gene X and SGS3 domain; 2*CC: two coiled-coil domains. (B) Schematic representation of wild type NbCaM and its deletion derivatives. X: an unknown domain; EFI: first Ca2+ binding domain; EFII: second Ca2+ binding domain; EFIV: fourth Ca2+ binding domain. (C) BiFC analysis of NbCaM and NbSGS3. Deletion mutants fused to the N- or C-terminal part of YFP are indicated. Bars represent 50 μm. (D) Subcellular localization of GFP fused to wild type NbSGS3 (NbSGS3-Wt:GFP), ZF (NbSGS3-dZF:GFP), XS (NbSGS3-dXS:GFP), or 2*CC (NbSGS3-d2*CC:GFP) deletion mutant. Bars represent 50 μm. (E) Western blot analysis of total protein extracts of samples shown in (D). Ponceau staining of Rubisco large subunit is used as a loading control. (F) GFP fluorescence in leaves of N. benthamiana plants co-infiltrated with Agrobacterium cultures containing 35S:GFP+35S:FP and either empty control (Vec), the four deletion mutants of NbCaM or wild type NbCaM as indicated. Infiltrated leaves were photographed at 5 dpi under UV light. (G) Analyses of RNA and protein levels in the agroinfiltrated leaf samples shown in (F). TBSV p19 was used as a positive control for silencing suppression.
Fig 4
Fig 4. NbCaM reduces the number of NbSGS3 granules and mediates NbSGS3 protein degradation.
(A) Micrographs showing cells expressing GFP alone, or in conjunction with an empty vector (Vec) or Myc:NbCaM (upper panel), and expressing NbSGS3:GFP alone, or in conjunction with Vec or Myc:NbCaM (lower panel). Infiltrated N. benthamiana leaves were examined at 48 hpi. Bars represent 50 μm. (B) The graph illustrates the average number of NbSGS3:GFP granules per 20 cells. Infiltration experiments were performed three independent times and 20 cells were examined in each experiment (a total of sixty cells). Values presented represent the mean ± standard deviation (SD). Double asterisks indicate a highly significant difference (p<0.01) between plant cells expressing NbSGS3:GFP alone and co-expressing NbSGS3:GFP with Myc:NbCaM (Student’s t test). (C) Western blot of total protein extracts from (B) detected with GFP (first row) or Myc (third row) antibody. Protein assays were done at least three independent times, and protein bands from two representative experiments were quantified using Image J software (second row and fourth row). The amount of protein detected in samples expressing of NbSGS3:GFP or Myc:NbCaM alone was set at 100 and values under the blots represent the average level of protein ± standard deviation (SD). Coomassie brilliant blue staining of Rubisco large subunit was used as a loading control. RT-PCR was used for analysis of NbSGS3 transcripts. NbGAPDH served as an internal standard. (D) Western blot analysis of total protein extracts from leaves infiltrated with Myc:NbSGS3 alone, or together with GFP or NbCaM:GFP. Myc (first row) or GFP (second row) antibody was used. Along with a band consistent with the expected size for NbCaM:GFP (48 kDa), a smaller sized protein band was also detected. This could represent different modified forms of this protein or protein degradation by protease. Protein assays were performed from at least three independent experiments, and protein bands from two representatives were quantified using Image J software (second row and fourth row). The amount of protein detected in samples expressing Myc:NbSGS3, GFP, or NbCaM:GFP alone was set at 100 and values represent the average level of protein ± standard deviation (SD).
Fig 5
Fig 5. NbCaM-mediated degradation of NbSGS3 is blocked by inhibitors of autophagy, and co-expression of NbCaM and NbSGS3 induces autophagic activity.
(A, B) Effect of the autophagy inhibitor 3-MA on the accumulation of Myc:NbSGS3 when co-expressed with different concentrations of GFP (A) or NbCaM:GFP (B) at 2 dpi. Samples were analyzed by Western blot using Myc or GFP antibody. The OD600 of Agrobacterium culture mixtures containing a plasmid capable of expressing Myc:NbSGS3 alone, or together with GFP or NbCaM:GFP are indicated. DMSO or 3-MA (10 mM) was infiltrated into leaves 32 h after being agroinfiltrated with Myc:NbSGS3 along with GFP or NbCaM:GFP constructs. Samples were harvested from 16 h later. Coomassie brilliant blue staining of Rubisco large subunit was used as a loading control. The assays were performed from at least three independent experiments, and one representative result is shown. (C) Micrographs showing cells expressing YFP:NbATG8a alone, or together with NbSGS3 (TO:NbSGS3) on wild type (Wt) or 35S:NbCaM transgenic (35S:NbCaM) N. benthamiana plants. Infiltrated N. benthamiana leaves were examined at 48 hpi. Bars represent 50 μm. (D) The average number of punctate YFP fluorescent structures per 10 cells shown in (C). Independent infiltration experiments were performed three times and 10 cells examined in each experiment to give a total of thirty cells. Values represent the mean ± standard deviation (SD). Double asterisks indicate a highly significant difference (p<0.01) between Vec and NbSGS3 + NbCaM-infiltrated leaves (Student’s t test). (E) Representative TEM images of N. benthamiana leaves with the transient overexpression of empty vector (Vec), NbSGS3 (TO:NbSGS3), NbCaM (TO:NbCaM), TO:NbSGS3+Vec or TO:NbSGS3+TO:NbCaM. Obvious autophagic structures (red arrows) were observed in TO:NbSGS3+To:NbCaM infiltrated leaves in the central vacuole of mesophyll cells at 2 dpi. Cp: chloroplast, S: starch, V: vacuole. Bars = 2 μm. (F) The number of typical double-membrane autophagosome in leaves infiltrated with TO:NbSGS3, TO:NbCaM, TO:NbSGS3+Vec or TO:NbSGS3+TO:NbCaM, which was normalized to those found in leaves infiltrated with empty vector. Infiltration and TEM observation experiments were repeated twice and approximately 60 cells in total were used to quantify autophagic structures in each treatment. Values represent the mean number of autophagosomes ± standard deviation (SD). Student’s t test was performed to compare differences between Vec and NbSGS3, NbCaM, NbSGS3 +Vec or NbSGS3 +NbCaM-infiltrated leaves and double asterisks indicate a highly significant difference (p<0.01).
Fig 6
Fig 6. Silencing of NbBeclin1, NbPI3K or NbVPS15 leads to inhibition of NbSGS3 degradation mediated by NbCaM and reduces the infection of geminivirus associated with betasatellite.
(A) Silencing of NbBeclin1, NbPI3K or NbVPS15 inhibits NbCaM-mediated NbSGS3 degradation. N. benthamiana plants were first inoculated with TRV vectors carrying partial fragments of GUS, NbBeclin1, NbPI3K or NbVPS15 at the 4–5 leaf stage. Plants were then infiltrated at 21 dpi with NbSGS3:GFP plus Vec or NbSGS3:GFP plus Myc:NbCaM as indicated (top chart). Total protein was extracted from infiltrated leaves at 2 dpi, and GFP and Myc antibodies used in Western blot analyses. Coomassie brilliant blue staining of Rubisco large subunit was used as a loading control. A representative Western blot from at least three independent experiments is shown. NbSGS3:GFP protein bands were quantified using Image J software, and the protein level in leaves co-expressing NbSGS3:GFP and empty vector (Vec) in no-TRV infected plants was set at 100. Values represent the average level of protein ± standard deviation (SD). (B) Symptoms of mock, TRV-GUS and NbBeclin1, NbPI3K or NbVPS15-silenced plants infected by 10Aβ at 14 dpi. Systemic leaves of NbBeclin1, NbPI3K or NbVPS15-silenced plants at 7 dpi were then infected with TYLCCNV+TYLCCNB (10Aβ). (C) Southern blots of 10Aβ DNA accumulation using 30 μg of total DNA isolated from systemic leaves of six plants shown in (B) at 14 dpi. The agarose gel was stained with ethidium bromide as a loading control. Viral single-stranded DNA (ssDNA) and supercoiled DNA (scDNA) are indicated. (D) Relative 10A and 10β DNA levels in plants shown in (C) normalized to 25S rRNA that served as an internal plant genomic DNA control. The upper newly infected leaves were harvested and 100 ng total DNA used for relative quantitative PCR. The level of 10A or 10β DNA in mock-treated plants is arbitrarily set as 1. Values represent the mean ± standard deviation (SD) (n = 9). Double asterisks indicate a highly significant difference (p<0.01) between mock-treated and ATGs-silenced plants (student’s t test). (E) Symptoms of mock, TRV-GUS and NbBeclin1, NbPI3K or NbVPS15-silenced plants infected by 10A at 14 dpi. (F) Relative 10A DNA levels in plants shown in (E) normalized to 25S rRNA that served as an internal plant genomic DNA control. The upper newly infected leaves were harvested and 100 ng total DNA were used for relative quantitative PCR. The level of 10A DNA in mock-treated plants is arbitrarily set as 1. Values represent the mean ± standard deviation (SD) (n = 9).
Fig 7
Fig 7. A working model summarizing the roles of the endogenous suppressor NbCaM in regulation of PTGS and geminivirus infection.
The replication intermediates produced during geminivirus infection serve as templates for bidirectional transcription, and the resulting convergent transcripts induce RNA silencing. The dsRNAs with 5’ overhangs are further recognized by SGS3 and then converted into longer dsRNAs by RDR6, which amplifies RNA silencing and processes secondary siRNAs targeted against geminivirus infection. As a cellular negative regulator of RNA silencing, NbCaM could repress expression of RDR6 by an unidentified mechanism. Alternatively, the betasatellite encoded βC1 up-regulates NbCaM expression and NbCaM interacts with NbSGS3 to mediate degradation of NbSGS3 via the autophagy pathway. This then promotes efficient viral invasion by suppression of the host anti-viral RNA silencing machinery.

Similar articles

Cited by

References

    1. Pumplin N, Voinnet O. RNA silencing suppression by plant pathogens: defence, counter-defence and counter-counter-defence. Nat Rev Microbiol. 2013; 11: 745–760. 10.1038/nrmicro3120 - DOI - PubMed
    1. Wilson RC, Doudna JA. Molecular mechanisms of RNA interference. Annu Rev Biophys. 2013; 42: 217–239. 10.1146/annurev-biophys-083012-130404 - DOI - PMC - PubMed
    1. Bologna NG, Voinnet O. The diversity, biogenesis, and activities of endogenous silencing small RNAs in Arabidopsis. Annu Rev Plant Biol. 2014; 28: 1–31. - PubMed
    1. Mourrain P, Béclin C, Elmayan T, Feuerbach F, Godon C, Morel JB, et al. Arabidopsis SGS2 and SGS3 genes are required for posttranscriptional gene silencing and natural virus resistance. Cell. 2000; 101: 533–542. - PubMed
    1. Muangsan N, Beclin C, Vaucheret H, Robertson D. Geminivirus VIGS of endogenous genes requires SGS2/SDE1 and SGS3 and defines a new branch in the genetic pathway for silencing in plants. Plant J. 2004; 38: 1004–1014. 10.1111/j.1365-313X.2004.02103.x - DOI - PubMed

Publication types

Grants and funding

This research was supported by grants from the National Natural Science Foundation of China (31390422 and 31501605) to XZ and YW, the National Key Basic Research and Development Program of China (2012CB114004) to XZ and the Post-Doctoral Science Foundation of China (2015M570514) to FL. The funders had no role in study design, data collection and analysis, decision to publish, or preparation of the manuscript.

LinkOut - more resources