Delayed differentiation of potent effector CD8+ T cells reducing viremia and reservoir seeding in acute HIV infection
- PMID: 28202771
- PMCID: PMC5678930
- DOI: 10.1126/scitranslmed.aag1809
Delayed differentiation of potent effector CD8+ T cells reducing viremia and reservoir seeding in acute HIV infection
Abstract
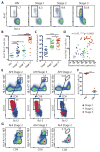
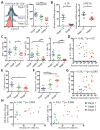
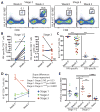
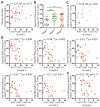
CD8+ T cells play a critical role in controlling HIV viremia and could be important in reducing HIV-infected cells in approaches to eradicate HIV. The simian immunodeficiency virus model provided the proof of concept for a CD8+ T cell-mediated reservoir clearance but showed conflicting evidence on the role of these cells to eliminate HIV-infected cells. In humans, HIV-specific CD8+ T cell responses have not been associated with a reduction of the HIV-infected cell pool in vivo. We studied HIV-specific CD8+ T cells in the RV254 cohort of individuals initiating ART in the earliest stages of acute HIV infection (AHI). We showed that the HIV-specific CD8+ T cells generated as early as AHI stages 1 and 2 before peak viremia are delayed in expanding and acquiring effector functions but are endowed with higher memory potential. In contrast, the fully differentiated HIV-specific CD8+ T cells at peak viremia in AHI stage 3 were more prone to apoptosis but were associated with a steeper viral load decrease after ART initiation. Their capacity to persist in vivo after ART initiation correlated with a lower HIV DNA reservoir. These findings demonstrate that HIV-specific CD8+ T cell magnitude and differentiation are delayed in the earliest stages of infection. These results also demonstrate that potent HIV-specific CD8+ T cells contribute to the reduction of the pool of HIV-producing cells and the HIV reservoir seeding in vivo and provide the rationale to design interventions aiming at inducing these potent responses to cure HIV infection.
Copyright © 2017, American Association for the Advancement of Science.
Conflict of interest statement
Figures


Comment in
-
Very early antiretroviral therapy permits CD8 T cells to keep HIV reservoirs at bay.Ann Transl Med. 2017 Nov;5(21):434. doi: 10.21037/atm.2017.08.38. Ann Transl Med. 2017. PMID: 29201886 Free PMC article. No abstract available.
Similar articles
-
HIV-Specific Granzyme B-Secreting but Not Gamma Interferon-Secreting T Cells Are Associated with Reduced Viral Reservoirs in Early HIV Infection.J Virol. 2017 Mar 29;91(8):e02233-16. doi: 10.1128/JVI.02233-16. Print 2017 Apr 15. J Virol. 2017. PMID: 28179527 Free PMC article.
-
CD8+ T Cell Breadth and Ex Vivo Virus Inhibition Capacity Distinguish between Viremic Controllers with and without Protective HLA Class I Alleles.J Virol. 2016 Jul 11;90(15):6818-6831. doi: 10.1128/JVI.00276-16. Print 2016 Aug 1. J Virol. 2016. PMID: 27194762 Free PMC article.
-
HIV replication leads to skewed maturation of CD8-positive T-cell responses in infected children.New Microbiol. 2010 Oct;33(4):303-9. New Microbiol. 2010. PMID: 21213588
-
Harnessing CD8+ T Cells Under HIV Antiretroviral Therapy.Front Immunol. 2019 Feb 26;10:291. doi: 10.3389/fimmu.2019.00291. eCollection 2019. Front Immunol. 2019. PMID: 30863403 Free PMC article. Review.
-
How does the timing of antiretroviral therapy initiation in acute infection affect HIV reservoirs?Curr Opin HIV AIDS. 2015 Jan;10(1):18-28. doi: 10.1097/COH.0000000000000122. Curr Opin HIV AIDS. 2015. PMID: 25415421 Free PMC article. Review.
Cited by
-
Cohort Profile: The Zurich Primary HIV Infection Study.Microorganisms. 2024 Jan 31;12(2):302. doi: 10.3390/microorganisms12020302. Microorganisms. 2024. PMID: 38399706 Free PMC article.
-
Why and where an HIV cure is needed and how it might be achieved.Nature. 2019 Dec;576(7787):397-405. doi: 10.1038/s41586-019-1841-8. Epub 2019 Dec 18. Nature. 2019. PMID: 31853080 Free PMC article. Review.
-
CD8+ T-Cell Response to HIV Infection in the Era of Antiretroviral Therapy.Front Immunol. 2019 Aug 9;10:1896. doi: 10.3389/fimmu.2019.01896. eCollection 2019. Front Immunol. 2019. PMID: 31447862 Free PMC article. Review.
-
HIV control: Is getting there the same as staying there?PLoS Pathog. 2018 Nov 1;14(11):e1007222. doi: 10.1371/journal.ppat.1007222. eCollection 2018 Nov. PLoS Pathog. 2018. PMID: 30383857 Free PMC article. Review.
-
A generalizable method for estimating duration of HIV infections using clinical testing history and HIV test results.AIDS. 2019 Jun 1;33(7):1231-1240. doi: 10.1097/QAD.0000000000002190. AIDS. 2019. PMID: 30870196 Free PMC article.
References
-
- McMichael AJ, Rowland-Jones SL. Cellular immune responses to HIV. Nature. 2001;410:980–987. - PubMed
-
- Migueles SA, Sabbaghian MS, Shupert WL, Bettinotti MP, Marincola FM, Martino L, Hallahan CW, Selig SM, Schwartz D, Sullivan J, Connors M. HLA B*5701 is highly associated with restriction of virus replication in a subgroup of HIV-infected long term nonprogressors. Proc Natl Acad Sci U S A. 2000;97:2709–2714. - PMC - PubMed
-
- Chen H, Ndhlovu ZM, Liu D, Porter LC, Fang JW, Darko S, Brockman MA, Miura T, Brumme ZL, Schneidewind A, Piechocka-Trocha A, Cesa KT, Sela J, Cung TD, Toth I, Pereyra F, Yu XG, Douek DC, Kaufmann DE, Allen TM, Walker BD. TCR clonotypes modulate the protective effect of HLA class I molecules in HIV-1 infection. Nature. 2012;13:691–700. - PMC - PubMed
-
- Mudd PA, Martins MA, Ericsen AJ, Tully DC, Power KA, Bean AT, Piaskowski SM, Duan L, Seese A, Gladden AD, Weisgrau KL, Furlott JR, Kim YI, Veloso de Santana MG, Rakasz E, Capuano S, 3rd, Wilson NA, Bonaldo MC, Galler R, Allison DB, Piatak M, Jr, Haase AT, Lifson JD, Allen TM, Watkins DI. Vaccine-induced CD8+ T cells control AIDS virus replication. Nature. 2012;491:129–133. - PMC - PubMed
Publication types
MeSH terms
Substances
Grants and funding
LinkOut - more resources
Full Text Sources
Other Literature Sources
Medical
Research Materials

