. 2017 May 1;117(5):1865-1876.
doi: 10.1152/jn.00835.2016. Epub 2017 Feb 15.

Action potentials and ion conductances in wild-type and CALHM1-knockout type II taste cells

Affiliations

Action potentials and ion conductances in wild-type and CALHM1-knockout type II taste cells

Zhongming Ma et al. J Neurophysiol. .

Abstract

Taste bud type II cells fire action potentials in response to tastants, triggering nonvesicular ATP release to gustatory neurons via voltage-gated CALHM1-associated ion channels. Whereas CALHM1 regulates mouse cortical neuron excitability, its roles in regulating type II cell excitability are unknown. In this study, we compared membrane conductances and action potentials in single identified TRPM5-GFP-expressing circumvallate papillae type II cells acutely isolated from wild-type (WT) and Calhm1 knockout (KO) mice. The activation kinetics of large voltage-gated outward currents were accelerated in cells from Calhm1 KO mice, and their associated nonselective tail currents, previously shown to be highly correlated with ATP release, were completely absent in Calhm1 KO cells, suggesting that CALHM1 contributes to all of these currents. Calhm1 deletion did not significantly alter resting membrane potential or input resistance, the amplitudes and kinetics of Na+ currents either estimated from action potentials or recorded from steady-state voltage pulses, or action potential threshold, overshoot peak, afterhyperpolarization, and firing frequency. However, Calhm1 deletion reduced the half-widths of action potentials and accelerated the deactivation kinetics of transient outward currents, suggesting that the CALHM1-associated conductance becomes activated during the repolarization phase of action potentials.NEW & NOTEWORTHY CALHM1 is an essential ion channel component of the ATP neurotransmitter release mechanism in type II taste bud cells. Its contribution to type II cell resting membrane properties and excitability is unknown. Nonselective voltage-gated currents, previously associated with ATP release, were absent in cells lacking CALHM1. Calhm1 deletion was without effects on resting membrane properties or voltage-gated Na+ and K+ channels but contributed modestly to the kinetics of action potentials.

Keywords: ATP release channel; taste bud; voltage clamp; voltage-gated ion channel.


Figures

Fig. 1.
Fig. 1.
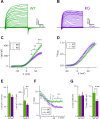
Steady-state voltage-gated currents in WT and Calhm1 KO type II cells. A and B: representative families of whole cell currents from WT and Calhm1 KO type II cells, respectively, evoked by 100-ms voltage pulses from −80 to 80 mV in 5-mV increments from a holding potential of −70 mV (see materials and methods for details of bath and pipette solutions). C: I-V relations for WT and Calhm1 KO outward currents, obtained by measurement of currents at end of pulses, normalized to individual whole cell capacitance. Solid lines are Boltzmann function fits with V0.5 and Z0 of 39.4 ± 2.4 mV and 1.4 ± 0.1 e for WT cells (n = 11) and 29.5 ± 1.3 mV and 1.5 ± 0.1 e for Calhm1 KO cells (n = 13) (***P < 0.0005 for V0.5; P = 0.32 for Z0). D: I-V relations of outward currents for WT and Calhm1 KO cells, normalized to maximum currents (Imax) obtained by fitting of a Boltzmann function to individual cell currents. E, left: at 20 mV, steady-state outward currents were 117.8 ± 5.7 pA/pF for WT cells (n = 11) and 100.3 ± 9.32 pA/pF for Calhm1 KO cells (n = 13) (P = 0.10). Right, at 50 mV, steady-state outward currents were 258.8 ± 13.3 pA/pF for WT cells (n = 11) and 191.4 ± 16.9 pA/pF for Calhm1 KO cells (n = 13) (**P < 0.005). F: voltage dependence of outward current activation time constants (τ) for WT (n = 11) and Calhm1 KO cells (n = 13), obtained by single exponential fits. Time constants were different between WT and Calhm1 KO cells at voltages >35 mV (*P < 0.05; **P < 0.005; ***P < 0.0005). G, left: outward current activation time constants at 20 mV were 13.6 ± 0.9 ms for WT cells (n = 11) and 13.8 ± 1.9 ms for Calhm1 KO cells (n = 13) (P = 0.75). Right, outward current activation time constants at 50 mV were 11.6 ± 0.7 ms for WT cells (n = 11) and 7.6 ± 0.8 ms for Calhm1 KO cells (n = 13) (***P < 0.0005). Whole cell capacitances were 4.6 ± 0.2 pF for WT cells (n = 11) and 4.8 ± 0.4 pF for Calhm1 KO cells (n = 13) (P = 0.45).
Fig. 2.
Fig. 2.
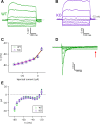
Membrane input resistances and voltage-gated background currents in type II cells. A and B: representative current-clamp recordings from WT (A) and Calhm1 KO cells (B) (Ihold = −10 pA) in response to 500-ms current pulses in 5-pA increments from −30 to + 5 pA every 10 s. Dotted lines indicate the holding potential level. C: membrane potential vs. injected currents for WT (n = 11) and Calhm1 KO cells (n = 13) obtained from steady-state voltages at end of 500-ms current pulses without firing action potentials. Membrane input resistances within −80 to −70 mV were 413 ± 39 MΩ for WT (n = 11) and 432 ± 27 MΩ for Calhm1 KO cells (n = 13) (P = 0.85). Membrane input resistances within −70 to −50 mV were 1.51 ± 0.21 GΩ for WT (n = 11) and 1.58 ± 0.26 GΩ for Calhm1 KO cells (n = 13) (P = 0.59). Solid lines are linear fits to WT data. D: representative family of currents recorded in a WT type II cell. Currents were evoked by 100-ms voltage pulses from −80 to −20 mV in 5-mV increments from a holding potential of −70 mV. Dotted line indicates zero-current level. E: I-V relations over voltage range from −80 to −20 mV for WT (n = 5) and Calhm1 KO cells (n = 4), with currents measured at end of 100-ms voltage pulses (indicated by arrow in D). Currents are not normalized to whole cell capacitance, which was 5.2 ± 0.5 pF for WT (n = 5) and 5.4 ± 0.5 pF for Calhm1 KO cells (n = 4). Cells with whole cell seal resistance >3 GΩ were chosen for this analysis.
Fig. 3.
Fig. 3.
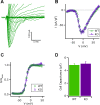
Steady-state Na+ currents in WT and Calhm1 KO type II cells. A: representative family of whole cell Na+ currents from WT type II cell (capacitance: 4.5 pF) evoked by 100-ms voltage pulses from −80 to +65 mV in 5-mV increments from a holding potential of −70 mV. Bath and pipette solutions are described in materials and methods. B: I-V relations of Na+ currents for WT and Calhm1 KO cells, obtained by measurements of peak inward currents, normalized to individual whole cell capacitance. Maximum peak inward currents near −10 mV were −73.5 ± 2.9 pA/pF for WT (n = 26) and −75.5 ± 4.6 pA/pF for Calhm1 KO cells (n = 18) (P = 0.15). C: Na+ conductance-voltage relations (G-V), fitted with a Boltzmann function with half-activation voltage (V0.5) and voltage dependence (Z0) of −18.8 ± 1.0 mV and 6.1 ± 0.4 e for WT (n = 26) and −19.6 ± 1.6 mV and 6.1 ± 0.5 e for Calhm1 KO cells (n = 18), respectively (P = 0.48 for V0.5; P = 0.94 for Z0). D: whole cell capacitance for cells used in Na+ current measurements was 4.9 ± 0.2 pF for WT (n = 26) and 5.1 ± 0.3 pF for Calhm1 KO cells (n = 18) (P = 0.52).
Fig. 4.
Fig. 4.
Action potential properties in type II taste cells from WT and Calhm1 KO mice. A: representative single action potential (green trace) in a WT cell. Red solid line is Gaussian fit between two threshold voltages, which was used to determine the overshooting value and half-width for each action potential. B: first time derivative of the voltage (dV/dt) during the action potential in A. Threshold was defined as the voltage (red arrow) reached once dV/dt significantly increased from baseline.
Fig. 5.
Fig. 5.
Trains of action potentials in WT and Calhm1 KO type II cells. A and B: representative current-clamp recordings (Ihold = −10 pA) from WT and Calhm1 KO cells, respectively, in response to indicated depolarizing current injections. Dotted lines indicate 0 mV. C: number of overshooting action potentials during 500-ms depolarizing current injections in WT (n = 11) and Calhm1 KO cells (n = 13). D: expanded scale for the third KO action potential trace in B. E: interval between overshooting peaks of first and second action potential in trains of action potentials with a maximum number of action potentials for each cell was 103.8 ± 6.9 ms for WT (n = 11) and 104.3 ± 11.8 ms for Calhm1 KO cells (n = 13) (P = 0.96). F: action potential frequency (reciprocal of the interval time in E) was 10.5 ± 0.9 Hz for WT (n = 11) and 11.8 ± 1.6 Hz for Calhm1 KO cells (n = 13) (P = 0.34).
Fig. 6.
Fig. 6.
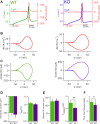
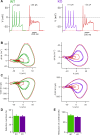
Phase-plane plots and inward Na+ and outward currents during the first action potential. A: action potentials recorded from WT (left; green trace) and Calhm1 KO type II cells (right; purple trace). Estimated voltage-gated currents [−C(dV/dt), where C is cell capacitance and V the membrane voltage] during action potentials are shown for WT and Calhm1 KO cells (red traces). B: dV/dt vs. voltage phase-plane plots during the action potentials in A and B. C: phase-plane plots of estimated currents [−C(dV/dt)] vs. voltage during action potentials in A for a WT (left) and a Calhm1 KO cell (right). D, left: estimated peak inward Na+ currents during the first action potential were −201.6 ± 26.8 pA for WT (n = 8) and −220.5 ± 31.7 pA for Calhm1 KO cells (n = 7) cells (P = 0.75). Right, activation time constants of Na+ currents (τNa) during first action potential were 1.10 ± 0.06 ms for WT (n = 8) and 1.03 ± 0.06 ms for Calhm1 cells KO (n = 7) (P = 0.35). E, left: estimated peak outward currents during the first action potential were 127.1 ± 14.4 pA for WT (n = 8) and 131.3 ± 12.4 pA for Calhm1 KO cells (n = 7) (P = 0.71). Right, activation time constant of outward currents (τoutward) during first action potential were 2.95 ± 0.23 ms for WT (n = 8) and 2.11 ± 0.16 ms for Calhm1 KO cells (n = 7) (**P < 0.005). Time constants were determined by fitting with single exponential functions. F: times between peak inward Na+ current and peak outward current were 3.8 ± 0.2 ms for WT (n = 8) and 3.2 ± 0.3 ms for Calhm1 KO cells (n = 7) (*P < 0.05).
Fig. 7.
Fig. 7.
Estimated currents during trains of action potentials in WT and Calhm1 KO type II cells. A: representative trains of action potentials (Ihold = −10 pA) for WT (left) and Calhm1 KO type II cells (right) elicited by current injections of 15 and 25 pA. Black dotted lines indicate 0 mV. Red dashed lines represent −71 mV for a WT cell and −72 mV for a Calhm1 KO cell. B: phase-plane plots of dV/dt vs. voltage during a train of action potentials for WT (left) and Calhm1 KO cells (right), with either 15-pA (green and purple) or 25-pA (red) current injections. C: phase-plane plots of estimated currents [−C(dV/dt)] vs. voltage during a train of action potentials, with color codes as in B, for a WT cell (left; capacitance = 5.0 pF) and a Calhm1 KO cell (right; capacitance = 5.6 pF). D: percent reduction of second action potential overshooting value, calculated as reduction (%) = [(overshoot1st – overshoot2nd)/overshoot1st × 100], was 43.9 ± 3.2% for WT (n = 8) and 42.5 ± 3.1% for Calhm1 KO cells (n = 7) (P = 0.79) under a mild electrical stimulus. With stronger depolarizing current injections, percent reductions were 83.9 ± 5.1% for WT (n = 8) and 75.5 ± 4.0% for Calhm1 KO cells (n = 7) (P = 0.31).

Similar articles

Cited by

References

    1. Akaike N, Noma A, Sato M. Electrical responses to frog taste cells to chemical stimuli. J Physiol 254: 87–107, 1976. doi:10.1113/jphysiol.1976.sp011223. - DOI - PMC - PubMed
    1. Avenet P, Lindemann B. Noninvasive recording of receptor cell action potentials and sustained currents from single taste buds maintained in the tongue: the response to mucosal NaCl and amiloride. J Membr Biol 124: 33–41, 1991. doi:10.1007/BF01871362. - DOI - PubMed
    1. Bean BP. The action potential in mammalian central neurons. Nat Rev Neurosci 8: 451–465, 2007. doi:10.1038/nrn2148. - DOI - PubMed
    1. Béhé P, DeSimone JA, Avenet P, Lindemann B. Membrane currents in taste cells of the rat fungiform papilla. Evidence for two types of Ca currents and inhibition of K currents by saccharin. J Gen Physiol 96: 1061–1084, 1990. doi:10.1085/jgp.96.5.1061. - DOI - PMC - PubMed
    1. Bigiani A, Sbarbati A, Osculati F, Pietra P. Electrophysiological characterization of a putative supporting cell isolated from the frog taste disk. J Neurosci 18: 5136–5150, 1998. - PMC - PubMed

Publication types

LinkOut - more resources