. 2017 Apr 15;77(8):2018-2028.
doi: 10.1158/0008-5472.CAN-16-0808. Epub 2017 Feb 15.

Radiation Resistance in KRAS-Mutated Lung Cancer Is Enabled by Stem-like Properties Mediated by an Osteopontin-EGFR Pathway

Affiliations

Radiation Resistance in KRAS-Mutated Lung Cancer Is Enabled by Stem-like Properties Mediated by an Osteopontin-EGFR Pathway

Meng Wang et al. Cancer Res. .

Abstract

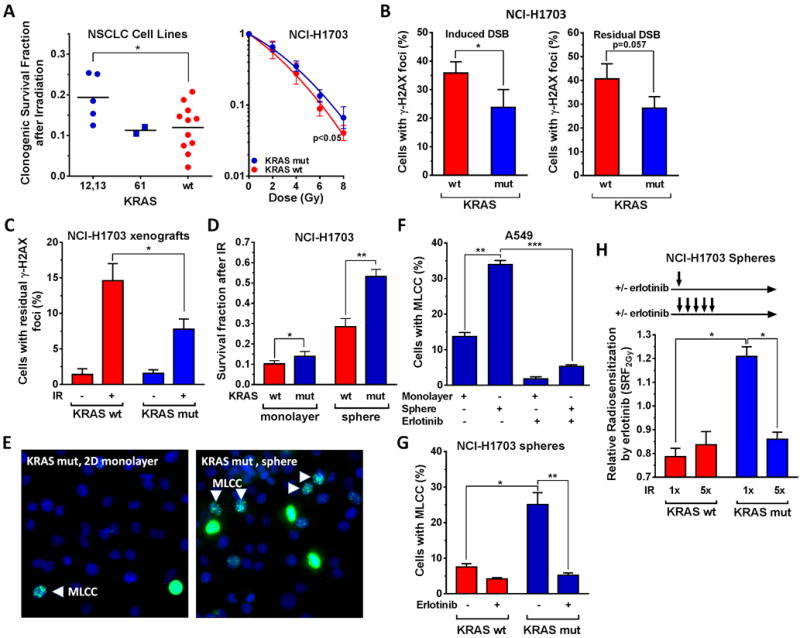
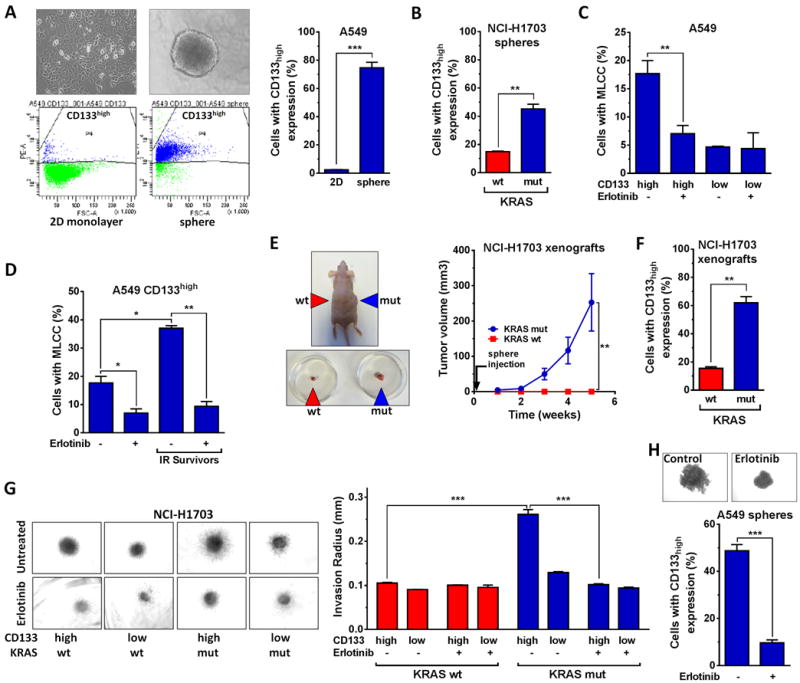
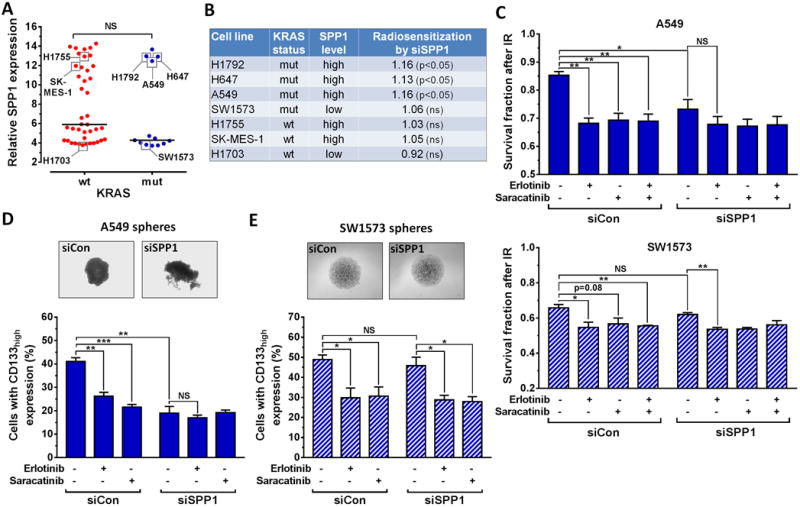
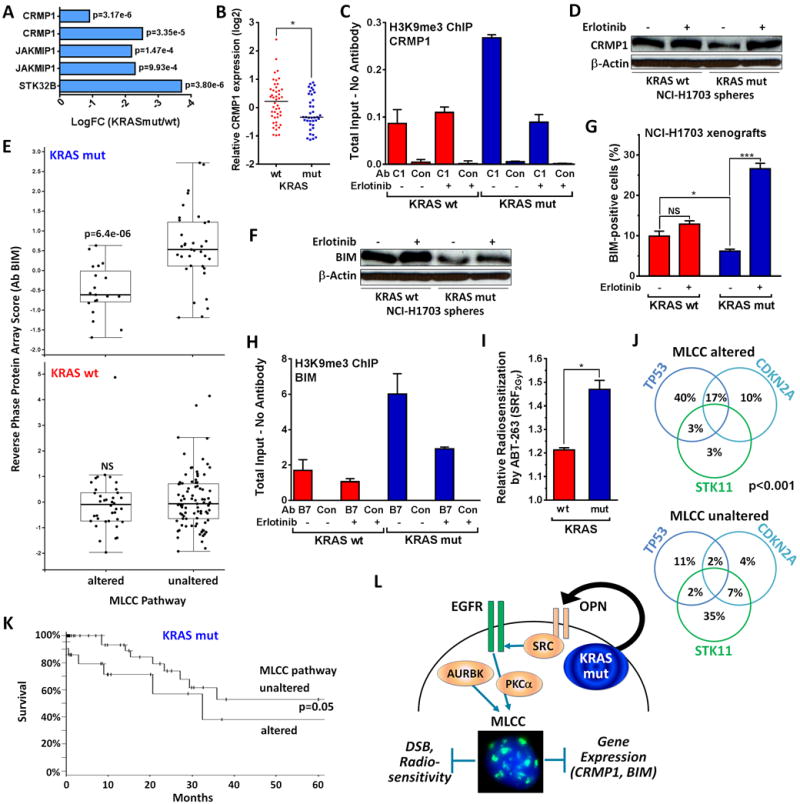
Lung cancers with activating KRAS mutations are characterized by treatment resistance and poor prognosis. In particular, the basis for their resistance to radiation therapy is poorly understood. Here, we describe a radiation resistance phenotype conferred by a stem-like subpopulation characterized by mitosis-like condensed chromatin (MLCC), high CD133 expression, invasive potential, and tumor-initiating properties. Mechanistic investigations defined a pathway involving osteopontin and the EGFR in promoting this phenotype. Osteopontin/EGFR-dependent MLCC protected cells against radiation-induced DNA double-strand breaks and repressed putative negative regulators of stem-like properties, such as CRMP1 and BIM. The MLCC-positive phenotype defined a subset of KRAS-mutated lung cancers that were enriched for co-occurring genomic alterations in TP53 and CDKN2A. Our results illuminate the basis for the radiation resistance of KRAS-mutated lung cancers, with possible implications for prognostic and therapeutic strategies. Cancer Res; 77(8); 2018-28. ©2017 AACR.


Conflict of interest statement

Conflicts: The authors disclose no potential conflicts of interest.

Figures

Figure 1
Figure 1. KRAS mutation (mut) is associated with radiation resistance in NSCLC
A, Left panel, Clonogenic survival of a panel of NSCLC cell lines after 6 Gy single dose ionizing radiation (IR) exposure, grouped according to KRAS status. Each data point represents one cell line. Statistical comparison by T-test. B, Right panel, Clonogenic survival of an isogenic NSCLC pair either wild-type (wt) for KRAS or stably transfected with a KRASmut transgene. Statistical comparison of fitted survival curves with the F-test. B, Left panel, Percentage of tumor cells with at least 20 γ-H2AX foci 15 minutes after exposure to 1 Gy. Right panel, Percentage of cells with at least 20 γ-H2AX foci at 24 hours (h) after 8 Gy irradiation. C, Percentage of tumor cells with at least 20 γ-H2AX foci from isogenic xenografts harvested 24h after irradiation of mice with 1 Gy. D, Survival fraction of cells in 2D monolayer and tumor sphere culture following treatment with 2 Gy. E, Representative immunofluorescence images showing co-localized H3S10p and H3K9me3 in monolayer and 3D cultured KRASmut A549 cells using a specific dual antibody. Punctate interphase-like staining pattern consistent with MLCC indicated by arrows. Diffuse nuclear staining consistent with metaphase. F, Percentage of A549 cells with MLCC grown in monolayer or sphere culture +/− treatment with erlotinib for 1h. G, Analogous to panel F, percentage of cells with MLCC. H, Relative radiosensitization of tumor spheres by erlotinib using single dose (2 Gy × 1) or fractionated irradiation (2 Gy × 5, 24h apart). Irradiations are illustrated by arrows. Radiosensitization factors were derived using the CTG assay as described (29). In all panels, bars or data points represent mean +/− standard error based on typically at least three biological repeat experiments, * p≤0.05, ** p≤0.01, *** p≤0.001 (T-test).
Figure 2
Figure 2. Association of MLCC with CSC-like phenotype in KRASmut NSCLC
A, Left, Upper panels, Representative light microscopy images to illustrate growth of KRASmut A549 cells in monolayer (left) or sphere (right) culture. Left, Lower panels, Representative flow cytometry histograms to show the percentage of cells with high expression of the putative CSC marker CD133 (CD133high) (see also Fig. S2A). Right panel, percentage of CD133high expressing cells without any treatment. B, Analogous to panel A, Percentage of CD133high cells under sphere conditions. C, Percentage of cells with MLCC staining as a function of CD133 expression +/− treatment with erlotinib for 1h. D, Percentage of CD133high expressers with MLCC signal +/− erlotinib treatment. IR survivors indicate cells that were expanded from single cells surviving previous irradiation (Fig. S2D,E). E, Left, representative image of NCI-H1703 xenografts following implantation of cell suspensions into both flanks as indicated. Right panel, cell suspensions containing 2 × 10⁵ cells from KRASmut or wt tumor spheres were injected into the flanks of nude mice (n=5) and tumor volumes were measured at the indicated times after injection. F, Percentage of CD133high cells in KRASmut and wt xenografts. G, Left panel, Representative images of a tumor sphere invasion assay with CD133high and CD133low expressers following treatment with 2 μM erlotinib. Right panel, Average length of sphere invasion radius was determined using ImageJ from 3 independent repeats. H, Representative images (upper panel) and percentage of CD133high cells (lower panel) +/− treatment with erlotinib for 24h. See Fig. 1 for data presentation and statistical comparisons.
Figure 3
Figure 3. Osteopontin (SPP1) promotes radiation resistance of KRASmut NSCLC cells
A, Rank of highest differentially expressed genes in KRASmut NCI-H1703 cells compared to cells with endogenous wt (left) or exogenous overexpression of wt KRAS (right). Expression data from SPP1 probes are marked with stripes. B, Whole cell lysates and culture medium from KRASmut cells compared to wt controls were subjected to Western blotting with an osteopontin (OPN) specific antibody. C, Whole cell lysates from NSCLC cell lines were subjected to Western blotting with an OPN antibody. D, Western blot of KRASmut and wt NCI-H1703 cells transfected with scrambled control (Con) siRNA or siRNA against SPP1. E, Fraction of surviving NCI-H1703 cells following OPN depletion and irradiation with 2 Gy using the syto60 assay. Data were normalized to the survival fraction of irradiated wt control cells. F, Clonogenic survival fraction of NCI-H1703 cells +/− addition of recombinant OPN (1 μg/mL) for 1h prior to 6 Gy IR. G, Fraction of cells containing at least 20 53BP1 foci 15 minutes after 1 Gy IR following siRNA transfection +/− treatment with erlotinib. H, Fraction of KRASmut NCI-H1792 cells with at least 20 γ-H2AX foci 15 minutes after 1 Gy IR, transfected with siRNA +/− treatment with a histone methyl-transferase inhibitor (HMTi, Chaetocin at 100nM), as described (27). I, Cell survival fraction after 2 Gy with or without the treatments indicated, analogous to panel H. See Fig. 1 for data presentation and statistical comparisons. NS, not significant.
Figure 4
Figure 4. Functional heterogeneity of SPP1/osteopontin in NSCLC cell lines
A, Relative gene expression of SPP1 in 54 NSCLC cell lines with known KRAS status. Horizontal lines represent the median in each group. B, Summary of radiosensitization achieved with siRNA-mediated depletion of osteopontin based on the data in Fig. 3E, 4C, S5C. C, Survival fractions of A549 and SW1573 cells in the syto60 assay following siRNA transfection and inhibitor treatments as indicated. Cells were irradiated with 2 Gy 1h after adding inhibitor. D, Upper panel, representative images of A549 spheres, and Lower Panel, A549 cells with CD133high expression after treatments as indicated. E, Results for SW1573 cells analogous to panel D. See Fig. 1 for data presentation and statistical comparisons. NS, not significant.
Figure 5
Figure 5. MLCC-associated gene repression in NSCLC
A, Downregulation of gene cluster on chromosome 4p16 comprised of CRMP1, JAKMIP1, and STK32B in KRASmut NCI-H1703 cells compared to wt cells. B, Relative CRMP1 expression in a cohort of 85 lung adenocarcinomas. Horizontal lines represent medians, statistical comparison with Mann-Whitney test (two-sided). C, ChIP assays performed with KRASmut NCI-H1703 cells compared to wt following 1h treatment with 2 μM erlotinib. The immunoprecipitated DNA was quantified by real-time PCR with primers specific to the CRMP1 promoter, and the fold enrichment of input was normalized to the no antibody control. GAPDH was used as a negative control. D, Whole cell lysates from NCI-H1703 spheres were probed with a CRMP1-specific antibody +/− preceding erlotinib treatment for 18h. E, Reverse phase protein array scores for BIM in 230 patients with KRASmut or wt lung adenocarcinoma. Patients were grouped according to putative alterations in candidate genes supporting MLCC (Fig. S6B). F, Whole cell lysates from NCI-H1703 spheres were probed with a BIM-specific antibody +/− erlotinib treatment for 18h. G, Percentage of cells with nuclear BIM staining in xenografts from KRASmut versus wt NCI-H1703 cells. Tumor tissues were subjected to ex-vivo treatment with 2 μM erlotinib for 24h. H, ChIP analysis analogous to panel C. I, Relative radiosensitization following treatment of NCI-H1703 spheres with ABT-263 at 1 μM for 18h prior to irradiation with 2 Gy. J, Distribution of co-occurring mutations in KRASmut lung adenocarcinomas in the data set in panel E. Statistical comparison by Fisher’s Exact. K, Kaplan-Meier curves for patients with KRASmut NSCLC as a function of MLCC status, taken from panel E. Statistical comparison by logrank test. L, Dual model of KRASmut-dependent MLCC which represses DSB induction and promotes stem-ness. AURKB and PKCα were previously implicated in supporting MLCC expression (27). See Fig. 1 for data presentation and statistical comparisons.

Similar articles

Cited by

References

    1. Stephen AG, Esposito D, Bagni RK, McCormick F. Dragging ras back in the ring. Cancer Cell. 2014;25:272–81. - PubMed
    1. Eberhard DA, Johnson BE, Amler LC, Goddard AD, Heldens SL, Herbst RS, et al. Mutations in the epidermal growth factor receptor and in KRAS are predictive and prognostic indicators in patients with non-small-cell lung cancer treated with chemotherapy alone and in combination with erlotinib. J Clin Oncol. 2005;23:5900–9. - PubMed
    1. Han SW, Kim TY, Jeon YK, Hwang PG, Im SA, Lee KH, et al. Optimization of patient selection for gefitinib in non-small cell lung cancer by combined analysis of epidermal growth factor receptor mutation, K-ras mutation, and Akt phosphorylation. Clin Cancer Res. 2006;12:2538–44. - PubMed
    1. Tsao MS, Aviel-Ronen S, Ding K, Lau D, Liu N, Sakurada A, et al. Prognostic and predictive importance of p53 and RAS for adjuvant chemotherapy in non small-cell lung cancer. J Clin Oncol. 2007;25:5240–7. - PubMed
    1. Winton T, Livingston R, Johnson D, Rigas J, Johnston M, Butts C, et al. Vinorelbine plus cisplatin vs. observation in resected non-small-cell lung cancer. N Engl J Med. 2005;352:2589–97. - PubMed

MeSH terms