. 2017 Feb 23;542(7642):475-478.
doi: 10.1038/nature21355. Epub 2017 Feb 13.

m6A-dependent maternal mRNA clearance facilitates zebrafish maternal-to-zygotic transition

Affiliations

m6A-dependent maternal mRNA clearance facilitates zebrafish maternal-to-zygotic transition

Boxuan Simen Zhao et al. Nature. .

Abstract

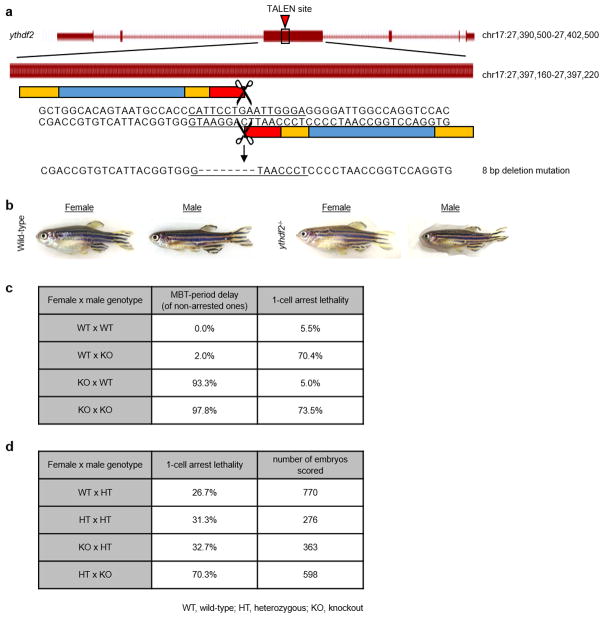
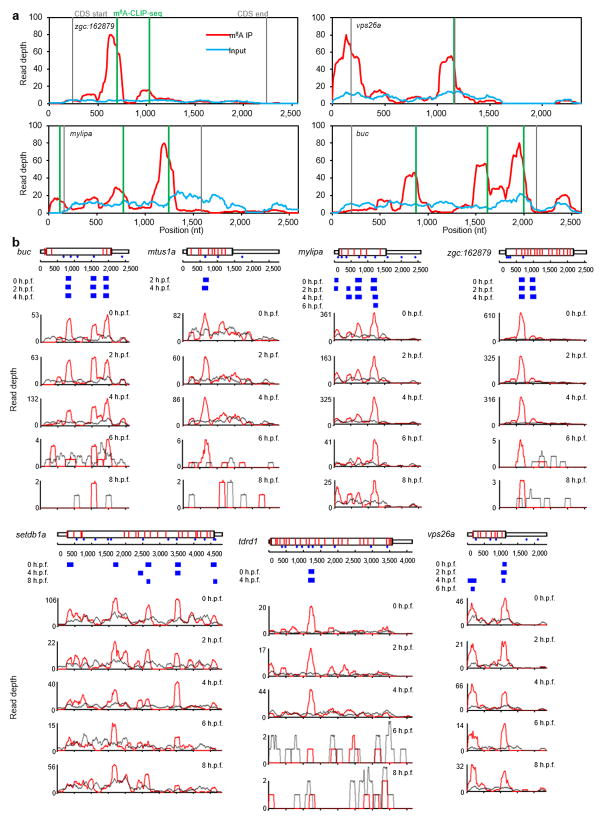
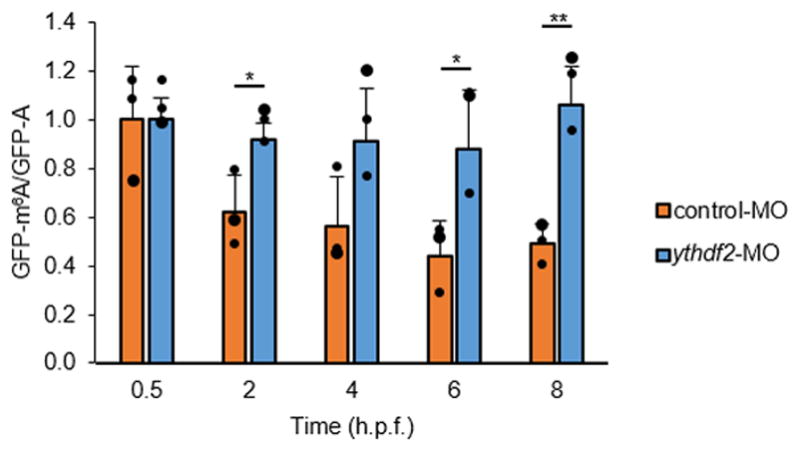
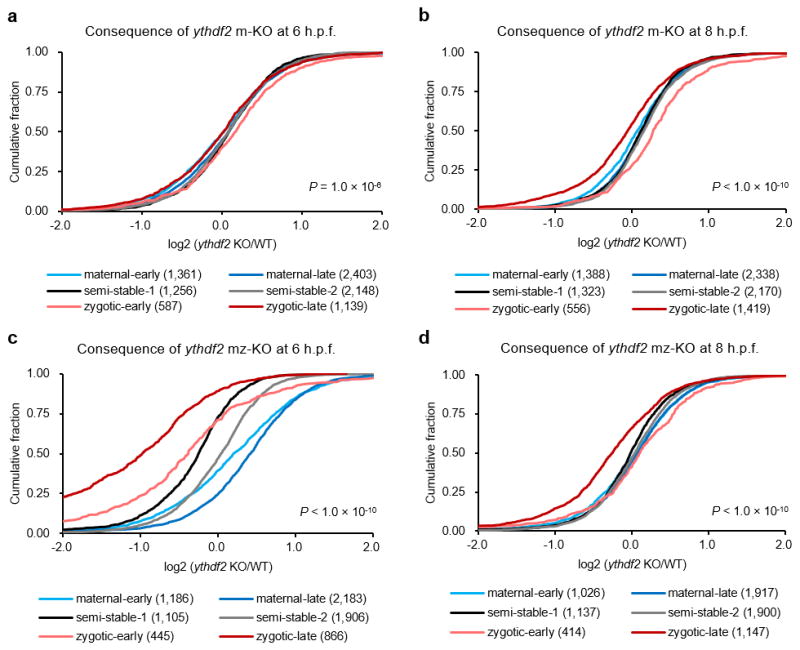
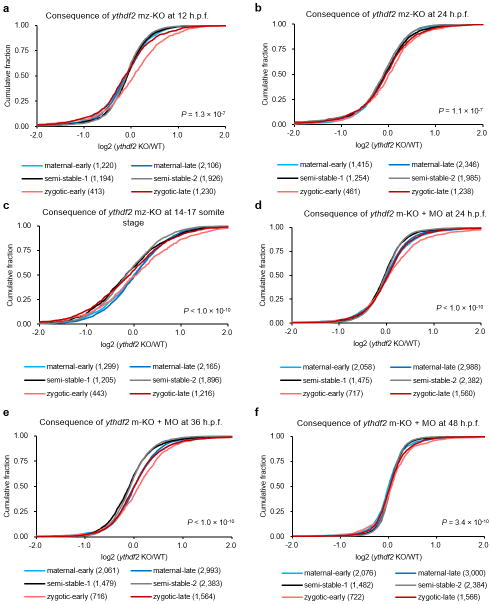
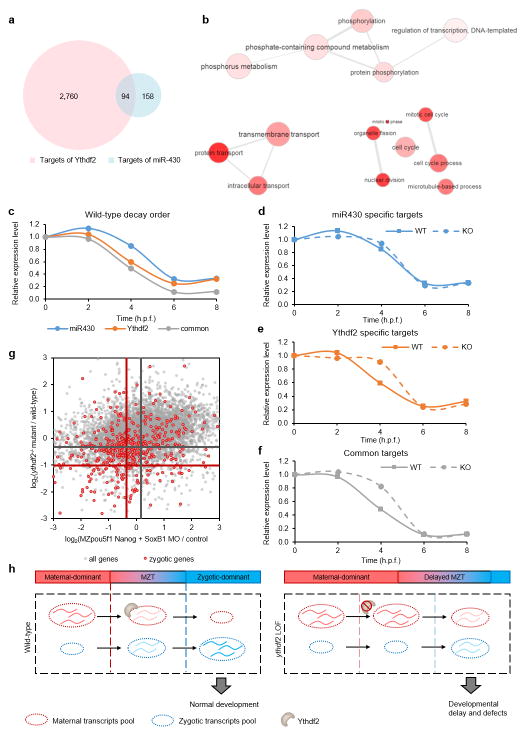
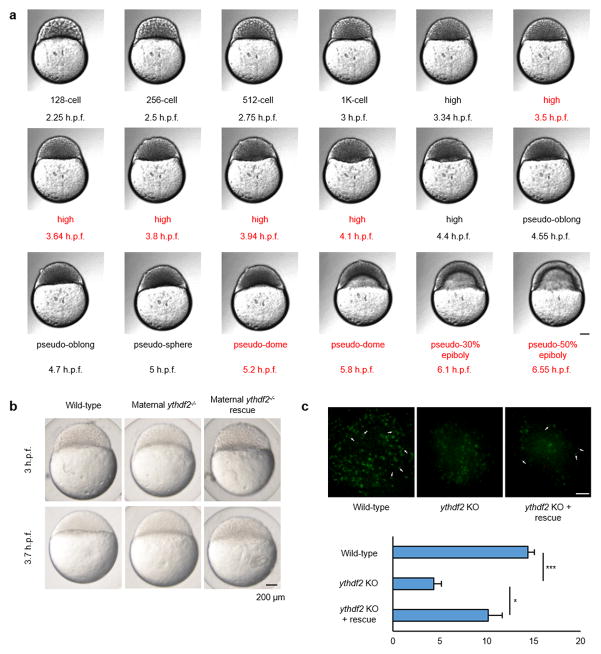
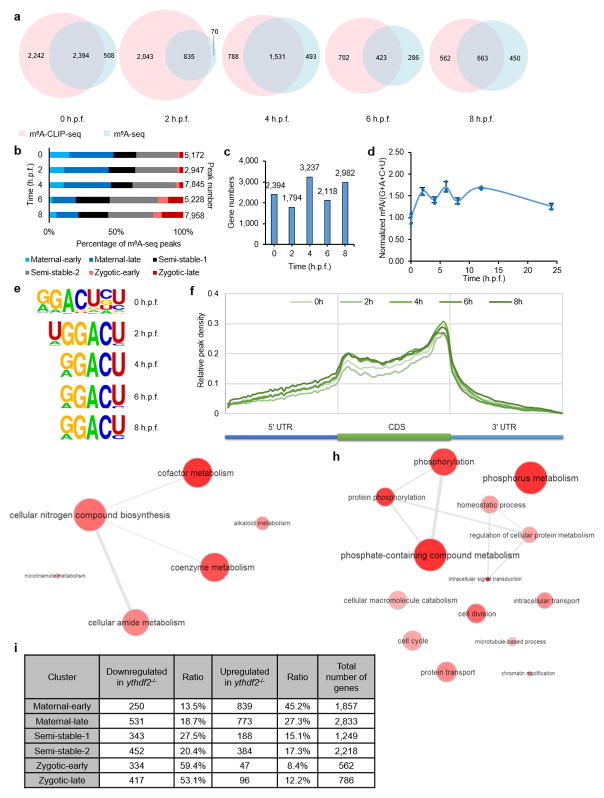
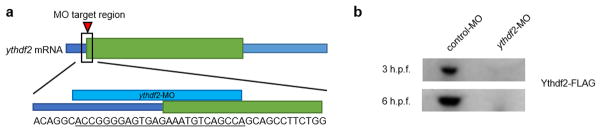
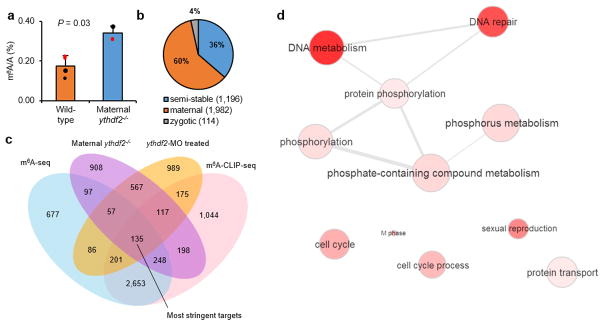
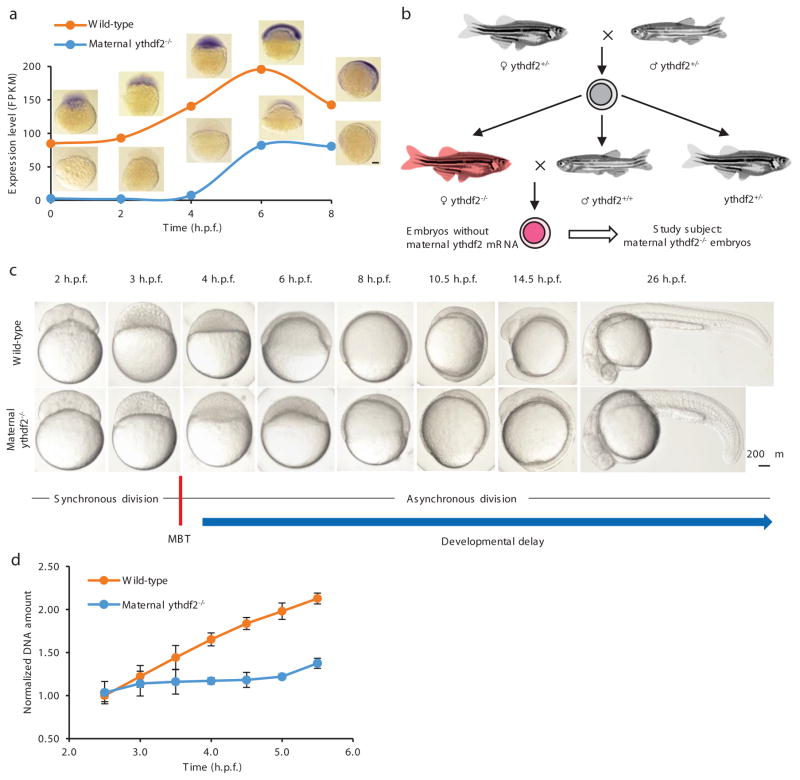
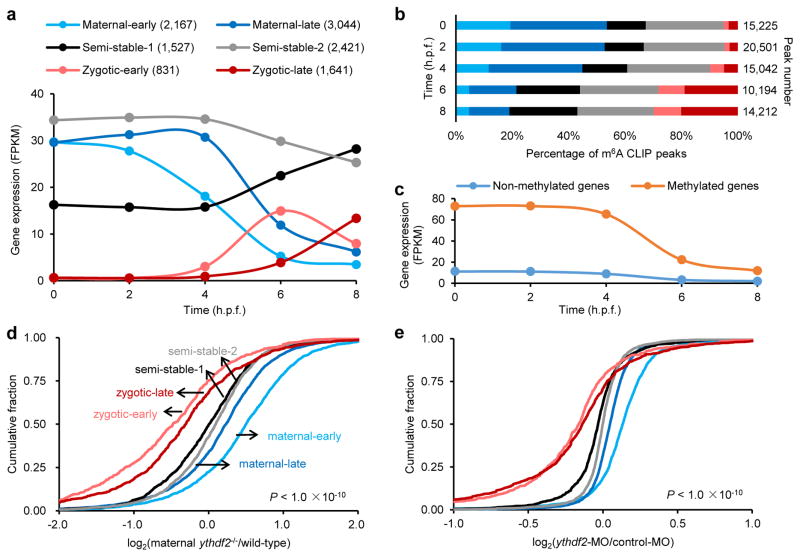
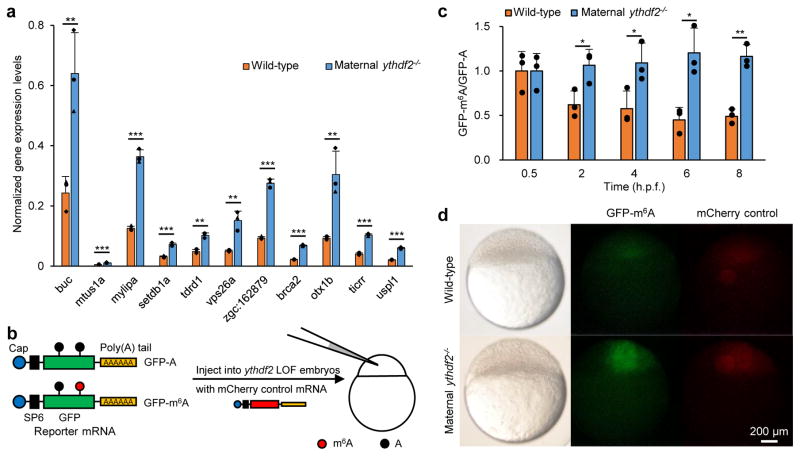
The maternal-to-zygotic transition (MZT) is one of the most profound and tightly orchestrated processes during the early life of embryos, yet factors that shape the temporal pattern of vertebrate MZT are largely unknown. Here we show that over one-third of zebrafish maternal messenger RNAs (mRNAs) can be N6-methyladenosine (m6A) modified, and the clearance of these maternal mRNAs is facilitated by an m6A-binding protein, Ythdf2. Removal of Ythdf2 in zebrafish embryos decelerates the decay of m6A-modified maternal mRNAs and impedes zygotic genome activation. These embryos fail to initiate timely MZT, undergo cell-cycle pause, and remain developmentally delayed throughout larval life. Our study reveals m6A-dependent RNA decay as a previously unidentified maternally driven mechanism that regulates maternal mRNA clearance during zebrafish MZT, highlighting the critical role of m6A mRNA methylation in transcriptome switching and animal development.


Conflict of interest statement

The authors declare no competing financial interests.

Figures

Extended Data Figure 1
Extended Data Figure 1. Generation and characterization of ythdf2 mutant fish
a, Design of transcription activator-like effectors (TALEs) used to generate ythdf2 mutant fish. An 8 bp deletion upstream of the YTH RNA-binding domain is made to create a premature stop codon. b, Photos of adult wild-type and ythdf2−/− mutant fish. Homozygous ythdf2 mutant males are often smaller than wild-type males. c, Table showing the percent of embryos suffering from MBT-period developmental delay and lethality for crosses between different homozygous genotypes. Homozygous mutant females produce ~95% embryos that suffer from MBT-period developmental delay, regardless of paternal genotype. Homozygous mutant males produce on average ~70% embryos that do not develop past the 1-cell stage, regardless of maternal genotype. These two phenotypes can segregate independently from one another and reveal that Ythdf2 is pleiotropic in zebrafish development (see Supplementary Discussion). Each row is tabulated from six to eighteen crosses, scoring between 365 and 1026 embryos, and using randomly selected males and females from each genotype from at least 4 fish of each sex. d, Table showing additional crosses to characterize the paternal-associated lethality and/or sterility of ythdf2 loss of function. Heterozygous males produce about half the number 1-cell arrested offspring as homozygous mutant males, perhaps indicating a function for Ythdf2 in later gametogenesis; this arrest occurs without respect to maternal genotype. Data for each row is tabulated from 5 crosses each, using randomly selected males and females from each genotype from at least 4 fish of each sex.
Extended Data Figure 2
Extended Data Figure 2. Phenotypes of maternal ythdf2−/− mutant embryos
a, Still images taken from the time-lapse movie of a maternal ythdf2−/− mutant embryo filmed between 2.25 h.p.f. and 6.55 h.p.f. highlighting the development delay phenotype occurring during the MBT period. Red texts indicate stages experiencing the delay. All cell divisions are normal in mutant embryos until the cell cycle that should take place between high and oblong stages, cell cycle 12. The high stage in mutant embryos lasts ~ 60 min while the similar stage in wild-type lasts ~ 20 min. Maternal ythdf2−/− mutants lose another ~ 30 min of developmental time between the pseudo-dome and pseudo-50% epiboly stages before reaching the 50% epiboly stage at 6.5 h.p.f. versus 5 h.p.f. in wild-type. b, Injection of ythdf2 mRNA allows partial rescue of the ythdf2 mutant phenotype. Maternal ythdf2−/− mutant embryos injected with 150pg ythdf2 mRNA showed an overall reduction in the cell cycle 12 delay compared to uninjected embryos of the same genotype. In these partially rescued embryos, an appreciable number of cells during cell cycle 12 divided at the same time as wild-type cells did. This partial rescue is nearly 100% penetrant (n=69, four experiments). c, Immunofluorescent microscopy of wild-type, ythdf2 mutant, and ythdf2 mRNA-injected mutant embryos fixed at 3 hours 50 min post-fertilization and stained with anti-phospho-histone H3 (pH3) antibody to label nuclei in late G2 phase through M-phase of the cell cycle. The bar chart shows the average number of condensed pH3-positive nuclei per 100 cells. The results showed that unlike wild-type embryos, maternal ythdf2−/− mutants are lacking in the tight, condensed pH3 nuclei staining characteristic of metaphase/anaphase, which can be partially rescued by the injection of ythdf2 mRNA. Error bars, mean ± s.e.m., n = 8 embryos counted for each condition, 100 cells each embryo. P values were determined using unpaired Student’s t-test.
Extended Data Figure 3
Extended Data Figure 3. Characterization of m6A modification and gene expression change in the early embryonic transcriptome of zebrafish
a, Venn diagrams show the overlap of two replicates of m6A-modified transcripts determined by m6A-seq and m6A-CLIP-seq at five time points. b, Distribution of m6A-sites (number of m6A-seq peaks) in the six gene groups over time. c, Number of m6A-modified genes identified in both m6A-seq and m6A-CLIP-seq at five time points. d, Quantification of the m6A/(G+A+C+U) ratio of mRNAs purified from zebrafish embryos at various developmental time points by LC-MS/MS. The fluctuation observed may reflect the complex dynamics of the decay of the methylated maternal transcripts, the transcription and methylation of newly synthesized zygotic mRNAs, and their subsequent decay during early development. All time points were normalized to 0 h.p.f. value. Error bars, mean ±s.d., n = 3 (technical replicates). e, Consensus motif identified by HOMER with m6A-CLIP peaks at five time points. f, Metagene profiles depict the subtranscript distribution pattern of m6A-sites (from m6A-seq) within the zebrafish transcriptome. m6A-seq peak signals are enriched after the start codon and before the stop codon. g–h, Gene Ontology (GO) analysis of non-methylated maternal transcripts (g) and methylated ones (h). i, Table showing the number of genes downregulated and upregulated in maternal ythdf2−/− mutants at 4 h.p.f. within the 6 gene expression clusters (top 20%).
Extended Data Figure 4
Extended Data Figure 4. Design and knockdown efficiency of the morpholino targeting ythdf2
a, Design of ythdf2 morpholino that targets the intersection of the 5′ UTR and CDS of ythdf2 mRNA. b, Efficiency test of ythdf2 morpholino treatment inhibiting the expression of Ythdf2 by Western blot. mRNAs containing the 5′UTR and full-length CDS of ythdf2 with FLAG tag sequence fused at the C-terminus were co-injected with either control or ythdf2 MO into single cell wild-type embryos. Ythdf2-FLAG was detected by the anti-FLAG antibody. Material from six embryos was loaded into each lane. For gel source data, see Supplementary Figure 1.
Extended Data Figure 5
Extended Data Figure 5. Overlap between methylated genes and upregulated genes in maternal ythdf2−/− embryos
a, Quantification of the m6A/A ratio of the total mRNA purified from maternal ythdf2−/− and wild-type embryos by LC-MS/MS. P values were determined using two-sided Student’s t-test for paired samples. Error bars, mean ± s.d. of two technical replicates (data points with same colour) from two biological experiments. b, Composition of upregulated, methylated genes in maternal ythdf2−/− samples at 4 h.p.f. A total of 3,292 genes are both methylated and upregulated upon ythdf2 LOF, over 60% of which are maternal genes. c, Venn diagram depicts the overlapping of m6A-modified transcripts determined by m6A-seq, m6A-CLIP-seq, and differentially expressed transcripts between ythdf2 LOF samples and controls at 4 h.p.f. The 135 intersected genes were defined as the most stringent Ythdf2 RNA targets. Without including the MO-treated result (but with ythdf2−/− result), we can estimate about 383 Ythdf2 target mRNAs. d, GO analysis of the most stringent Ythdf2 target genes.
Extended Data Figure 6
Extended Data Figure 6. Methylation profiles of Ythdf2 target transcripts
a, Examples of Ythdf2 RNA targets harboring both m6A-seq peaks and m6A-CLIP-seq peaks. Coverage of m6A immunoprecipitation (IP) and input fragments are indicated in red and blue, respectively. m6A-CLIP-seq peaks are highlighted in green. Grey lines signify CDS borders. b, The dynamics of m6A immunoprecipitation (IP) signals over time in Ythdf2 RNA targets. Coverage of m6A immunoprecipitation (IP) and input fragments are indicated in red and grey, respectively. The locations of consensus motifs of GGACU and AGACU are indicated as blue dots. Red lines show splice junctions. Blue squares mark the peaks identified from the m6A-seq signals. Example genes shown: buc, mtus1a, mylipa, setdb1a, tdrd1, vps26a, and zgc:162879.
Extended Data Figure 7
Extended Data Figure 7. Degradation of reporter mRNAs in ythdf2 LOF and control embryos
The in vivo degradation of GFP-m6A mRNAs was faster than GFP-A mRNAs when co-injected with control MO. In contrast, GFP-m6A mRNAs displayed an undistinguishable decay rate from GFP-A mRNAs when co-injected with ythdf2 MO. The abundances of GFP-m6A and GFP-A mRNAs were determined by RT-qPCR. Error bars, mean ± s.d, n = 3 (technical replicates). P values were determined using two-sided Student’s t-test for two samples with equal variance.
Extended Data Figure 8
Extended Data Figure 8. Zygotic Ythdf2 facilitates continued regulation of maternal mRNA clearance during late MZT (6–8 h.p.f.)
Cumulative distribution of the log2 fold changes of RNA expression after 4 h.p.f. for the six gene groups between maternal ythdf2−/− (m-KO) and wild-type (a, b), or maternal-zygotic ythdf2−/− (mz-KO) and wild-type (c, d). Colour code and gene numbers of each gene group are listed under each figure panel. Compared to the relatively unchanged curves of semi-stable gene groups (black and grey), the right shift of blue curves indicates the increase of maternal RNAs while the left shift of red curves indicates the decrease of zygotic RNAs in mutant samples versus wild-type ones. While the gene expression patterns of m-KO samples remain largely unchanged at 6 h.p.f. (a) and 8 h.p.f. (b), mz-KO samples show significant retention of maternal genes and delayed activation of zygotic genes at 6 h.p.f. (c) and continued notable delay of zygotic expression at 8 h.p.f. (d), indicating zygotically expressed Ythdf2 also functions on maternal mRNA during late MZT. Gene group categorization was based on the expression pattern data from 0 – 8 h.p.f. P values were calculated using two-sided Kruskal-Wallis test. Representative data shown from two independent experiments.
Extended Data Figure 9
Extended Data Figure 9. Ythdf2 does not cause transcriptome-wide zygotic gene expression change during the zygotic stage of zebrafish early development (12–48 h.p.f.)
Cumulative distribution of the log2 fold changes of RNA expression during the zygotic stage of zebrafish early development for the six gene groups between mutant and wild-type embryos. a–b, mz-KO samples exhibit largely unchanged gene expression patterns at 12 h.p.f. (a) and 24 h.p.f. (b) versus wild-type, indicating that Ythdf2 does not impact the degradation of zygotic mRNA on the organismal level during this time period. c, Considering the potential time-matched inaccuracy due to the delayed zygotic gene expression in the mutant embryos, we performed a stage-matched comparison at the 14–17 somite stage (WT 16 h.p.f. vs KO 17.5 h.p.f.) and observed very similar, unchanged gene expression profiles between mutant and wild-type embryos. Both time-matched and stage-matched comparisons reveal largely indistinguishable zygotic transcriptome profiles during the investigated zygotic stage corresponds nicely with the lack of abnormal developmental phenotypes in ythdf2 mz-KO embryos during this time period. d–f, To avoid the involvement of paternal effect from male ythdf2 KO fish, we used maternal KO embryos (from wild-type male) injected with ythdf2-MO (m-KO + MO) to achieve maternal and zygotic depletion of Ythdf2. We investigated the RNA expression of all genes between wild-type and ythdf2 LOF groups during later developmental stages and observed largely unchanged gene expression patterns in m-KO + MO samples at 24 h.p.f. (d), 36 h.p.f. (e), and 48 h.p.f. (f) versus wild-type, which indicate that Ythdf2 does not impact the degradation of zygotic mRNA on the transcriptome level during late zygotic stages. Gene group categorization was based on the expression pattern data from 0 – 8 h.p.f. P values were calculated using two-sided Kruskal-Wallis test. Representative data shown from two independent experiments.
Extended Data Figure 10
Extended Data Figure 10. Target overlap of Ythdf2 and miR-430 regulation pathways
a, Target overlap between Ythdf2 and miR-430. Genes with more than 1.5-fold upregulation upon removal of maternal Ythdf2 or miR-430 were used as corresponding targets in the analysis. b, GO analysis of the common target genes of Ythdf2 and miR-430. c–f, Differential temporal regulation of the targets of miR430 and Ythdf2. In wild-type embryos, common targets are decayed first, followed by Ythdf2-specific targets, and then miR430-specific targets (c). Upon maternal ythdf2 knockout, the decay of the miR430-specific targets showed minimal delay (d), while the Ythdf2-specific targets and the common targets show more significant decay delays; the latter finding is consistent with Ythdf2 as a maternally-supplied factor able to degrade maternal mRNAs earlier in time (e, f). Relative expression level is calculated by the median of the expression levels of all genes and normalized to the value at 0 h.p.f., respectively. g, Maternal ythdf2−/− embryos show a similar zygotic genome activation delay as Nanog+Sox19b+Pou5f3 LOF embryos at 4 h.p.f. The log2 fold change of the mRNA-seq data of maternal ythdf2−/− mutants and the published mRNA-seq data with combined loss of nanog, sox19b (soxB1), and pou5f3 (oct4 homolog) were plotted in the same diagram. Zygotic genes (red dots) were separately plotted out from all genes (grey dots). Intersections of crosslines mark the median points of each group of genes. h, proposed mechanism of Ythdf2 regulating zebrafish MZT: Ythdf2-mediated RNA decay ensures the timely clearance of maternal RNA; Without Ythdf2, m6A-modified maternal RNA are overrepresented in the transcriptome during MZT, causing delayed zygotic genome activation and a significant developmental delay.
Figure 1
Figure 1. The deficiency of m6A-binding protein Ythdf2 in zebrafish embryo led to a developmental delay
a, Expression profile of ythdf2 mRNA in wild-type and maternal ythdf2−/− embryos from crossing ythdf2−/− female and wild-type male fish. mRNA-seq and in situ hybridization revealed the mutation eliminated ythdf2 mRNA prior to 4 h.p.f. b, Crossing scheme to show the origin of maternal ythdf2−/− embryos used in this study. c, Time-matched bright field images of embryos showing that maternal ythdf2−/− embryos experience an early-stage delay maintained throughout early development. d, Quantification of DNA amounts in wild-type and mutant embryos pre- and post-MBT (2.5–5.5 h.p.f.). Error bars, mean ± s.e.m., n = 3 (biological replicates).
Figure 2
Figure 2. Maternal RNAs are m6A-modified and their clearance is hindered by ythdf2 loss-of-function (LOF)
a, Expression profiles of six gene groups clustered by their RNA abundance over time (0 – 8 h.p.f.) determined by RNA sequencing: maternal-early (degradation starting at 2 h.p.f), maternal-late (decrease after 4 h.p.f.), zygotic-early (onset at 4 h.p.f. and peak at 6 h.p.f.), zygotic-late (onset at 6 h.p.f.), and two semi-stable gene groups (relatively stable expression over time). b, Distribution of m6A-sites (number of m6A-CLIP-seq peaks) in the six gene groups over time (the same colour code as a). c, Expression profiles of m6A-modified and non-modified maternal transcripts over time. d–e, Cumulative distribution of the log2 fold changes of RNA expression at 4 h.p.f. for the six gene groups between maternal ythdf2−/− and wild-type (d), or ythdf2 morpholino (MO) treated and control (e). Compared to the relatively unchanged curves of semi-stable gene groups (black and grey), the right shift of blue curves indicates the increase of maternal RNAs while the left shift of red curves indicates the decrease of zygotic RNAs in ythdf2 LOF samples versus control. P values were calculated using two-sided Kruskal-Wallis test. Representative data shown from two independent experiments.
Figure 3
Figure 3. Ythdf2 is required for m6A-dependent RNA decay
a, RT-qPCR validation of the relative abundance of representative Ythdf2 targets increased at 4 h.p.f. in maternal ythdf2−/− samples compared with wild-type. b, Design of the reporter RNA. m6A-modified (GFP-m6A) or non-modified GFP mRNAs (GFP-A) were prepared and co-injected with mCherry control mRNA into one-cell stage embryos. c, The in vivo degradation of GFP-m6A mRNAs was faster in wild-type embryos but slightly slower in maternal ythdf2−/− ones than GFP-A mRNAs. mRNA abundance was determined by RT-qPCR and normalized to 0.5 h.p.f. values. d, Comparison of GFP-m6A expression levels in wild-type and maternal ythdf2−/− embryos at the oblong stage of development (stage-matched embryos, 3.8 h.p.f. for wild-type and 4.2 h.p.f. for mutants). The m6A-modified GFP reporter RNA produced consistently higher GFP protein levels in maternal ythdf2−/− embryos versus wild-type embryos. Quantification of the overall phenomena: 61/72 embryos (85%) for maternal ythdf2−/− and 59/85 (70%) for wild-type in two experiments. Error bars, s.d., n = 3 (technical replicates). P values were determined using two-sided Student’s t-test for two samples with equal variance.

Comment in

Similar articles

Cited by

References

    1. Tadros W, Lipshitz HD. The maternal-to-zygotic transition: a play in two acts. Development. 2009;136:3033–3042. - PubMed
    1. Lee MT, Bonneau AR, Giraldez AJ. Zygotic genome activation during the maternal-to-zygotic transition. Annu Rev Cell Dev Bi. 2014;30:581–613. - PMC - PubMed
    1. Walser CB, Lipshitz HD. Transcript clearance during the maternal-to-zygotic transition. Curr Opin Genet Dev. 2011;21:431–443. - PubMed
    1. Giraldez AJ, et al. Zebrafish miR-430 promotes deadenylation and clearance of maternal mRNAs. Science. 2006;312:75–79. - PubMed
    1. Mishima Y, Tomari Y. Codon usage and 3′UTR length determine maternal mRNA stability in zebrafish. Mol Cell. 2016;61:874–885. - PubMed

Publication types

MeSH terms