. 2017 Mar 31;292(13):5291-5310.
doi: 10.1074/jbc.M116.764282. Epub 2017 Feb 9.

Understanding the FRET Signatures of Interacting Membrane Proteins

Affiliations

Understanding the FRET Signatures of Interacting Membrane Proteins

Christopher King et al. J Biol Chem. .

Abstract

FRET is an indispensable experimental tool for studying membrane proteins. Currently, two models are available for researchers to determine the oligomerization state of membrane proteins in a static quenching FRET experiment: the model of Veatch and Stryer, derived in 1977, and the kinetic theory-based model for intraoligomeric FRET, derived in 2007. Because of confinement in two dimensions, a substantial amount of FRET is generated by energy transfer between fluorophores located in separate oligomers in the two-dimensional bilayer. This interoligomeric FRET (also known as stochastic, bystander, or proximity FRET) is not accounted for in either model. Here, we use the kinetic theory formalism to describe the dependence of the FRET efficiency measured in an experiment (i.e. the "total apparent FRET efficiency") on the interoligomeric FRET due to random proximity within the bilayer and the intraoligomeric FRET resulting from protein-protein interactions. We find that data analysis with both models without consideration of the proximity FRET leads to incorrect conclusions about the oligomeric state of the protein. We show that knowledge of the total surface densities of fluorophore-labeled membrane proteins is essential for correctly interpreting the measured total apparent FRET efficiency. We also find that bulk, two-color, static quenching FRET experiments are best suited for the study of monomeric, dimerizing, or dimeric proteins but have limitations in discerning the order of larger oligomers. The theory and methodology described in this work will allow researchers to extract meaningful parameters from static quenching FRET measurements in biological membranes.

Keywords: cell surface receptor; fluorescence resonance energy transfer (FRET); mathematical modeling; membrane biophysics; membrane protein.


Conflict of interest statement

The authors declare that they have no conflicts of interest with the contents of this article

Figures

FIGURE 1.
FIGURE 1.
Predictions of the monomer-only simulation. A, sample configuration of monomers from the simulation. The figure is drawn to scale, and units on axes are nm. B, Eapp plotted as a function of acceptor fraction. The dashed lines connect data points with constant [T], as indicated by the numbers on the right. C, Eapp is plotted as a function of the total concentration, [T]. The dashed lines connect data points with constant acceptor fraction, xA, as indicated on the right.
FIGURE 2.
FIGURE 2.
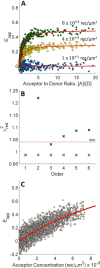
Analysis results for the monomer-only simulations. A, the total apparent FRET efficiency, Eapp, with added random noise as a function of the A/D ratio at [T] = 8 × 10+3 rec/μm2 (green), [T] = 4 × 10+3 rec/μm2 (yellow), and [T] = 1 × 10+1 rec/μm2 (blue). In addition, the best fits of Eapp with the model of Veatch and Stryer are shown in red. B, best fit reduced χ2 versus oligomer order for the analysis of Eapp in the presence of random noise with the thermodynamic model based on the kinetic theory formalism, with and without an interoligomeric proximity FRET contribution (green and black symbols, respectively). The dotted line is the 95% confidence cut-off for the reduced χ2 test: all fits with reduced χ2 values above this line are rejected, and all fits with reduced χ2 values below this line are accepted as equally likely models, given the data and their associated error. Analysis without a proximity FRET contribution does produce acceptable models for n = 1 and n =3. Analysis with the proximity FRET consideration shows that all models provide an acceptable fit to the data, but the best fit ΔG0 indicates a lack of interactions. C, the apparent FRET efficiency with added Gaussian noise is plotted as a function of the acceptor surface density (black circles) and the best fit monomer-only model (red line) for an exclusion radius of 1.4 nm (see Equation 20 and Table 1).
FIGURE 3.
FIGURE 3.
Predictions of the monomer-dimer simulation, = 0.70. A, the dimeric fraction utilized in the monomer-dimer simulation ranges from ∼0 to ∼80%. B, a sample configuration with both monomers and dimers at [T] rec/μm2. Dimers are represented by circles with a connecting line. Blue, donors; red, acceptors. The figure is drawn to scale, and units on axes are nm. C, Eapp (black circles) and Eoligo (blue circles) are plotted as a function of the total fluorophore concentration. D, Eapp and Eprox (black and red circles, respectively) versus [T]. The dashed lines connect data points at constant acceptor fraction, xA, as indicated by the numbers on the right.
FIGURE 4.
FIGURE 4.
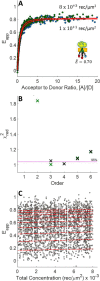
Analysis results of the monomer-dimer simulations, = 0.70. A, Eapp and Eoligo versus acceptor fraction for [T] = 8 × 10+3 rec/μm2 (top), [T] = 4 × 10+3 rec/μm2 (middle), and [T] = 1 × 10+1 rec/μm2 (black circles and blue circles, respectively). Dashed lines connect data points at constant [T], as indicated. B, the total apparent FRET efficiency with added random noise as a function of the A/D ratio at [T] = 8 × 10+3 rec/μm2 (green), [T] = 4 × 10+3 rec/μm2 (yellow), and [T] = 1 × 10+1 rec/μm2 (blue). In addition, the best fits of Eapp with the model of Veatch and Stryer are shown in red. C, the best fit reduced χ2 versus oligomer order for the analysis of Eapp in the presence of random noise with the thermodynamic model based on the kinetic theory formalism, with and without an interoligomeric proximity FRET contribution (green and black symbols, respectively). The dotted line is the 95% confidence cut-off for the reduced χ2 test. Analysis without a proximity FRET contribution does not produce acceptable models for any order. Analysis with the proximity FRET contribution shows that the n = 2 model is the only model that passes the reduced χ2 test. Thus, an interoligomeric proximity FRET contribution is required for proper modeling of the total apparent FRET efficiency with a monomer-dimer equilibrium. D, the simulated monomer-dimer data with added random noise (black) and the best fit n = 2 model (red) are plotted as a function of total concentration.
FIGURE 5.
FIGURE 5.
The predictions of the monomer-dimer simulations as a function of total concentration for = 0.70 (A) and = 0.30 (B), plotted as black circles. The linear approximation, EappEprox + Eoligo, as a function of total concentration is plotted as blue circles. The dashed lines connect data points of constant acceptor fraction, xA, as indicated on the right. The green shaded areas represent the regions of applicability of Equation 7.
FIGURE 6.
FIGURE 6.
Predictions of the dimer-only simulation, = 0.70. A, a sample configuration of dimers, as utilized in the simulation, with [T] = 8 × 10+3 rec/μm2. The figure is drawn to scale, and units on axes are nm. Blue circles, donors; red circles, acceptors. B, Eapp and Eoligo are plotted as a function of total concentration, [T]. C, Eapp (black circles) and Eprox (red circles) as a function of total fluorophore surface density. In both panels, dashed lines connect data points at constant acceptor fraction, xA, as indicated by the numbers on the right.
FIGURE 7.
FIGURE 7.
Analysis results of the dimer-only simulations, = 0.70. A, Eapp (black circles) and Eoligo (blue circles) plotted as a function of acceptor fraction, xA, for [T] = 8 × 10+3 rec/μm2 (top curve) and [T] = 1 × 10+1 rec/μm2 (bottom curve). Dashed lines connect data points at constant [T]. The Eoligo curves overlap for all [T]. B, total apparent FRET efficiency with added random noise as a function of the A/D ratio at [T] = 8 × 10+3 rec/μm2 (green) and [T] = 1 × 10+1 rec/μm2 (blue). In addition, the best fits of Eapp with the model of Veatch and Stryer are shown as red lines. C, best fit reduced χ2 versus oligomer order for the analysis of Eapp in the presence of random noise with the thermodynamic model based on the kinetic theory of FRET both with and without an interoligomeric proximity FRET contribution (green and black crosses, respectively). The dotted line is the 95% confidence cut-off for the reduced χ2 test. Analysis without a proximity FRET contribution does not produce acceptable models for any order. Meanwhile, for analysis with proximity FRET consideration, the n = 2 model is the only model that passes the reduced χ2 test. D, simulated dimer-only data with added random noise (black) and the best fit n = 2 model (red) plotted as a function of total concentration.
FIGURE 8.
FIGURE 8.
Predictions of the constitutive tetramer simulation, = 0.70. A, a sample configuration of tetramers, as used in the simulation with a total surface density, [T] = 8 × 10+3 rec/μm2. The figure is drawn to scale, and units on axes are nm. B, Eapp and Eoligo versus [T] (black and blue circles, respectively). C, Eapp (black circles) and Eprox (red circles) plotted as a function of total fluorophore concentration. In both panels, dashed lines connect data points of constant acceptor fraction, xA, given by the values on the right.
FIGURE 9.
FIGURE 9.
Analysis results for the constitutive tetramer simulations, = 0.70. A, the total apparent FRET efficiency with added random noise as a function of the A/D ratio at [T] = 8 × 10+3 rec/μm2 (green) and [T] = 1 × 10+1 rec/μm2 (blue). In addition, the best fits of Eapp with the model of Veatch and Stryer are shown as red lines. B, best fit reduced χ2 value versus oligomer order for the analysis of Eapp with the thermodynamic model based on the kinetic theory formalism with and without an interoligomeric proximity FRET contribution (green and black symbols, respectively). The dotted line is the 95% confidence limit cut-off for the reduced χ2 test. In the presence of random noise, all models without a proximity FRET contribution fail the reduced χ2 test, except for the n = 4 model. Both n = 3 and n = 4 provide acceptable fits to the data when a proximity FRET contribution is included. Thus, the oligomer order is not discernable for this data set, but the presence of dimers is excluded. C, the apparent FRET efficiency with added Gaussian noise (black circles) and the best fit n = 4 model (red circles) is plotted as a function of the total concentration.
FIGURE 10.
FIGURE 10.
Comparison of the total apparent FRET efficiency for constitutive trimers, tetramers, and pentamers. The total apparent FRET efficiency is plotted as a function of total concentration for trimers, = 0.74, as triangles and for constitutive tetramers and constitutive pentamers, = 0.70, as squares and stars, respectively. The total apparent FRET efficiency for higher order oligomerization is not unique across a wide range of concentrations.
FIGURE 11.
FIGURE 11.
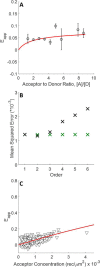
Analysis results of the ErbB2 ECTM measurements made in cell-derived vesicles. A, the total apparent FRET efficiency is binned and plotted as a function of the A/D ratio for [T] < 2 × 10+3 rec/μm2. Error bars, S.E. In addition, the best fit of the data with the model of Veatch and Stryer is plotted as a red line. B, best fit MSE versus oligomer order for the analysis of Eapp with the thermodynamic model based on the kinetic theory formalism with and without an interoligomeric proximity FRET contribution (green and black symbols, respectively). When the proximity FRET is accounted for, there is no minimum in the MSE versus order plot, and the best fit parameters for each order indicate a lack of protein-protein interactions. However, when the proximity FRET is not accounted for in the model of the total apparent FRET efficiency, the best fit occurs at n = 2 and incorrectly indicates dimer formation. C, total apparent FRET efficiency and the best fit n = 1 model (red line) are plotted as a function of the acceptor concentration.

Similar articles

Cited by

References

    1. Böhme I., and Beck-Sickinger A. G. (2009) Illuminating the life of GPCRs. Cell Commun. Signal. 7, 16. - PMC - PubMed
    1. Low-Nam S. T., Lidke K. A., Cutler P. J., Roovers R. C., van Bergen en Henegouwen P. M., Wilson B. S., and Lidke D. S. (2011) ErbB1 dimerization is promoted by domain co-confinement and stabilized by ligand binding. Nat. Struct. Mol. Biol. 18, 1244–1249 - PMC - PubMed
    1. Chung I., Akita R., Vandlen R., Toomre D., Schlessinger J., and Mellman I. (2010) Spatial control of EGF receptor activation by reversible dimerization on living cells. Nature 464, 783–787 - PubMed
    1. King C., Sarabipour S., Byrne P., Leahy D. J., and Hristova K. (2014) The FRET signatures of non-interacting proteins in membranes: simulations and experiments. Biophys. J. 106, 1309–1317 - PMC - PubMed
    1. Sako Y., Minoghchi S., and Yanagida T. (2000) Single-molecule imaging of EGFR signalling on the surface of living cells. Nat. Cell Biol. 2, 168–172 - PubMed

Substances

LinkOut - more resources