. 2017 Feb 8;9(376):eaaf9655.
doi: 10.1126/scitranslmed.aaf9655.

IgA-coated E. coli enriched in Crohn's disease spondyloarthritis promote TH17-dependent inflammation

Affiliations

IgA-coated E. coli enriched in Crohn's disease spondyloarthritis promote TH17-dependent inflammation

Monica Viladomiu et al. Sci Transl Med. .

Abstract

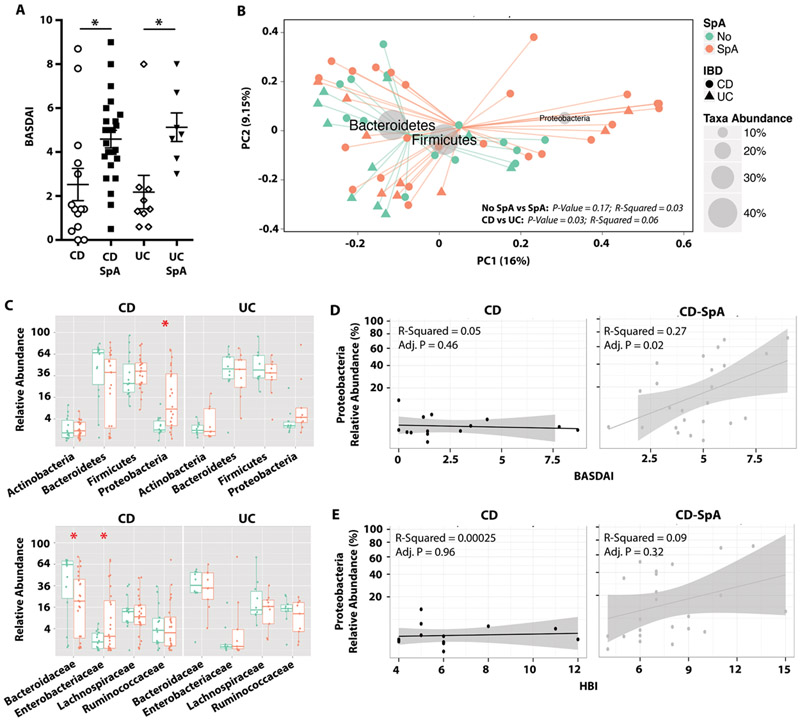
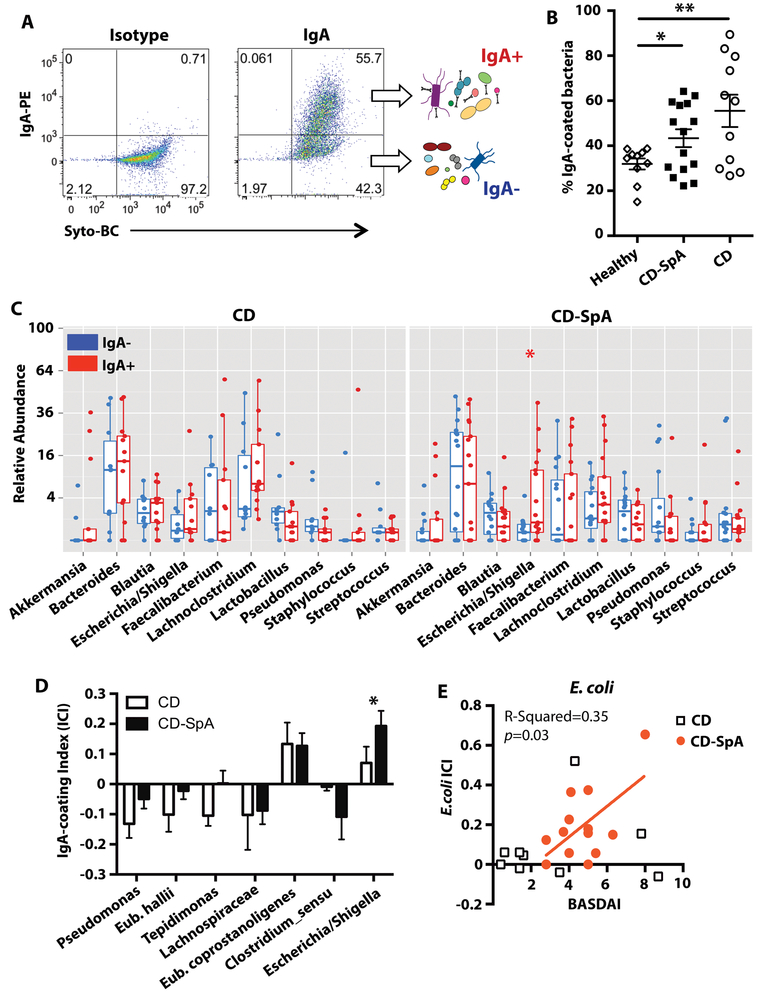
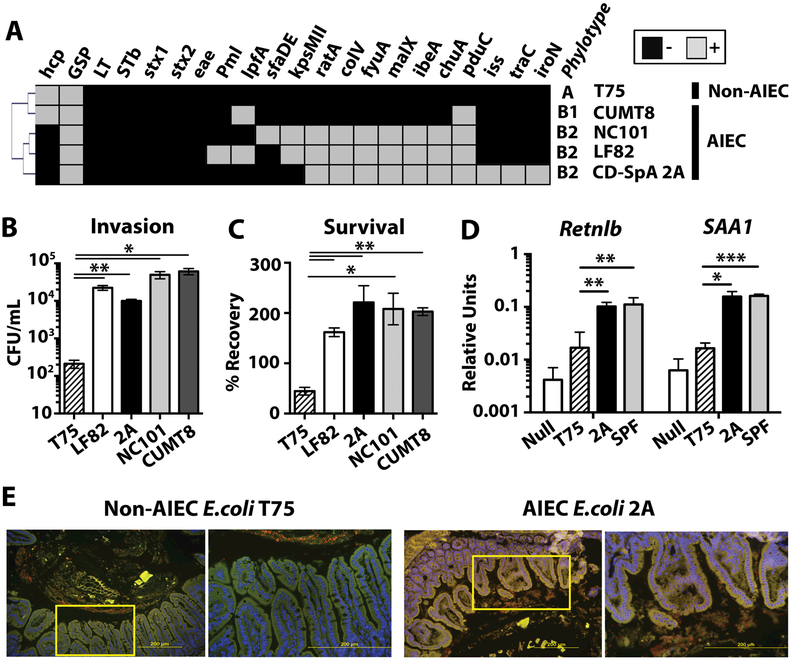
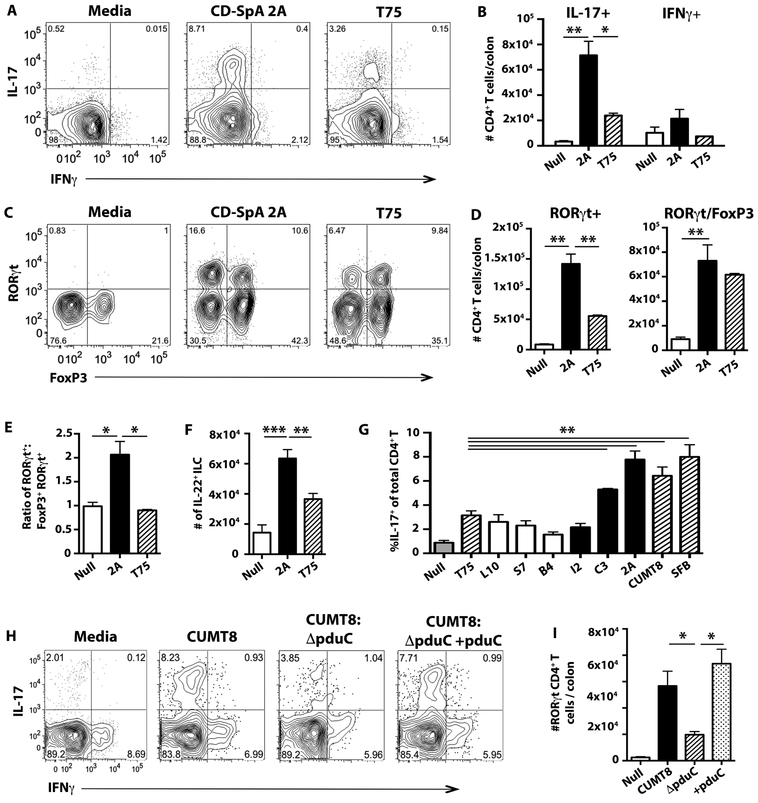
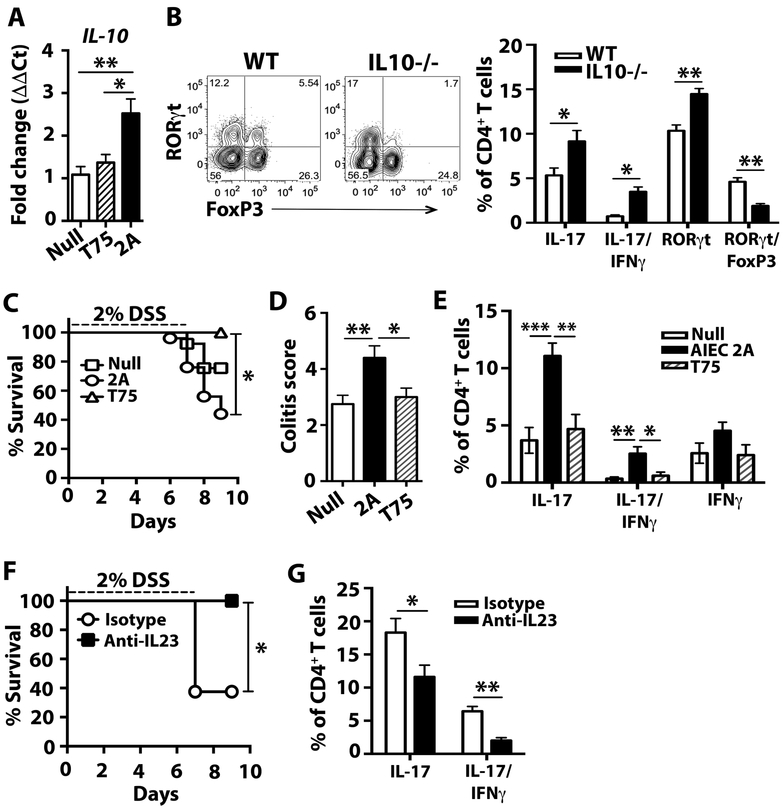
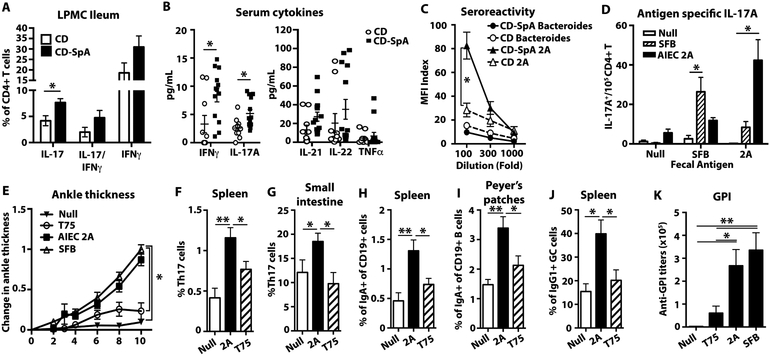
Peripheral spondyloarthritis (SpA) is a common extraintestinal manifestation in patients with active inflammatory bowel disease (IBD) characterized by inflammatory enthesitis, dactylitis, or synovitis of nonaxial joints. However, a mechanistic understanding of the link between intestinal inflammation and SpA has yet to emerge. We evaluated and functionally characterized the fecal microbiome of IBD patients with or without peripheral SpA. Coupling the sorting of immunoglobulin A (IgA)-coated microbiota with 16S ribosomal RNA-based analysis (IgA-seq) revealed a selective enrichment in IgA-coated Escherichia coli in patients with Crohn's disease-associated SpA (CD-SpA) compared to CD alone. E. coli isolates from CD-SpA-derived IgA-coated bacteria were similar in genotype and phenotype to an adherent-invasive E. coli (AIEC) pathotype. In comparison to non-AIEC E. coli, colonization of germ-free mice with CD-SpA E. coli isolates induced T helper 17 cell (TH17) mucosal immunity, which required the virulence-associated metabolic enzyme propanediol dehydratase (pduC). Modeling the increase in mucosal and systemic TH17 immunity we observed in CD-SpA patients, colonization of interleukin-10-deficient or K/BxN mice with CD-SpA-derived E. coli lead to more severe colitis or inflammatory arthritis, respectively. Collectively, these data reveal the power of IgA-seq to identify immunoreactive resident pathosymbionts that link mucosal and systemic TH17-dependent inflammation and offer microbial and immunophenotype stratification of CD-SpA that may guide medical and biologic therapy.


Figures

Fig. 1.
Fig. 1.. Clinical and microbial markers segregate CD and CD-SpA.
A. Bath Ankylosing Spondylitis Disease Activity Index (BASDAI) was calculated for each subject. ANOVA, **P<0.01. B. Subjects were clustered using PCoA with Bray-Curtis distances. Gray circles represent taxa abundance. P-value estimates calculated by Monte Carlo permutation test are indicated for CD vs. UC and No SpA vs. SpA. C. Relative abundances of top 4 phyla (top panel) and families (bottom panel) are shown for No SpA (green) and SpA (orange). Boxplots reflect 25 and 75% confidence interval and horizontal line reflects median. P-values < 0.05 are indicated with an asterisk, Mann-Whitney. D, E. Correlation between abundance of Proteobacteria is plotted against clinical joint disease activity score (BASDAI) (D) or Crohn’s disease activity (HBI) (E). Linear regression analysis and adjusted p-values are shown for both D and E. For all panels, CD N=15, CD-SpA N=25, UC N=10, UC-SpA N=9.
Fig. 2.
Fig. 2.. IgA-coated microbiota in CD-SpA are enriched for E. coli.
A. The IgA-coated sort strategy is shown. Fecal homogenate was filtered, blocked and stained with cell permeable DNA dye Syto-BC and isotype or anti-IgA antibody. Samples were gated based on FSC/SSC. B. Percentage IgA-coated bacteria in fecal homogenate for individuals grouped by disease status. ANOVA, * P<0.05. CD N=11, CD-SpA N=15 C. Relative abundance of the top 10 most abundant taxa by genus are shown grouped by IgA negative (blue) or IgA positive (red) and faceted by CD or CD-associated SpA (CD-SpA). Boxplots reflect 25 and 75% confidence interval and horizontal line reflects median. P-values < 0.05 are indicated, Mann-Whitney D. IgA coating index (ICI) was calculated for each individual taxa as -(log(IgA+) – log(IgA-))/(log(IgA+) + log(IgA-)). Taxa with IgA index > 0.1 or <−0.01 are shown. CD (N=10) and CD-SpA (N=13). Asterisk indicates p-values < 0.05, Mann-Whitney. E. Correlation between ICI and clinical joint disease activity (BASDAI) is shown for both CD (square) and CD-SpA (orange circle). Linear regression analysis reveals significant correlation for CD-SpA (p=0.03). For C-E, CD N=10, CD-SpA N=13.
Fig 3.
Fig 3.. CD-SpA-derived Adherent-invasive E. coli (AIEC) initiates epithelial immunity.
A. The presence (gray) or absence (black) of AIEC-associated virulence factors genes was determined by PCR for E. coli isolates T75 (non-AIEC), CUMT8 and NC101 (mouse-derived AIEC), LF82 (human-derived AIEC), and CD-SpA isolate 2A. Hierarchical clustering was performed using average linkage clustering and Pearson correlation distance metric. B. Invasion of Caco-2 cells by E. coli isolates was assessed by gentamicin protection assay. The mean colony forming units (cfu) / ml is presented. C. Survival in J774 macrophages by E. coli isolates was assessed by gentamicin protection assay. The percentage of input cfu recovered following gentamicin protection in J774 macrophages is shown. SEM is shown for each group. p-values *<0.05, **<0.01 are indicated, T-test. All samples were run in triplicate with N=3–5 biological replicates for each group. D. qPCR analysis of Retnlb and SAA1 expression by ileal epithelial cells 5 days after colonization with SPF microbiota, CD-SpA E. coli 2A, non-AIEC T75 or media control. Bar graph represent the geometric mean for 4–8 mice / group from 2 independent experiments. Error bars represent SEM. p-values *<0.05, **<0.01 are indicated, ANOVA. E. FISH of ileal mucosa 5 days after mono-colonization with E. coli isolate T75 or 2A. Nuclei are stained with DAPI (blue) and an E.coli are stained with a 16S rRNA probe (red). Tissue autofluorescence is in green. Yellow box indicates inset displayed in the right panel.
Fig. 4.
Fig. 4.. CD-SpA AIEC promotes mucosal Th17 immunity.
A-F. Germ-free C57BL/6 mice were colonized with 2 × 10⁹ CFU of CD-SpA-derived E. coli isolate 2A or non-adherent E. coli T75 and analyzed after 10 days. Data presented are 1 of 5 total experiments with at least 3 mice per experimental group (A-F). Error bars represent SEM. p-values indicated, ANOVA. A. Live, CD4+ T cells were identified by flow cytometry using a lymphocyte FSC gate and CD4+, TCRβ expression. Intracellular cytokine staining was used to evaluate IL-17 and IFNγ 4 hour stimulation with PMA/ionomycin with Brefeldin-A. B. Total number of IL-17 and IFNγ producing CD4+ T cells per colon for each experimental group. Bar graphs represent geometric mean for 3 mice per group C. Flow cytometry of live, CD4+ T cells was used to evaluate RORγt and Foxp3 expression in colonic lamina propria. D. Total number of RORγt or RORγt/Foxp3 CD4+ T cells per colon is shown in media gavage (null), CD-SpA E. coli 2A, or T75 colonized mice. Bar graph represents geometric mean of 3 mice / group. E. Ratio of RORγt+ cells: Foxp3+RORγt+ CD4+ T cells in the colonic lamina propria of mice colonized with the indicated microbes. Bar graphs represent geometric mean of ratio. F. Total number of live, lineage negative (CD19, CD3, CD11b, TCRγδ), CD127+ innate cells producing IL-22 in the colonic lamina propria. G. Non-colonized (Null, gray); non-AIEC E. coli T75 (hatched); CD-derived isolates L10, S7, B4 (white); CD-SpA derived isolates I2, C3, 2A (black); and mouse SFB or AIEC CUMT8 (hatched) were used to colonize germ-free C57BL/6 mice and analyzed after 10 days. Flow cytometry of live, CD4+ T cells was used to evaluate IL-17 expression in colonic lamina propria cells following 4 hour stimulation with PMA/ionomycin with Brefeldin-A. Bar graphs represent geometric mean of at least 3 mice / group. Error bars represent SEM. p-values indicated, ANOVA. H, I. Germ-free C57BL/6 mice were colonized with 2 × 10⁹ CFU of mouse-derived AIEC isolate CUMT8, CUMT8:ΔpduC, or the complemented strain CUMT8:ΔpduC+pduC and analyzed after 10 days. Flow cytometry of live, CD4+ T cells was used to evaluate IL-17 and IFNγ expression in colonic lamina propria cells following 4 hour stimulation with PMA/ionomycin with Brefeldin-A (I). Total number of RORγt+ CD4+ T cells per colon for each experimental group was evaluated (I). Bar graphs represent geometric mean of at least 3 mice / group from 1 of 3 total experiments. Error bars represent SEM. p-values indicated, ANOVA.
Fig. 5.
Fig. 5.. CD-SpA E. coli 2A exacerbates DSS-induced colitis in IL10-deficient mice.
A. qPCR analysis of Il10 expression in lamina propria mononuclear cells from mono-colonized mice 5 days after colonization with CD-SpA E. coli 2A, T75, or no colonization control. Bar graphs represent geometric mean for 5–6 mice / group from 2 independent experiments. Error bars represent the SEM. P-values < 0.05 is indicated, T-test. B. Germ-free WT and IL-10−/− mice were colonized with 2 × 10⁹ CFU of AIEC isolate 2A. Two weeks after colonization, flow cytometry of live, CD4+ T cells was used to evaluate RORγt and Foxp3 expression as well as IL-17 and IFNγ expression in colonic lamina propria cells following 4 hour stimulation with PMA/ionomycin with Brefeldin-A. Mean percentages are shown for each experimental group and error bars reflect SEM. Data are a composite of 2 independent experiments with 4–6 animals / group. C-E. Germ-free IL-10−/− mice were colonized with 2 × 10⁹ CFU of CD-SpA-derived AIEC isolate 2A, non-AIEC T75 or media control. Ten days after colonization, mice were exposed to 2% DSS ad libitum for 7 days. C. Percent survival following DSS administration is shown. 2A N = 15, T75 N = 8, Media N = 13,. Log rank test, P<0.05. D. Colonic histopathology score on day 10 following DSS exposure. Mean and SEM are shown. p-values are indicated, ANOVA. E. Flow cytometry was used to evaluate RORγt and Foxp3 expression and IL-17 and IFNγ cytokine production in live, CD4+ T cells from the colonic lamina propria. F,G. IL10−/− mice mono-associated with AIEC isolate 2A were treated with anti-IL23 or isotype control on day 1 and 4 following DSS exposure. F. Percent survival following DSS administration is shown. Isotype N = 8, anti-IL-23 N = 8. Log rank test, P<0.05. G. Flow cytometry was used to evaluate RORγt and Foxp3 expression and IL-17 and IFNγ cytokine production in live, CD4+ T cells from the colonic lamina propria. Mean percentages are shown for each experimental group (N=5) and error bars reflect SEM. Data are from one of three independent experiments. P-values are indicated, ANOVA.
Fig. 6.
Fig. 6.. CD-SpA E. coli 2A colonization promotes arthritis in K/BxN mice and models the systemic Th17 immunophenotype seen in CD-SpA patients.
A. CD4+ T cells from ileal biopsies of CD patients with (N=8) and without SpA (N=11) were analyzed for IL-17 or IFNγ production following PMA/ionomycin stimulation for 4 hours in the presence of Brefeldin A. Bar graph represents geometric mean. Error bars represent SEM. * p<0.05 are indicated, T-test. B. Serum cytokines was quantified by bead array (Biolegend). *P<0.05 are indicated, two-tailed t-test with Bonferroni correction. CD N=10, CD-SpA N=13. C. E. coli 2A (triangle) or B. vulgatus (circle) specific IgG titers determined by bacterial surface staining with serum from CD patients with (black, N=10) or without (white, N=10) SpA. MFI Index (MFI IgG/ MFI isotype) is shown for indicated serum dilution. Error bars represent SEM. P-values are indicated, ANOVA. D. CD4+ T cells were purified from the spleen of gnotobiotic mice colonized with or without AIEC 2A or SFB and re-stimulated with the indicated fecal antigen. Antigen specific IL-17 production was measured by ELISPOT. Data are a composite of 2 independent experiments with 3–6 mice / group performed in triplicate. Bars indicate geometric mean and error bars reflect SEM. P-values <0.05 are indicated, ANOVA. E-K. Antibiotic pre-treated SFB-free K/BxN mice were gavaged with media control (N=5), AIEC 2A (N=13), T75 (N=11), or SFB (N=9) and analyzed on day 10. E. Ankle thickening was measured daily following gavage. P-value <0.05 is indicated, ANOVA. F,G. Percentage of live, CD4+ T cells that produce IL-17 (Th17 cells) in both the spleen (F) and small intestinal lamina propria (G). H,I. Percentage of IgA+ cells within the total, live CD19+ B cell gate of the spleen (H) or Peyer’s patches (I). J. Percentage of IgG1+ cells within the total, live CD19+ germinal center (GC) B cells (Fas+ PNA+) in the spleen. K. Anti-GPI titer at day 10 following gavage. Bars indicate geometric mean and error bars reflect SEM. P-values are indicated, ANOVA. Data from E-K are a composite of three independent experiments.

Comment in

Similar articles

Cited by

References

    1. DeFilippis EM, Longman R, Harbus M, Dannenberg K, Scherl EJ, Crohn’s Disease: Evolution, Epigenetics, and the Emerging Role of Microbiome-Targeted Therapies. Curr Gastroenterol Rep 18, 13 (2016). - PubMed
    1. Longman RS, E., in Medical Therapy of Ulcerative Colitis, Lichtenstein G, Ed. (Springer Science, New York, 2015).
    1. Peluso R, Di Minno MND, Iervolino S, Manguso F, Tramontano G, Ambrosino P, Esposito C, Scalera A, Castiglione F, Scarpa R, Enteropathic Spondyloarthritis: From Diagnosis to Treatment. Clin Dev Immunol, (2013). - PMC - PubMed
    1. Bargen JA, Complications and sequelae of chronic ulcerative colitis. Ann Intern Med 3, 335–352 (1929).
    1. Mielants H, Veys EM, Devos M, Stefan CC, Goemaere S, Declercq L, Schatteman L, Elewaut D, The Evolution of Spondyloarthropathies in Relation to Gut Histology .1. Clinical Aspects. Journal of Rheumatology 22, 2266–2272 (1995). - PubMed

MeSH terms