. 2017 Feb 28;8(9):15858-15877.
doi: 10.18632/oncotarget.15008.

Prime-boost immunization by both DNA vaccine and oncolytic adenovirus expressing GM-CSF and shRNA of TGF-β2 induces anti-tumor immune activation

Affiliations

Prime-boost immunization by both DNA vaccine and oncolytic adenovirus expressing GM-CSF and shRNA of TGF-β2 induces anti-tumor immune activation

So Young Kim et al. Oncotarget. .

Abstract

A successful DNA vaccine for the treatment of tumors should break established immune tolerance to tumor antigen. However, due to the relatively low immunogenicity of DNA vaccines, compared to other kinds of vaccines using live virus or protein, a recombinant viral vector was used to enhance humoral and cellular immunity. In the current study, we sought to develop a novel anti-cancer agent as a complex of DNA and oncolytic adenovirus for the treatment of malignant melanoma in the C57BL/6 mouse model. MART1, a human melanoma-specific tumor antigen, was used to induce an increased immune reaction, since a MART1-protective response is required to overcome immune tolerance to the melanoma antigen MelanA. Because GM-CSF is a potent inducer of anti-tumor immunity and TGF-β2 is involved in tumor survival and host immune suppression, mouse GM-CSF (mGM-CSF) and shRNA of mouse TGF-β2 (shmTGF-β2) genes were delivered together with MART1 via oncolytic adenovirus. MART1 plasmid was also used for antigen-priming. To compare the anti-tumor effect of oncolytic adenovirus expressing both mGM-CSF and shmTGF-β2 (AdGshT) with that of oncolytic adenovirus expressing mGM-CSF only (AdG), each virus was intratumorally injected into melanoma-bearing C57BL/6 mice. As a result, mice that received AdGshT showed delayed tumor growth than those that received AdG. Heterologous prime-boost immunization was combined with oncolytic AdGshT and MART1 expression to result in further delayed tumor growth. This regression is likely due to the following 4 combinations: MART1-derived mouse melanoma antigen-specific immune reaction, immune stimulation by mGM-CSF/shmTGF-β2, tumor growth inhibition by shmTGF-β2, and tumor cell-specific lysis via an oncolytic adenovirus. Immune activation was mainly induced by mature tumor-infiltrating dendritic cell (TIDC) and lowered regulatory T cells in tumor-infiltrating lymphocytes (TIL). Taken together, these findings demonstrate that human MART1 induces a mouse melanoma antigen-specific immune reaction. In addition, the results also indicate that combination therapy of MART1 plasmid, together with an oncolytic adenovirus expressing MART1, mGM-CSF, and shmTGF-β2, is a promising candidate for the treatment of malignant melanoma.

Keywords: DNA vaccine; GM-CSF; MART1; TGF-β2; oncolytic adenovirus.


Conflict of interest statement

CONFLICTS OF INTEREST

The authors declare no conflicts of interest.

Figures

Figure 1
Figure 1. Infectivity of adenovirus in B16BL6-CAR/E1B55 cell line
A. A375 (human melanoma cell line), B16BL6 (mouse melanoma cell line), and B16BL6-CAR/E1B55 were infected with adenovirus-GFP at an MOI of 50. After 48 h, GFP expression was detected. B. The B16BL6-CAR/E1B55 cell line was infected with adenovirus-GFP at various MOIs (Left). To compare the oncolytic activity induced by Ad3484-CMVp-ΔE1B, cancer and normal cells were infected with each virus at an MOI of 1 to 20. When 293A cells infected with one of the viruses at an MOI of 1 exhibited complete cell lysis, all the remaining cells on the plate were fixed with 4% paraformaldehyde and stained with 0.5% crystal violet (Right). C. E1B-55K protein was detected by using E1B-55K polyclonal antiserum from one of selected clone of B16BL6-CAR-E1B55K cell line.
Figure 2
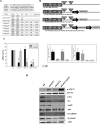
Figure 2. Screening of mouse TGF-β2 and changes in signaling molecules by adenovirus expressing shmTGF-β
A. Screening of mouse TGF-β2 shRNAs. Sequences of shRNA oligomers targeting mouse TGF-β2 are shown with the selected target sequence indicated in bold (Top). The candidate oligomers for each target and the positive control shRNA were transfected into B16F10 cells. The knockdown efficiency of each oligomer was measured using quantitative real-time PCR to amplify mouse TGF-β2. Relative expression levels of mouse TGF-β2 were plotted after normalization to the scrambled shRNA as a negative control (Bottom). B. Ad-3484-CMVp-ΔE1B is a replication-competent adenovirus used as a control (Ad). This adenovirus contains the E1A gene controlled by the CMV promoter but lacks the E1B gene. Ad-3484-CMVp-ΔE1B-ΔE3-U6-shmTGF-β1 (Ad-shT1) and Ad-3484-CMVp-ΔE1B-ΔE3-H1-shmTGF-β2 (Ad-shT2) are composed of the shmTGF-β1 or shmTGF-β2 genes in the E3 region of Ad-3484-CMVp-ΔE1B, respectively. Ad-3484-CMVp-ΔE1B-ΔE3-H1-shmTGFβ2-U6-shmTGF-β1 (Ad-sh1+shT2) is composed of the shmTGF-β1 and shmTGF-β2 genes in the E3 region of Ad-3484-CMVp-ΔE1B. C. Relative expression levels of mTGF-β1 and mTGF-β2 mRNA. Oncolytic Ad (Ad), Ad-shTGFβ1 (Ad-shT1), Ad-shTGFβ2 (Ad-shT2), or Ad-shTGFβ1+shTGFβ2 (Ad-shT1+shT2) virus were injected into B16BL6-CAR/E1B55 cells at an MOI of 100. The knockdown efficiency of these viruses was measured by quantitative real-time PCR of mTGF-β1 or mTGF-β2 (Left). Protein levels of mTGF-β1 and mTGF-β2. Oncolytic Ad (Ad), Ad-shTGFβ1 (Ad-shT1), Ad-shTGFβ2 (Ad-shT2), or Ad-shTGFβ1+shTGFβ2 (Ad-shT1+shT2) virus were injected into B16BL6-CAR/E1B55 cells at an MOI of 100. The knockdown efficiency of these viruses was measured by ELISA of TGF-β1 (Right, top) or TGF-β2 (Right, bottom). D. B16BL6-CAR/E1B55 cells were injected with oncolytic Ad (Ad), Ad-shTGFβ1 (Ad-shT1), Ad-shTGFβ2 (Ad-shT2), or Ad-shTGFβ1+shTGFβ2 (AdshT1+shT2) virus at an MOI of 100. Two days later, the endogenous expression levels of various signaling molecules were detected by western blot.
Figure 3
Figure 3. Recombinant adenoviruses expressing mGM-CSF and shmTGF-β2
A. Schematic representation of adenovirus vectors expressing mGM-CSF and shmTGF-β2. Ad-3484-CMVp-ΔE1B-CMVp-mGM-CSF (AdG) is composed of the mGM-CSF gene in the E1 region, and Ad-3484-CMVp-ΔE1B-CMVp-mGM-CSF-ΔE3-H1-shmTGF-β2 (AdGshT) is composed of the shmTGF-β2 gene in the E3 region of Ad-3484-CMVp-ΔE1B. B. Oncolytic activity of these viruses was analyzed using an in vitro CPE assay. Cancer and normal cells were infected with each virus at an MOI of 0.1 to 50. To examine the level of mGM-CSF and mTGF-β2 mRNA expression, B16BL6-CAR/E1B55 cells were infected with virus at a MOI of 50. Two days after injection, mGM-CSF expression levels were measured in the culture supernatants by ELISA C. and mTGF-β mRNA was estimated by RT-PCR D.
Figure 4
Figure 4. The anti-tumor effect of adenoviruses expressing mGM-CSF and shmTGF-β2
The anti-tumor effect of oncolytic Ad-GMCSF, Ad-shTGFβ2 or Ad-GMCSF-shTGFβ2 was confirmed by ex vivo (A) and in vivo (B) experiments. A. B16BL6-CAR/E1B55 cells infected with each virus at an MOI of 50 were incubated with splenocytes isolated from 3 mice of each group of C57BL/6 for 4 h. The splenocyte cytotoxic activity was measured by an LDH assay. E:T means the ratio of total number of effector cells (splenocytes) to target cells (infected B16BL6-CAR/E1B55 cells). B. C57BL/6 tumor-bearing mice were treated with intratumoral injections of 1 × 10⁹ PFU/50 μL of adenoviruses on days 1, 3, and 5. Tumor volume was monitored and recorded every 2 days until the end of the study. Values represent the mean ± SE (5 animals per group)(Top). Overall survival was determined throughout a 15-day time course (Bottom). C. Representative immunohistochemical analysis of recombinant adenovirus infected tumor sections. 3 mice of each group of C57BL/6 tumor-bearing mice were treated with intratumoral injections of 1 × 10⁹ PFU/50 μL of adenoviruses on days 1, 3, and 5. Tumors were collected at day 11 for histological analysis. Paraffin- sections of tumor tissue were stained with anti-adenovirus type 5, anti-CD4, anti-CD8, anti-NK1.1 antibodies, and anti-CD11b+c. The dark purple spots indicate.adenovirus type 5, CD4, CD8, NK/NKT and DC cells, respectively. NK1.1 is a key marker of NK and NKT cells. CD11b is a key marker of macrophages and CD11c is a key marker of dendritic cells (Top). Results are given as the relative intensity of adenovirus type 5, CD4, CD8, NK/NKT and DC cells to PBS of each 3 mouse. Horizontal black bars indicate mean values (Bottom).
Figure 5
Figure 5. Effects of the human MART1 plasmid on mouse melanoma antigen-specific immune priming
A. MART1 and mMelanA expression was detected in various human and mouse melanoma cells (except NIH3T3 as a negative control) by western blot. B. MART1 translational levels were assessed in B16BL6 cells after transfection with pVAX1 or pVAX-MART1. C. Splenocytes were co-cultured with B16BL6 or LLC cells for 4 h after collection from 4 mice of each group injected with control plasmid or MART1 plasmid. The cytotoxicity of splenocytes was then determined with an LDH assay.
Figure 6
Figure 6. Recombinant adenovirus vectors expressing MART1, mGM-CSF, and shmTGF-β2
A. Ad3484-CMVp-ΔE1B-CMVp-MART1 (AdM) is composed of the MART1 gene in the E1 region of Ad3484-CMVp-ΔE1B. Ad3484-CMVp-ΔE1B-MART1-IRES-mGM-CSF-ΔE3-H1-shmTGF-β2 (AdMGshT) is composed of the MART1 and mGM-CSF genes in the E1 region and shmTGF-β2 gene in the E3 region of Ad3484-CMVp-ΔE1B. B. The oncolytic activity of these viruses was analyzed by an in vitro CPE assay. Cancer and normal cells were infected with each virus at an MOI of 0.1 to 100. C. Left). B16BL6-CAR/E1B55 cells were infected with Ad, AdM, AdMGshT at an MOI of 50. Two days later, the endogenous expression level of MART1 was detected by western blot. MART1 cell-surface expression levels were also detected by flow cytometric analysis (C, Right). To examine mGM-CSF levels, B16BL6-CAR/E1B55 cells were infected with Ad, AdG, AdMGshT at a MOI of 50. Two days after injection, mGM-CSF expression levels were measured in the culture supernatants by ELISA D. To examine mTGF-β2 protein levels, B16BL6-CAR/E1B55 cells were infected with Ad, AdshT, AdMGshT at a MOI of 50. Two days after injection, mTGF-β2 protein levels were measured in the culture supernatants by ELISA E.
Figure 7
Figure 7. Anti-tumor effect of the combination treatment of MART1 plasmid with Ad, AdM, AdGshT, and AdMGshT
A. Diagram of the experimental design. C57BL/6 mice were injected with 7 × 10⁵ B16BL6-CAR/E1B55 cells in 100 μL on day -5 and injected intramuscularly with 50 μg/50 μL of MART1 plasmid into the rear quadriceps on day -2. C57BL/6 tumor-bearing mice were treated with intratumoral injections of 1 × 10⁹ PFU/50 μL of adenovirus on day 1, 3, and 5. B. Tumor volume was monitored and recorded every 2 days until the end of the study. Values represent the mean ± SE (5 animals per group) (Top, Left). Overall survival was determined throughout a 15-day time course (Top, Right). Photographs of C57BL/6 tumor-bearing mice treated with virus were obtained at day 11 after virus infection (Bottom). C. Representative immunohistochemical analysis of recombinant adenovirus-infected tumor sections was done as follows. 3 animals per group of C57BL/6 mice were injected with 7 × 10⁵ B16BL6-CAR/E1B55 cells/100 μL on day -5 and then treated with intramuscular injections of 50 μg/50 μL of MART1 plasmid into the rear quadriceps on day -2. C57BL/6 tumor-bearing mice were treated with intratumoral injections of 1 × 10⁹ PFU/50 μL of various kinds of adenovirus on day 1, 3, and 5. Tumors were collected at day 11 for histological analysis. Paraffin sections of tumor tissue were stained with anti-adenovirus type 5, anti-CD8, anti-CD4, anti-NK1.1, anti-CD11b+c (Top) Results are given as the relative intensity of adenovirus type 5, CD4, CD8, NK/NKT and DC cells to PBS of each 3 mouse. Horizontal black bars indicate mean values (Bottom). D. Flow cytometric analysis of various types of tumorigenic or splenic immune cells after combination treatment of MART1 plasmid with Ad or AdMGshT. 3 animals per group of mice bearing B16BL6-CAR/E1B55 cells were sacrificed and tumorigenic or splenic immune cells were isolated after combination treatment of MART1 plasmid with Ad or AdMGshT as indicated in detail in (A). To set the gate, T-cell gating of positive CD3 using Jurkat cell was performed. Each cell was then costained with anti-CD3 and anti-CD8 (or anti-CD4) for the detection of T cells. Otherwise, each cell was then costained with anti-NK1.1 and anti-CD122 after gating with anti-CD3 and anti-NK1.1 for the detection of NKT cells or for the detection of regulatory T cells, each cell was then costained with anti-CD25 and anti-FOXP3 after gating with anti-CD4 and anti-CD25. Numbers in inset are percentage of cells in a given quadrant. All flow cytometric results are representative of three experiments (Left, Middle). Right results are the average percentage of corresponding immune cells in each 3 mouse. Horizontal black bars indicate mean values. E. Immunohistochemical analysis was performed as indicated in (C) by staining with anti-IFN-γ antibody (Left). Results are given as the relative intensity of IFN-γ to PBS of each 3 mouse. Horizontal black bars indicate mean values (Right). F. IHC using Ad5 antibody was performed to examine the residual adenovirus at the indicated day after infection of oncolytic control adenovirus was administered intratumorally (1 × 10⁹ PFU per tumor in 50 μl of PBS) on days 1, 3, and 5. Representative confocal immunofluorescence staining of tumor sections was done as described in Materials and methods to confirm the increased mature TIDCs (G., green color) or decreased regulatory T cells (H., orange color) after combination treatment of MART1 plasmid with AdMGshT (Left). TIDC or regulatory T cells were counted on images taken from multiple fields per mouse (n = 3/group). Results are given as the average percentage of CD11bloCD11chi+ cells or CD4+CD25+ cells in each 3 mouse. Horizontal black bars indicate mean values (Right).
Figure 8
Figure 8. Schematic heterologous prime-boost immunization regimen with various types of anti-tumor immunity
Human MART1 antigen presentation to mouse muscle cells injected with MART1 plasmid induces an antigen-specific immune response and MART1 antigen-specific memory T cells arise (priming). After MART1 plasmid injection, oncolytic adenovirus expressing MART1, mGM-CSF, and shmTGF-β2 were intratumorally injected (boosting). While the increased MART1 protein expression on tumor cells by adenovirus induces faster and stronger MART1-specific CD8+ and CD4+ T cell immune response, the adenovirus-mediated expression of mGM-CSF and suppression of TGF-β2 expression induce antigen-nonspecific activation of various immune cells. In this process, IFN-γ produced by active immune cells such as CD8+ T cells with the help of both of mature DCs and relieved regulatory T cells can trigger an anti-tumorigenic cytotoxicity. Furthermore, the oncolytic property of adenovirus induces viral replication in tumor cells and effective tumor cell lysis. Consequently, the virus can be released and re-infected surrounding tumor cells, and immune activation and tumor cell lysis are then repetitively induced by the virus.

Similar articles

Cited by

References

    1. Rigel DS, Carucci JA. Malignant melanoma: prevention, early detection, and treatment in the 21st century. CA Cancer J Clin. 2000;50:215–236. quiz 237-240. - PubMed
    1. Siegel R, Ma J, Zou Z, Jemal A. Cancer statistics, 2014. CA Cancer J Clin. 2014;64:9–29. - PubMed
    1. Jordan EJ, Kelly CM. Vemurafenib for the treatment of melanoma. Expert opinion on pharmacotherapy. 2012;13:2533–2543. - PubMed
    1. Trinh VA, Hwu WJ. Ipilimumab in the treatment of melanoma. Expert opinion on biological therapy. 2012;12:773–782. - PubMed
    1. Starz H. Ipilimumab for advanced metastatic melanoma. Expert opinion on biological therapy. 2012;12:981–982. - PubMed

Substances