. 2017 Apr 28;91(10):e01919-16.
doi: 10.1128/JVI.01919-16. Print 2017 May 15.

Hepatitis B Virus-Encoded MicroRNA Controls Viral Replication

Affiliations

Hepatitis B Virus-Encoded MicroRNA Controls Viral Replication

Xi Yang et al. J Virol. .

Abstract

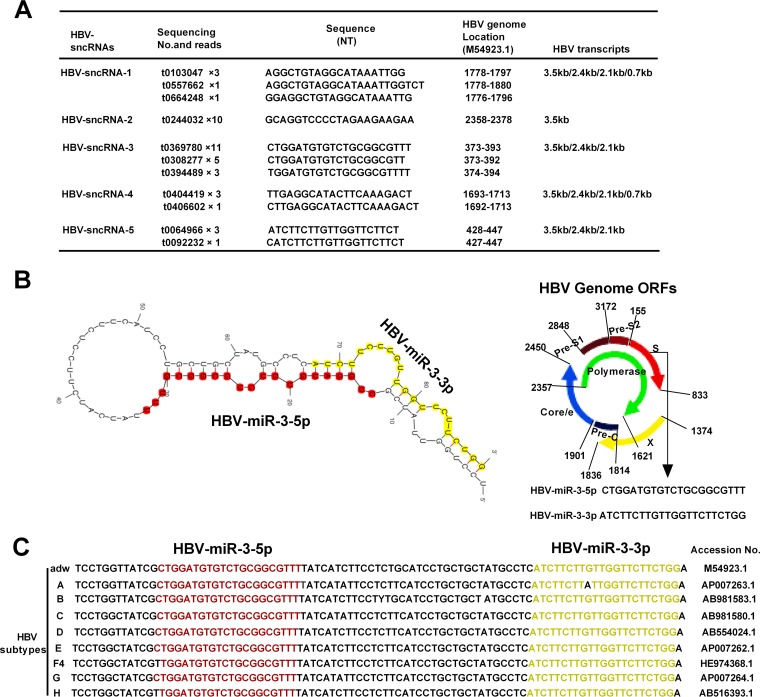
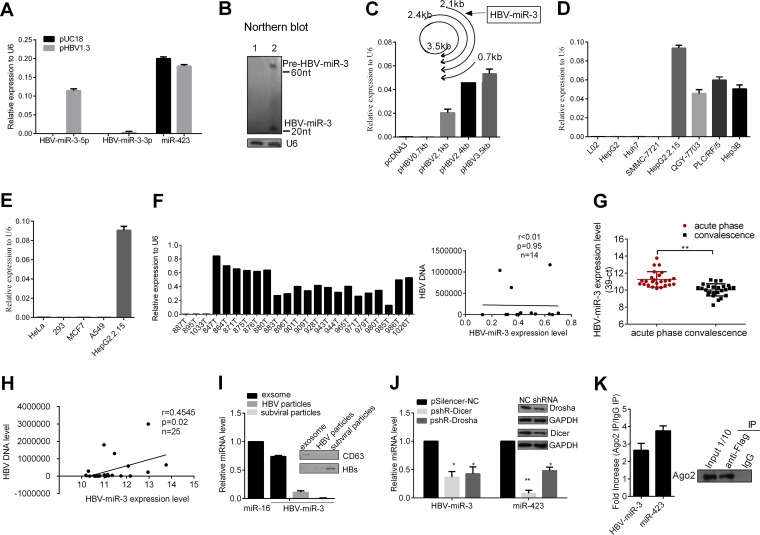
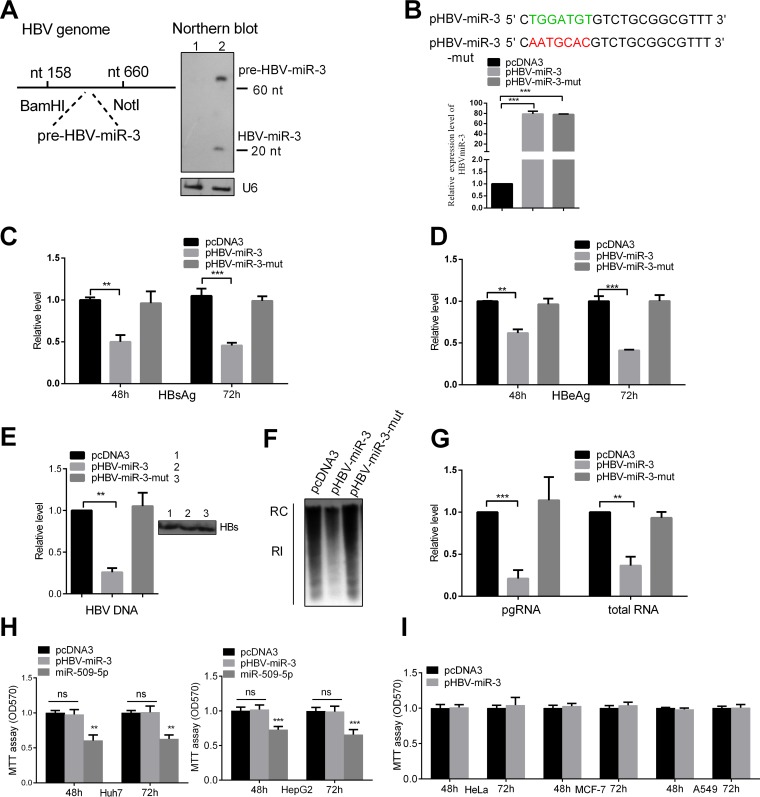
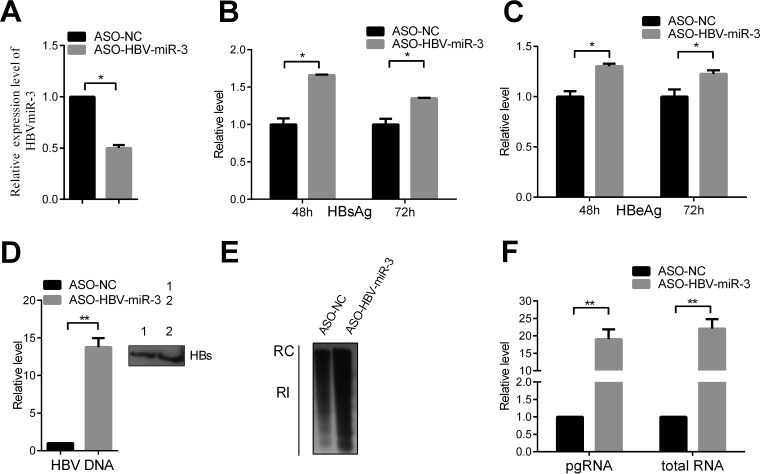
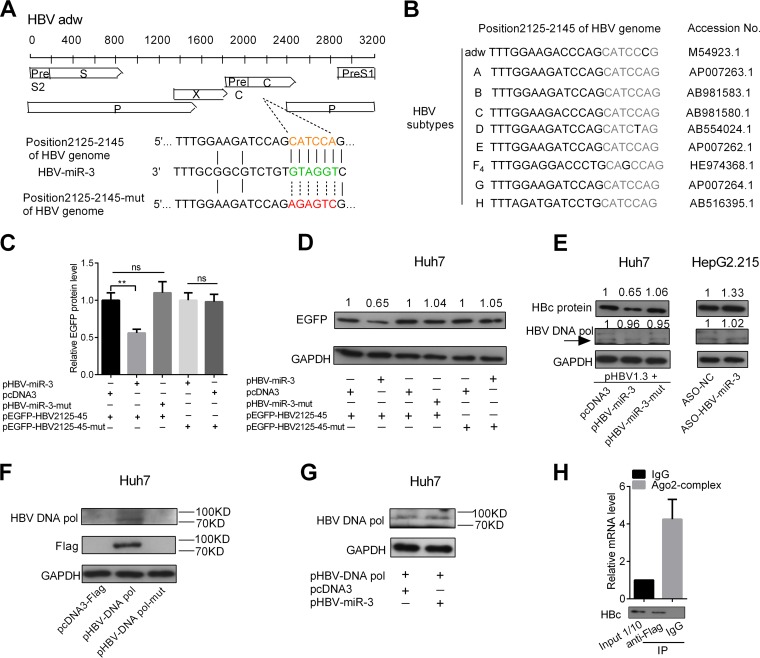
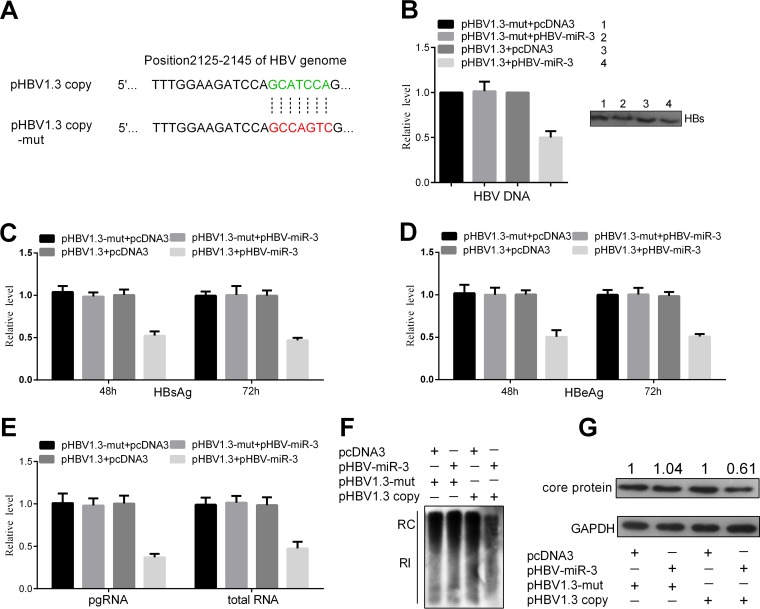
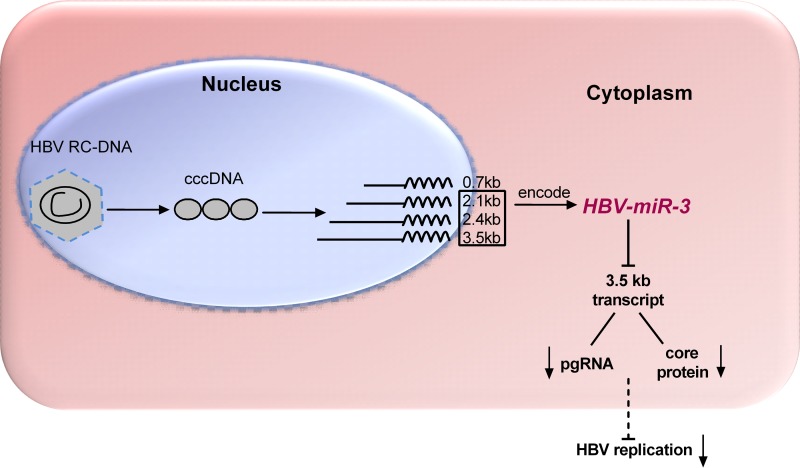
MicroRNAs (miRNAs) are a class of small, single-stranded, noncoding, functional RNAs. Hepatitis B virus (HBV) is an enveloped DNA virus with virions and subviral forms of particles that lack a core. It was not known whether HBV encodes miRNAs. Here, we identified an HBV-encoded miRNA (called HBV-miR-3) by deep sequencing and Northern blotting. HBV-miR-3 is located at nucleotides (nt) 373 to 393 of the HBV genome and was generated from 3.5-kb, 2.4-kb, and 2.1-kb HBV in a classic miRNA biogenesis (Drosha-Dicer-dependent) manner. HBV-miR-3 was highly expressed in hepatoma cell lines with an integrated HBV genome and HBV+ hepatoma tumors. In patients with HBV infection, HBV-miR-3 was released into the circulation by exosomes and HBV virions, and HBV-miR-3 expression had a positive correlation with HBV titers in the sera of patients in the acute phase of HBV infection. More interestingly, we found that HBV-miR-3 represses HBsAg, HBeAg, and replication of HBV. HBV-miR-3 targets the unique site of the HBV 3.5-kb transcript to specifically reduce HBc protein expression, levels of pregenomic RNA (pgRNA), and HBV replication intermediate (HBV-RI) generation but does not affect the HBV DNA polymerase level, thus suppressing HBV virion production (replication). This may explain the low levels of HBV virion generation with abundant subviral particles lacking core during HBV replication, which may contribute to the development of persistent infection in patients. Taken together, our findings shed light on novel mechanisms by which HBV-encoded miRNA controls the process of self-replication by regulating HBV transcript during infection.IMPORTANCE Hepatitis B is a liver infection caused by the hepatitis B virus (HBV) that can become a long-term, chronic infection and lead to cirrhosis or liver cancer. HBV is a small DNA virus that belongs to the hepadnavirus family, with virions and subviral forms of particles that lack a core. MicroRNA (miRNA), a small (∼22-nt) noncoding RNA, was recently found to be an important regulator of gene expression. We found that HBV encodes miRNA (HBV-miR-3). More importantly, we revealed that HBV-miR-3 targets its transcripts to attenuate HBV replication. This may contribute to explaining how HBV infection leads to mild damage in liver cells and the subsequent establishment/maintenance of persistent infection. Our findings highlight a mechanism by which HBV-encoded miRNA controls the process of self-replication by regulating the virus itself during infection and might provide new biomarkers for diagnosis and treatment of hepatitis B.

Keywords: HBc; hepatitis B virus; miRNA; pgRNA.


Figures

FIG 1
FIG 1
Identification of HBV small noncoding RNAs by deep sequencing. (A) The primary sequence and reads of five HBV-sncRNAs matched the HBV genome at the expected location. (B) Secondary-structure prediction of HBV-miR-3 and schematic diagram of the HBV-miR-3 location on the HBV genome. (C) Conserved analysis of HBV-miR-3 among different HBV subtypes.
FIG 2
FIG 2
Experimental validation of HBV-miR-3. (A and B) Huh7 cells were transfected with pHBV1.3 or an empty vector, pUC18, as a negative control. (A) Mature HBV-miR-3, HBV-miR-3-3p, and miR-423 were detected with stem-loop-RT-qPCR. (B) HBV-miR-3 was examined by Northern blotting. The probe was the biotin-conjugated antisense strand of HBV-miR-3. Lane 1, 45 μg of small RNA from Huh7 cells transfected with pUC18; lane 2, 45 μg of small RNA from Huh7 cells transfected with pHBV1.3. U6 was used as a control. (C) Stem-loop RT-qPCR was conducted on total RNAs isolated from Huh7 cells transfected with HBV transcripts: pHBV3.5 kb, pHBV2.4 kb, pHBV2.1 kb, or pHBV0.7 kb with primers for HBV-miR-3; the empty vector pcDNA3 was used as a control. (D) Cellular RNA was extracted and analyzed for HBV-miR-3 expression among hepatoma cell lines with a detectable integrated HBV genome (HepG2.2.15, 7703, PLC/RF/5, and Hep3B cells), HBV-negative hepatoma cells (7721, HepG2, and Huh7 cells), and L02 cells. miR-423 was set as a negative control, while U6 RNA expression was set as 1 unit as the internal control. (E) Cellular RNA was extracted, and HBV-miR-3 expression was detected among non-hepatoma cell lines. (F) (Left) RNA was extracted and analyzed for the expression of HBV-miR-3 in 20 specimens with HBV+ hepatoma tumors and 3 specimens with HBV hepatoma tumors, (Right) Pearson's correlation analysis indicated a positive correlation between the expression of HBV-miR-3 and HBV DNA in HBV+ hepatoma tumors. (G) The HBV-miR-3 level was measured by RT-qPCR in the sera of 25 pairs of patients with acute-phase HBV infection that progressed to convalescence. The miRNA expression levels are presented as 39-Ct after normalization to miR-16. (H) Pearson's correlation analysis indicated positive correlation between the expression of HBV-miR-3 and HBV DNA in sera of patients with HBV infection in the acute phase. (I) RT-qPCR was performed to detect the expression of HBV-miR-3 in purified HBV particles and exosomes from the culture supernatants of HepG2.2.15 cells that were ultracentrifuged and immunoprecipitated to purify them. (J) Dicer and Drosha were knocked down with shRNAs in HepG2.2.15 cells, and HBV-miR-3 expression was detected by RT-qPCR. NC, normal control. (K) Western blot showing pulldown of AGO2 protein in Huh7 cells (right) and levels of HBV-miR-3 and miR-423 that immunoprecipitated with the AGO2 complex by RT-qPCR (left). The graphs represent averages of results from three experiments. The data represent means and SD. *, P < 0.05; **, P < 0.01.
FIG 3
FIG 3
HBV-miR-3 represses viral protein production and HBV replication. (A) (Left) Schematic diagram of a DNA fragment, including the predicted HBV-miR-3 precursor, and cloning of the fragment into pcDNA3. (Right) Huh7 cells were transfected with HBV-miR-3 or an empty vector, pcDNA3, as a negative control, and 10 μg RNA was used to detect the mature HBV-miR-3 by Northern blotting, with U6 as a control. (B) Mutant sequence of HBV-miR-3-mut compared to that of HBV-miR-3. HBV-miR-3 or HBV-miR-3-mut was transfected into Huh7 cells, with pcDNA3 as the negative control. The expression of the plasmids was tested using RT-qPCR. (C to E) Huh7 cells were cotransfected with pHBV1.3 and the indicated plasmids. HBsAg (C), HBeAg (D), and HBV DNA (E) levels in the culture supernatant were measured by ELISA and qPCR. Immunoprecipitation using HBsAb antibody was performed before extracting HBV DNA. (F) Southern blot analysis of HBV DNA. RC, relaxed circular DNA; RI, RI-DNA. (G) Total cellular RNA was extracted and analyzed as HBV transcripts by RT-qPCR. The effects of HBV-miR-3 on viabilities in different cell lines are shown. (H and I) Effects of HBV-miR-3, HBV-miR-3-mut, and miR-509-5p on Huh7 and HepG2 cells using an MTT assay, with miR-509-5p as a positive control (H), and in non-liver cell lines (HeLa, MCF7, and A549) using an MTT assay (I). The graphs represent the averages of results from three experiments. The data represent means and SD. **, P < 0.01; ***, P < 0.001; ns, not significant.
FIG 4
FIG 4
ASO-HBV-miR-3 increases viral protein production and HBV replication. (A) ASO-HBV-miR-3 was transfected into HepG2.2.15 cells. ASO-NC was used as a control. HBV-miR-3 expression was examined by RT-qPCR. (B to D) HBsAg (B), HBeAg (C), and HBV DNA (D) levels in the culture supernatant were measured by ELISA and qPCR in HepG2.2.15 cells transfected with ASO-HBV-miR-3. Immunoprecipitation using HBsAb antibody was performed before extracting HBV DNA. (E) Southern blot analysis of HBV DNA. (F) Total cellular RNA was extracted and analyzed for HBV transcripts by RT-qPCR. The graphs represent the average results of three experiments. The data represent means and SD. *, P < 0.05; **, P < 0.01.
FIG 5
FIG 5
HBV-miR-3 target region encoding the HBc protein of the HBV 3.5-kb mRNA. (A) Predicted binding site of HBV-miR-3 in a region encoding the HBc protein of the HBV 3.5-kb mRNA. The arrows indicate the mutant nucleotides. (B) Analysis of conserved HBV-miR-3-targeted site (nt 2125 to 2145) in subtype HBV genomes. (C and D) Huh7 cells were cotransfected with either wild-type or mutant HBV-EGFP nt 2125-to-2145 constructs and pHBV-miR-3 or pHBV-miR-3-mut for 48 h. pcDNA3 was used as a negative control. Cells were harvested to analyze endogenous protein expression by EGFP fluorescence or Western blot analysis. pDsRed2-N1 was used as normalization for fluorescence. GAPDH was used as an endogenous control for EGFP protein expression. (E) Huh7 cells were cotransfected with pHBV1.3 and pHBV-miR-3 or pHBV-miR-3-mut for 48 h. pcDNA3 was a negative control. HepG2.2.15 cells were transfected with ASO-HBV-miR-3, and ASO-NC (NC, normal control) was a negative control. HBV core protein and DNA Pol were detected by Western blotting. The arrow indicates the position of the protein expression. (F) Huh7 cells were transfected with pcDNA3, pHBV DNA Pol, and a pHBV DNA Pol mutant; 24 h posttransfection, cells were harvested for Western blotting to detect HBV DNA Pol using Flag and HBV DNA Pol antibodies. (G) Huh7 cells were transfected with pHBV DNA Pol and pcDNA3 or pHBV-miR-3; 24 h posttransfection, cells were harvested for Western blotting to detect HBV DNA Pol using HBV DNA Pol antibody. (H) HBV pgRNA (3.5-kb RNA) and HBc protein were detected in AGO2-related complexes by RT-qPCR and Western blotting. The graphs represent average results of three experiments. The data represent means and SD. **, P < 0.01.
FIG 6
FIG 6
The effects of HBV-miR-3 on HBV replication and viral protein production were blocked by pHBV1.3-mut. (A) Mutant sequence of pHBV1.3-mut in positions 2125 to 2145 of the HBV genome compared to that in pHBV1.3. Huh7 cells were cotransfected with pHBV1.3-mut or pHBV1.3 and the indicated plasmids, (B to D) HBsAg (B), HBeAg (C), and HBV DNA (D) levels in culture supernatants were measured by ELISA and qPCR. (E) Total cellular RNA was extracted and analyzed as HBV transcripts by RT-qPCR. (F) Southern blot analysis of HBV DNA. (G) HBV core protein was detected by Western blotting. The graphs represent averages of results from three experiments. The data represent means and SD.
FIG 7
FIG 7
Proposed model describing HBV-encoded miRNA (HBV-miR-3) targeting HBV 3.5-kb mRNA to reduce HBc protein and pgRNA levels and to suppress HBV transcription and HBV replication.

Similar articles

Cited by

References

    1. Krol J, Loedige I, Filipowicz W. 2010. The widespread regulation of microRNA biogenesis, function and decay. Nat Rev Genet 11:597–610. doi:10.1038/nrg2843. - DOI - PubMed
    1. Lee RC, Feinbaum RL, Ambros V. 1993. The C. elegans heterochronic gene lin-4 encodes small RNAs with antisense complementarity to lin-14. Cell 75:843–854. doi:10.1016/0092-8674(93)90529-Y. - DOI - PubMed
    1. Axtell MJ, Westholm JO, Lai EC. 2011. Vive la difference: biogenesis and evolution of microRNAs in plants and animals. Genome Biol 12:221. doi:10.1186/gb-2011-12-4-221. - DOI - PMC - PubMed
    1. Fang L, Deng Z, Shatseva T, Yang J, Peng C, Du WW, Yee AJ, Ang LC, He C, Shan SW, Yang BB. 2011. MicroRNA miR-93 promotes tumor growth and angiogenesis by targeting integrin-beta8. Oncogene 30:806–821. doi:10.1038/onc.2010.465. - DOI - PubMed
    1. Su Y, Li X, Ji W, Sun B, Xu C, Li Z, Qian G, Su C. 2014. Small molecule with big role: microRNAs in cancer metastatic microenvironments. Cancer Lett 344:147–156. doi:10.1016/j.canlet.2013.10.024. - DOI - PubMed

Publication types

MeSH terms