. 2017 Feb 9;542(7640):242-245.
doi: 10.1038/nature21080. Epub 2017 Feb 1.

Feedback control of AHR signalling regulates intestinal immunity

Affiliations

Feedback control of AHR signalling regulates intestinal immunity

Chris Schiering et al. Nature. .

Abstract

The aryl hydrocarbon receptor (AHR) recognizes xenobiotics as well as natural compounds such as tryptophan metabolites, dietary components and microbiota-derived factors, and it is important for maintenance of homeostasis at mucosal surfaces. AHR activation induces cytochrome P4501 (CYP1) enzymes, which oxygenate AHR ligands, leading to their metabolic clearance and detoxification. Thus, CYP1 enzymes have an important feedback role that curtails the duration of AHR signalling, but it remains unclear whether they also regulate AHR ligand availability in vivo. Here we show that dysregulated expression of Cyp1a1 in mice depletes the reservoir of natural AHR ligands, generating a quasi AHR-deficient state. Constitutive expression of Cyp1a1 throughout the body or restricted specifically to intestinal epithelial cells resulted in loss of AHR-dependent type 3 innate lymphoid cells and T helper 17 cells and increased susceptibility to enteric infection. The deleterious effects of excessive AHR ligand degradation on intestinal immune functions could be counter-balanced by increasing the intake of AHR ligands in the diet. Thus, our data indicate that intestinal epithelial cells serve as gatekeepers for the supply of AHR ligands to the host and emphasize the importance of feedback control in modulating AHR pathway activation.


Conflict of interest statement

Author information: The authors declare no competing financial interests.

Figures
Extended Data Figure 1
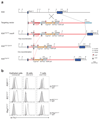
Extended Data Figure 1. Generation of R26Cyp1a1 allele.
a, The endogenous Rosa26 locus, the gene targeting vector, the targeted Rosa26 allele including the Neo resistance gene cassette (R26Cyp1a1-neoR), the targeted allele (R26LSL-Cyp1a1) after FLPe-mediated recombination and the ubiquitously expressed R26Cyp1a1 are schematically depicted to scale. A minigene composed of the coding sequences of mouse Cyp1a1 and rat Thy1 connected by a 2A sequence followed by the woodchuck hepatitis virus derived regulatory element (WPRE) and a bovine growth hormone polyadenylation site (bGH pA). b, Expression of rat THY1 in indicated cell types in the colon of R26Cyp1a1 , IECCyp1a1 (Villin-Cre), Rag1Cyp1a1 (Rag1-Cre) strains.
Extended Data Figure 2
Extended Data Figure 2. Altered AHR ligand availability affects IL-22 production.
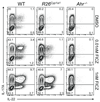
Flow cytometry analysis of IL-17A and IL-22 expression in in vitro differentiated Th17 cells from indicated genotypes (day 4) exposed to DMSO, 0.01nM FICZ or 1nM FICZ from the start of culture.
Extended Data Figure 3
Extended Data Figure 3. Altered AHR ligand affects intestinal AHR-dependent ILC populations.
a, CYP1A1 enzyme activity, measured by EROD assay, in intestinal tissue homogenates of steady state mice. b, Flow cytometry analysis of NKp46 and RORγt expression in CD45+ lineage negative (TCRβ-CD3-TCRγδ-CD19-CD11b-Gr1-) Thy1+ live cells in the small intestine (upper panel) and phenotypic analysis of RORγt+NKp46- innate lymphoid cells (lower panel). Results are representative of three independent experiments (n=3). Error bars, mean ± s.e.m. ***P < 0.001, as calculated by one-way ANOVA with Tukey post-test.
Extended Data Figure 4
Extended Data Figure 4. Effects of Cyp1a1 overexpression on liver development.
a, Liver weight represented as percentage of body weight. b, Liver (left lobe) weight represented as percentage of body weight. Results are representative of two independent experiments. Bars are the mean and each symbol represents an individual mouse. *P < 0.05, **P < 0.01, ***P < 0.001, as calculated by one-way ANOVA with Tukey post-test.
Extended Data Figure 5
Extended Data Figure 5. IL-22-Fc improves resistance to C. rodentium infection in R26Cyp1a1 mice.
Mice of indicated genotypes were infected orally with ~2x10⁹ C. rodentium and killed 7 days after infection or monitored for survival. a, C. rodentium burdens in the colon and caecum. Bars are the median and each symbol represents an individual mouse. b, Colon sections stained for E-Cadherin (green), C. rodentium (red) and DAPI (blue). Scale bars represent 100μm. c, Survival plot (WT: n=4, R26Cyp1a1 +Ctrl Ig: n=6, R26Cyp1a1 +IL-22Fc: n=5). Results are representative of three independent experiments. NS = not significant, **P < 0.01, ***P < 0.001, as calculated by one-way ANOVA with Tukey post-test.
Extended Data Figure 6
Extended Data Figure 6. Cyp1-deficiency enhances AHR pathway activation.
a, CD4+ T cells from indicated genotypes were cultured under Th17-cell-inducing conditions and exposed to FICZ from the start of culture. Intracellular levels of FICZ were determined by HPLC and normalized to total protein content at the indicated time points (n=3 per time point), mean ± s.e.m.. b, Frequencies of IL-22-producing cells after 4 days of culture under Th17-cell-inducing conditions in presence of indicated concentrations of FICZ. Results are representative of three independent experiments, mean ± s.e.m.. **P < 0.01, ***P < 0.001 as calculated by two-way ANOVA with Dunnett’s post-test a, or one-way ANOVA with Tukey post-test b. ns = not significant. c, Flow cytometry analysis of Cyp1a1 (eYFP) expression by Th17 cells differentiated from indicated genotypes. Plots are gated on IL-17A+ cells and numbers indicate frequencies. d, Representative flow cytometry plots of IL-17A and IL-22 expression in in vitro differentiated Th17 cells from indicated genotypes (day 4) exposed to DMSO, 0.01nM FICZ or 1nM FICZ from the start of culture. e, Mice of indicated genotypes were infected orally with ~2x10⁹ C. rodentium and bacterial burdens measured in the faeces at various time points. f, Pathology scores of distal colon. Bars are the mean and each symbol represents an individual mouse. Results are representative of at least two independent experiments. NS = not significant, **P < 0.01, ***P < 0.001, as calculated by Student’s t-test.
Extended Data Figure 7
Extended Data Figure 7. Effects of Rag1-Cre mediated Cyp1a1 expression on immunity to C. rodentium.
Mice of indicated genotypes were infected orally with ~2x10⁹ C. rodentium and killed 14 days after infection or monitored for survival. a, Survival plot. b, C. rodentium burdens in the colon, cecum, liver and spleen. Bars are the median and each symbol represents an individual mouse. c, Pathology scores of distal colon and cecum. Bars are the mean and each symbol represents an individual mouse. d, Absolute numbers of cytokine-producing TCRβ+CD4+ T cells in the colon of C. rodentium infected mice. Results are representative of two independent experiments (n=5 per group). NS = not significant, **P < 0.01, as calculated by Student’s t-test.
Extended Data Figure 8
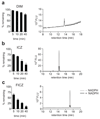
Extended Data Figure 8. CYP1A1-mediated metabolism of DIM, ICZ and FICZ.
a-c, CYP1A1-mediated metabolism of a, DIM b, ICZ and c, FICZ was studied over time in the presence of human recombinant CYP1A1 (3.5nM) and the co-factor NADPH (1.0mM). At indicated timepoints, samples from respective incubations were extracted and analysed by means of HPLC. All chemicals were quantified according to separate standard curves. Left panels show relative amount of compound remaining at each given timepoint compared to parallel incubations without co-factor present. Right panels show HPLC chromatograms at 40 minutes enzyme-incubation, with and without co-factor present. All three compounds were detected based on their fluorescence properties (fluorescence units, FLU). Results are representative of two independent experiments with two biological replicates at each experiment.
Figure 1
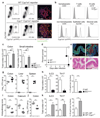
Figure 1. CYP1A1 controls AHR ligand availability.
a, CYP1A1 enzyme activity in Th17 cells (n=3 per group). b, Intracellular levels of FICZ in Th17 cell cultures (n=2 per time point). c, IL-22 protein in supernatants of in vitro differentiated Th17 cells (n=4 per group). d,e, Absolute numbers of ILC subsets in the small intestine or colon (n=3 per group). Results are representative of three independent experiments. Error bars represent mean ± s.e.m. *P < 0.05, **P < 0.01, ***P < 0.001, as calculated by one-way ANOVA with Tukey post-test a, c, d and e or two-way ANOVA with Dunnett’s post-test in b. ns = not significant.
Figure 2
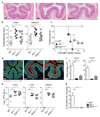
Figure 2. Depletion of natural AHR ligands leads to impaired immunity to C. rodentium.
a, Representative photomicrographs of H&E stained colon sections of C. rodentium infected mice (day7). Scale bars represent 200μm. b, Pathology scores. Bars show the mean and each symbol represents an individual mouse. c, Survival plot (WT: n=8, R26Cyp1a1: n=8, Ahr-/-: n=6). d, Colon sections stained for E-Cadherin (green), C. rodentium (red) and DAPI (blue). Scale bars represent 100μm. e, C. rodentium burdens in colon, liver and spleen. Bars show the median and each symbol represents an individual mouse. f, Absolute numbers of colonic RORγt+ ILC3 (WT: n=7, R26Cyp1a1: n=7, Ahr-/-: n=3) and IL-17A-producing TCRβ+CD4+ T cells (WT: n=5, R26Cyp1a1: n=6, Ahr-/-: n=4), mean ± s.e.m. g, IL-22 protein colon explant cultures (WT: n=10, R26Cyp1a1: n=6, Ahr-/-: n=5), mean ± s.e.m. Data represent pooled results of at least two independent experiments. *P < 0.05, **P < 0.01, ***P < 0.001, as calculated by one-way ANOVA with Tukey post-test.
Figure 3
Figure 3. IECs serve as gatekeeper for the supply of AHR ligands to the host.
a, Cyp1a1 expression gated on live colonic cells of mice fed control or I3C containing diet for two weeks (left panel) and colon sections stained for E-Cadherin (red), Cyp1a1 (green) and DAPI (blue). Scale bars represent 100μm (right panel). b, Cyp1a1 expression in the colon of WT Cyp1a1 reporter (WT) and Cyp1-/- Cyp1a1 reporter mice treated with control or I3C diet. c, Absolute numbers of RORγt+ ILC3 in mice of indicated genotypes, mean ± s.e.m. (n=3 per group). d, Survival plot of C. rodentium infected mice (n=4 per group). e, Colon sections stained for E-Cadherin (green), C. rodentium (red) and DAPI (blue) of infected mice (day 7). Scale bars represent 100μm. f, Representative photomicrographs of (H&E) stained colon sections of C. rodentium infected mice (day 7). Scale bars represent 100μm. g, C. rodentium burdens. Bars show the median, symbols represent individual mice. h, Absolute numbers of colonic RORγt+ ILC3 and Th17 cells (WT: n=6, IECCyp1a1: n=3) and IL-22 protein in colon explant cultures (n=6 per group), mean ± s.e.m.. i, Pathology scores (day 6) of distal colon and caecum in bone marrow chimeras of wildtype (WT→WT) or Cyp1 deficient (WT→Cyp1-/-) recipients. Bars show the mean, symbols represent individual mice. j, C. rodentium burdens in the colon. Bars are the median and symbols represent individual mice. k, Absolute numbers of WT donor-derived colonic RORγt+ ILC3 and Th17 cells (n=7 per group) and IL-22 protein in distal colon organ explant cultures (WT: n=7, Cyp1-/-: n=6), mean ± s.e.m.. Results are representative of three independent experiments. *P < 0.05, **P < 0.01, ***P < 0.001 as calculated by Student’s t-test or one-way ANOVA with Tukey post-test. ns = not significant.
Figure 4
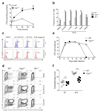
Figure 4. Dietary AHR ligands restore immunity to C. rodentium.
a, Survival plot C. rodentium infected R26Cyp1a1 mice fed control or I3C diet (n=6 per group). b, C. rodentium burdens in faeces (Ctrl: n=5, I3C: n=6). c, Colon sections of C. rodentium infected mice stained for E-Cadherin (green), C. rodentium (red) and DAPI (blue). Scale bars represent 100μm. d, Representative photomicrographs of H&E stained colon sections. Scale bars represent 100μm. e, Pathology scores. Bars show the mean and symbols represent individual mice. f, Absolute numbers of cytokine-producing TCRβ+CD4+ T cells in the colon of C. rodentium infected mice (n=4 per group), mean ± s.e.m.. g, IL-17A and IL-22 expression in TCRβ+CD4+ T cells from the colon of C. rodentium infected mice. h, Survival plot of R26Cyp1a1 mice fed I3C diet treated with anti-IL-22 blocking antibody (n=6) or isotype control (n=5). i, Concentration-dependent inhibition of human recombinant CYP1A1 enzyme activity by I3C, DIM and FICZ. Results are representative of three independent experiments. Error bars, mean ± s.e.m. *P < 0.05, **P < 0.01, ***P < 0.001, as calculated by Student’s t-test.

Comment in

Similar articles

Cited by

References

    1. Denison MS, Nagy SR. Activation of the aryl hydrocarbon receptor by structurally diverse exogenous and endogenous chemicals. Annual review of pharmacology and toxicology. 2003;43:309–334. - PubMed
    1. Zelante T, et al. Tryptophan catabolites from microbiota engage aryl hydrocarbon receptor and balance mucosal reactivity via interleukin-22. Immunity. 2013;39:372–385. - PubMed
    1. McMillan BJ, Bradfield CA. The aryl hydrocarbon receptor sans xenobiotics: endogenous function in genetic model systems. Mol Pharmacol. 2007;72:487–498. - PubMed
    1. Moura-Alves P, et al. AhR sensing of bacterial pigments regulates antibacterial defence. Nature. 2014;512:387–392. - PubMed
    1. Schmidt JV, Bradfield CA. Ah receptor signaling pathways. Annual review of cell and developmental biology. 1996;12:55–89. - PubMed

Publication types

MeSH terms