. 2017 Mar 6;214(3):651-667.
doi: 10.1084/jem.20160758. Epub 2017 Jan 27.

Tissue reservoirs of antiviral T cell immunity in persistent human CMV infection

Affiliations

Tissue reservoirs of antiviral T cell immunity in persistent human CMV infection

Claire L Gordon et al. J Exp Med. .

Abstract

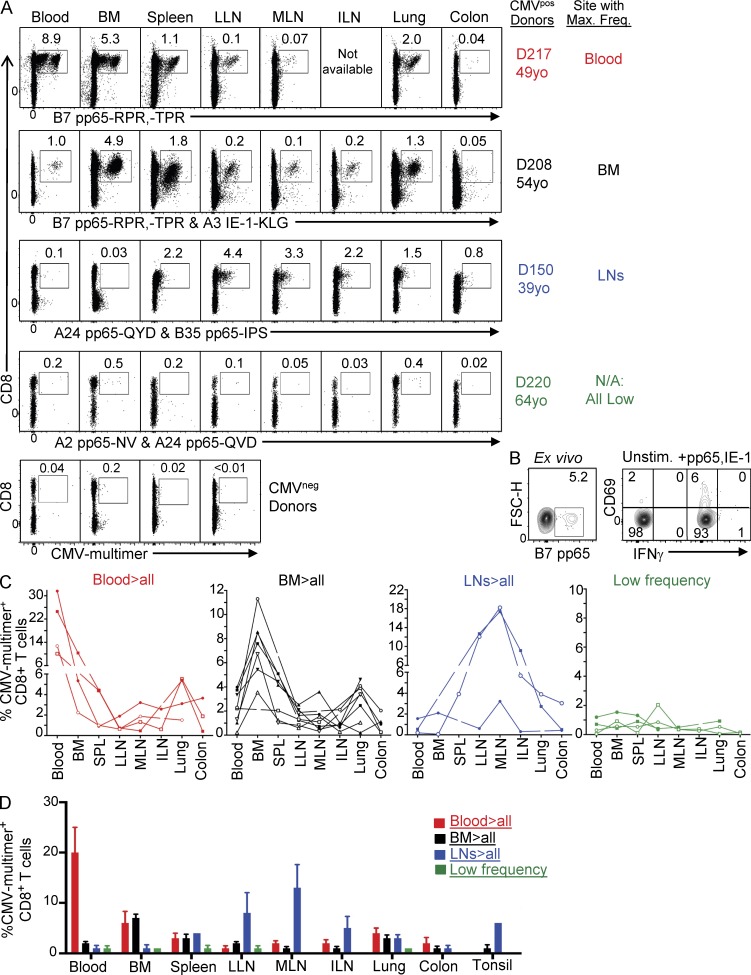
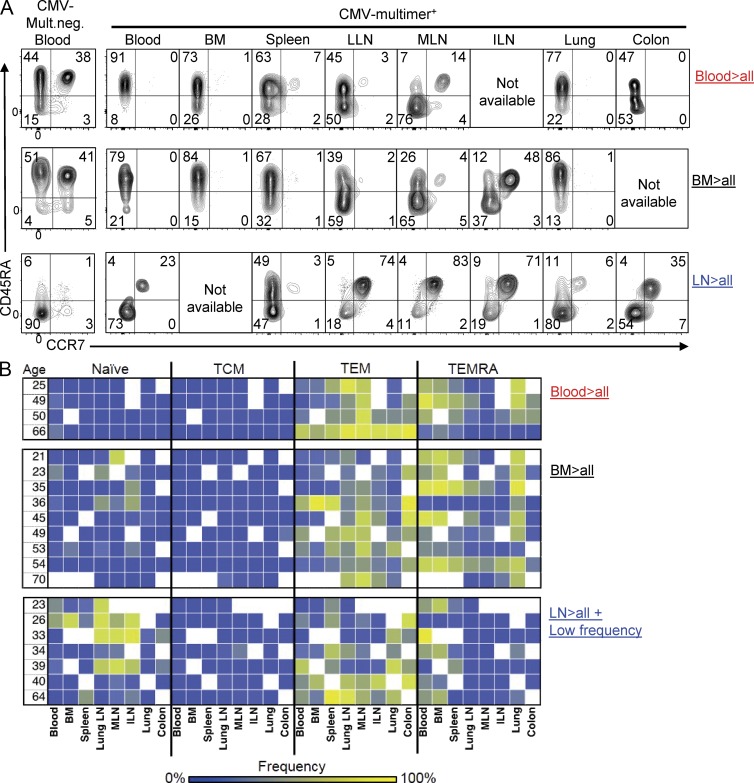
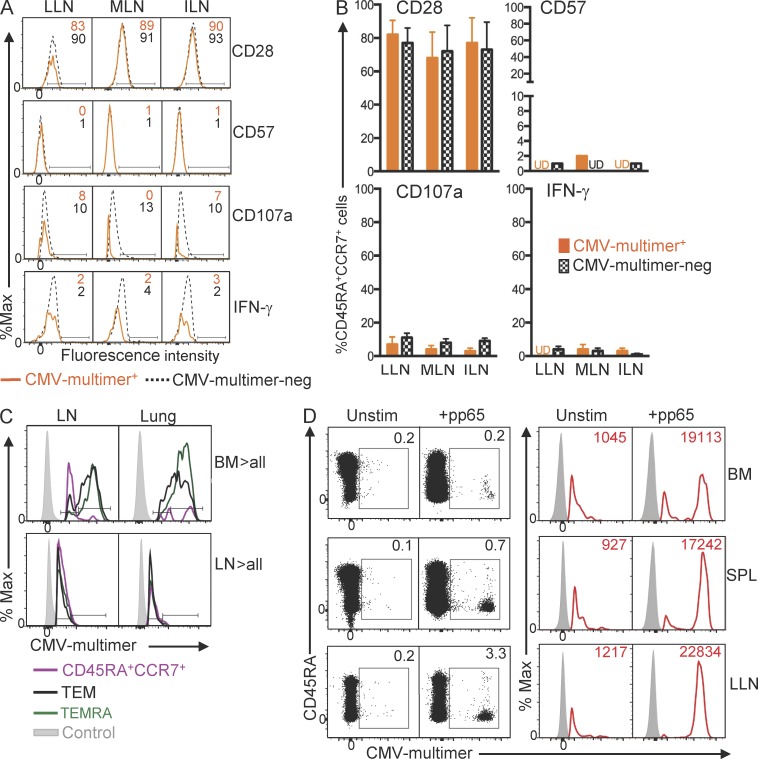
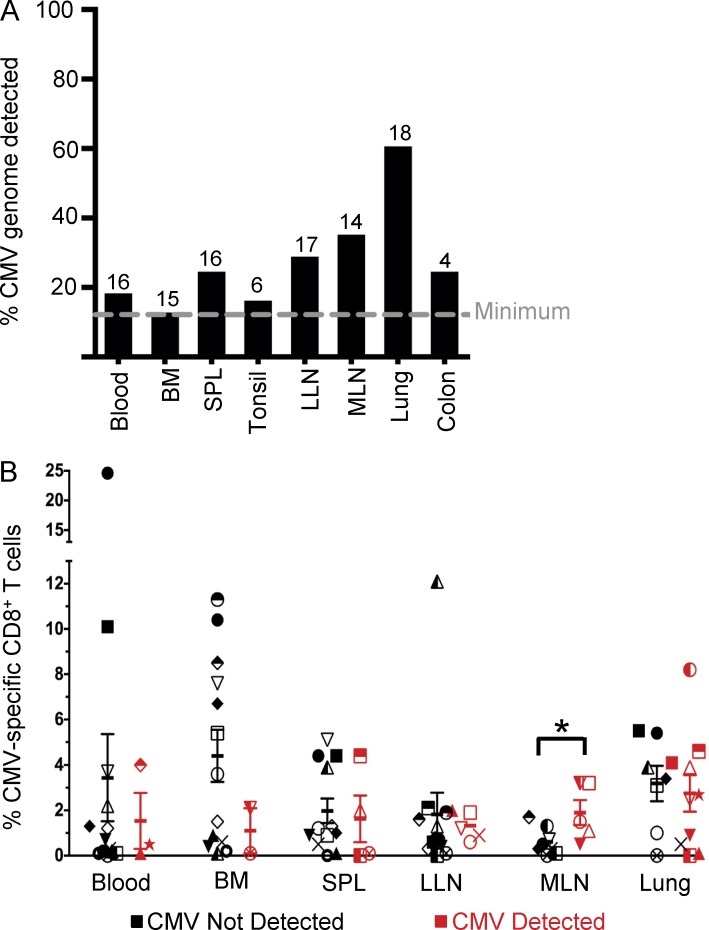
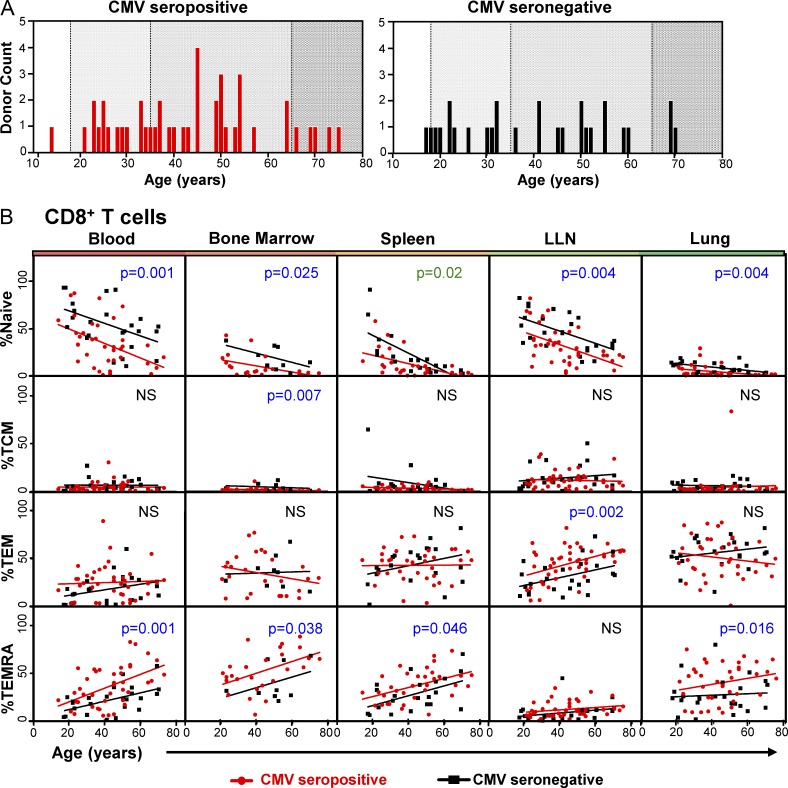
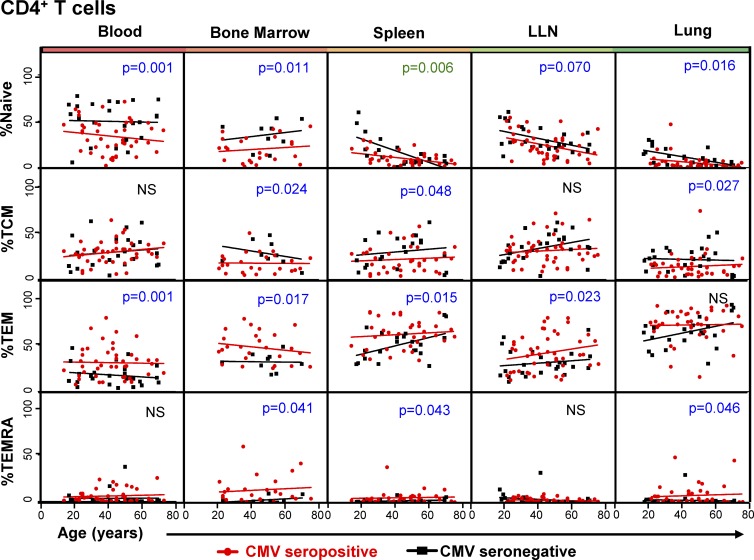
T cell responses to viruses are initiated and maintained in tissue sites; however, knowledge of human antiviral T cells is largely derived from blood. Cytomegalovirus (CMV) persists in most humans, requires T cell immunity to control, yet tissue immune responses remain undefined. Here, we investigated human CMV-specific T cells, virus persistence and CMV-associated T cell homeostasis in blood, lymphoid, mucosal and secretory tissues of 44 CMV seropositive and 28 seronegative donors. CMV-specific T cells were maintained in distinct distribution patterns, highest in blood, bone marrow (BM), or lymph nodes (LN), with the frequency and function in blood distinct from tissues. CMV genomes were detected predominantly in lung and also in spleen, BM, blood and LN. High frequencies of activated CMV-specific T cells were found in blood and BM samples with low virus detection, whereas in lung, CMV-specific T cells were present along with detectable virus. In LNs, CMV-specific T cells exhibited quiescent phenotypes independent of virus. Overall, T cell differentiation was enhanced in sites of viral persistence with age. Together, our results suggest tissue T cell reservoirs for CMV control shaped by both viral and tissue-intrinsic factors, with global effects on homeostasis of tissue T cells over the lifespan.


Figures

Figure 1.
Figure 1.
Heterogeneity of CMV-specific CD8+ T cell distribution in circulation and tissues. CMV-specific CD8+ T cell distribution was assessed by staining with HLA multimer reagents containing CMV-specific epitopes (CMV-multimers; see Table S1 for complete list) from 24 CMV-seropositive and 17 CMV-seronegative organ donors aged 6–70 yr. (A) Representative flow cytometry plots of CMV-multimer staining of live CD3+CD19CD4CD8+ cells in blood and indicated tissues (BM, LLN, MLN, and ILN) gated based on staining with negative multimer controls (see Materials and methods) from four representative CMV-seropositive individual donors (top four rows) and four representative CMV-seronegative donors (bottom row). Individual donors, ages, and the tissue site with the maximum frequency (where applicable) are indicated. Multimer combinations chosen based on donor HLA type are indicated. Representative flow cytometry for CMV-seronegative controls are for donor 177 (blood), donor 200 (BM), donor 105 (spleen), and donor 212 (LLN) with CMV-multimer A2 pp65-NLV, representative of 17 CMV-seronegative donors. (B) Representative flow cytometry plots of CMV-multimer B7 pp65-TPR staining of live CD3+CD19CD4CD8+ cells (left) and IFN-γ secretion and CD69 expression of live CD3+CD4CD8+ after 6-h culture without peptide (unstim) or with CMV peptide mixes for pp65 and IE-1 (right; see Materials and methods) from blood of a 73-yr-old male (D262). (C) Individualized CMV-multimer frequency results for 20 donors showing four distinct distribution patterns: Highest frequency of CMV-multimer+CD8+ T cells in blood compared with other sites (Blood > all; red lines; four donors); highest frequency in BM compared with other sites (BM > all; black lines; nine donors); highest frequency of in LNs compared with other sites (LN > all, blue lines, three donors); and low frequency throughout multiple sites (green lines; four donors). Each line represents one donor, with each donor having a unique symbol. Individual CMV multimer+ frequencies and usage are shown in Table 2. (D) Compiled results showing mean frequency (±SEM) of CMV-specific T cells from multiple donors stratified into four distribution patterns of CMV-multimer+CD8+ T cells in blood and tissues: Blood > all (n = 4; red); BM > all (n = 9; black); LN > all (n = 3; blue); and low frequency in all tissue sites (n = 4; green). The mean (±SEM) number of CMV-multimer+ T cells detected in each sample was as follows: blood, 577 (±301); BM, 2,552 (±837); spleen, 1,470 (±340); LLN, 1,349 (±727); MLN, 2,254 (±1,350); ILN, 712 (±306); lung, 964 (±223); colon, 168 (±71); and tonsils, 715 (±595). Flow cytometry staining for each donor was performed in triplicate. Numbers in the flow cytometry plots indicate the percent of cells expressing given markers.
Figure 2.
Figure 2.
Subset delineation of CMV-specific CD8+ T cells in donors with distinct tissue distribution patterns. Subset delineation of CMV-specific CD8+ T cells in each site was defined based on CD45RA and CCR7 expression. (A) Flow cytometry plots of CD45RA and CCR7 expression delineates four major subsets in each quadrant: naive (CD45RA+CCR7+, top right), TCM (CD45RACCR7+, bottom right), TEM (CD45RACCR7, bottom left), and TEMRA (CD45RA+CCR7, top left), in eight tissue sites. (left) Representative gating for CD45RA and CCR7 for CMV-multimer neg. cells from blood of each donor. (right) Coordinate expression of CD45RA and CCR7 gated on CMV-multimer+CD3+CD19CD4CD8+ T cells from donors with highest frequencies of CMV-specific T cells in blood (donor 217, 49 yr old; top row), BM (donor 174, 35 yr old; middle row), and LN (donor 150, 39 yr old; bottom row). CMV-multimers used for each donor are indicated in Table 2. (B) Heat map of CMV-specific CD8+ naive, TCM, TEM, and TEMRA cell frequency (ranging from 0% [blue] to 100%, [yellow]) based on the gating in A in 20 individual donors stratified by frequency distribution pattern of CMV-specific cells identified in Fig. 1 and ranked according to age. Flow cytometry staining for each donor was performed in triplicate panels. Numbers in the flow cytometry plots indicate the percent of cells expressing given markers.
Figure 3.
Figure 3.
CMV-specific T cells in donors with the highest frequencies in blood or BM exhibit phenotypes of previous activation. The phenotype and function of CMV-specific T cells from donors with the highest frequencies in blood and BM were examined (n = 13 total). (A) Expression of cell surface markers (CD69, CD28, and CD57) and intracellular perforin (PFN) by CMV-multimer+ TEM CD8+ T cells (solid red) compared with CMV-multimer–negative (-neg.) TEM CD8+ T cells (dotted black) in blood, BM, spleen, LLN, and lung. Shown are representative histograms of CD69 (donor 147, top row), CD28 (donor 194, second row), CD57 (donor 201, third row), and PFN (donor 201, fourth row) expression by TEM cells stained directly ex vivo. (B) Mean frequency (±SEM) of CMV-multimer+ (red squares) and CMV-neg. (black triangles) CD8+ TEM cells expressing markers as in A in blood and indicated tissues, compiled from 13 donors. Number of donors for each graph was as follows: CD69 (n = 5–9 per site), CD28 (n = 8–10 per site), CD57 (n = 8–11 per site), and PFN (n = 6–7 per site). (C) Representative flow cytometry plots of CMV-multimer staining of live T cells (top row) and IFN-γ production by CMV-multimer+ CD8+ T cells (bottom row) after 3-h culture without stimulation (Unstim.) or with PMA/ionomycin (PMA + I). (D; left) IFN-γ production by CMV-multimer+ TEM CD8+ T cells (red) compared with CMV-neg. TEM CD8+ T cells (black) in blood, BM, spleen, and lung of donor 217 by intracellular cytokine staining after stimulation with PMA/ionomycin (see Materials and methods). (right) Mean frequency (±SEM) of CMV-multimer+ (red squares) and CMV-multimer-neg. (black triangles) CD8+ TEM cells producing IFN-γ in blood and indicated tissues, compiled from eight donors (n = 4–8 per site). (E) Expression of cell surface markers (CD28 and CD57), and CD107a expression and IFN-γ production by CMV-multimer+ CD45RA+CCR7+ CD8+ T cells (solid red) compared with CMV-multimer-neg. CD45RA+CCR7+ CD8+ T cells (dotted black) in blood, BM, and LLN from the same donors as in A. Surface CD107a and intracellular IFN-γ production was measured after stimulation with PMA/ionomycin. Shown are histograms of CD28 (first row), CD57 (second row), CD107a (third row), and IFN-γ (fourth row) of indicated subsets from donor 196, analyzed as in A. (F) Mean frequency (±SEM) of CMV-multimer+ (red squares) and -neg. (black triangles) CD45RA+CCR7+ CD8+ T cells expressing CD28, CD57, CD107a, and IFN-γ in blood and indicated tissues, compiled from 13 donors. Number of donors for each graph: CD28 (n = 8–10 per site), CD57 (n = 8–11 per site), CD107a (n = 5–8 per site), and IFN-γ (n = 4–8 per site). Significant differences for comparison of means between CMV-multimer+ and -neg. CD8+ T cells within each tissue site were determined by Student’s t test and corrected by Holm-Sidak for multiple comparisons. *, P = 0.05–0.011; **, P = 0.01–0. 001; ***, P < 0.001. Numbers in the flow cytometry plots indicate the percent of cells expressing given markers.
Figure 4.
Figure 4.
CMV-specific T cells are quiescent in donors with highest frequencies in LN or low frequency distribution patterns. (A) Phenotypic and functional properties of CMV-specific CD45RA+CCR7+CD8+ T cells in LNs from donors with the highest frequencies in LN or low frequencies in multiple sites (seven donors total). Shown are histograms of CD28 (donor 169, first row), CD57 (donor 169, second row), CD107a (donor 207, third row), and IFN-γ (donor 207, fourth row) in CMV-multimer+ (solid orange line) compared with CMV-multimer-neg. (dotted black line) CD45RA+CCR7+CD8+ T cells. (B) Graphs show expression of surface and functional markers as mean frequency (±SEM where appropriate) of CD28+, CD57+, CD107a, and IFN-γ+ CMV-multimer+ (orange bars) compared with -neg CD45RA+CCR7+CD8+ T cells (checkered black) in LLN, MLN, and ILN. Significant differences for comparison of means between CMV-multimer+ and -neg. CD45RA+CCR7+CD8+ T cells within each tissue site were determined by Student’s t test and corrected by Holm-Sidak for multiple comparisons, with no significant difference found within a given site. Number of donors for each graph: CD28 (n = 4–6 per site), CD57 (n = 2–4 per site), and IFN-γ (n = 3–5 per site). (C) CMV-specific CD8+ T cells vary in multimer avidity as a function of tissue and distribution pattern. Representative histograms of CMV-multimer fluorescence intensity by CD45RA+CCR7+ (violet), TEM (black), and TEMRA (green) subsets in LN and lung compared with the CMV-multimer-neg. control (shaded gray) from a donor with highest frequencies in BM (top row, donor 201) and a donor with highest frequencies in LN (bottom row, donor 150). (D) Increased multimer avidity of CMV-specific T cells after CMV peptide stimulation. Total mononuclear cells from BM, spleen and LLN (donor 194) were stimulated for 9 d with pp65 peptide mix (see methods). Left: Frequency of CMV-multimer+ CD8+ T cells before and after stimulation. (right) CMV-multimer staining in unstimulated versus pp65-expanded CD8+ T cells, with numbers in plots denoting MFI of CMV-multimer staining. Cells were pooled from triplicate samples. Numbers in the flow cytometry plots indicate the percent of cells expressing given markers.
Figure 5.
Figure 5.
CMV persistence and CMV-specific T cell responses in circulation and tissues. (A) Mean frequency of detection of CMV genomes in tissues of 21 CMV-seropositive donors. Dashed gray line indicates the minimum frequency of CMV genome detection for all tissue sites. Numbers above the bars represent the number of samples tested for each tissue. Each sample was run in 10–13 replicates and scored as “detected” (CMV genome targets detected in any replicate) or not detected (no CMV genome targets detected in any replicate). (B) Mean frequency (±SEM) of CMV-specific T cells in tissues of donors in which CMV genomes were detected (red) or not detected (black), compiled from 18 donors. Each shape denotes an individual donor. Significant differences for comparison of means between donors in which CMV genomes were detected (red) or not detected (black) within each tissue site were determined by Student’s t test and corrected Holm-Sidak for multiple comparisons. *, P < 0.05, and no significant differences found for other sites.
Figure 6.
Figure 6.
CMV infection has global effects on tissue CD8+ T cell differentiation and homeostasis. (A) Age distribution of CMV-seropositive (red, n = 44) and CMV-seronegative (black, n = 28) donors divided into four age groups: Youth (<18 yr, white), young adult (18–35 yr, light gray), adult (36–65 yr, gray), and senior (≥66 yr, dark gray). Donor information shown in Table S3. (B) Graphs show total CD8+ T cell subset distribution based on overall phenotype (naive, TCM, TEM, and TEMRA, based on CD45RA/CCR7 expression) in the indicated tissues from CMV-seropositive (red lines) and -seronegative (black lines) donors as a function of age, with each dot representing an individual donor and changes with age determined by linear regression analysis. Significant P-values for comparison of slope regression lines between seropositive and -negative are shown in green; P-values for the comparison of slope intercepts are shown in blue and nonsignificant P-values for the comparison of slope intercepts are denoted by NS.
Figure 7.
Figure 7.
CMV infection has global effects on tissue CD4+ T cell differentiation and homeostasis. Graphs show total CD4+ T cell subset distribution based on overall phenotype (naive, TCM, TEM, and TEMRA, based on CD45RA/CCR7 expression) in the indicated tissues from CMV-seropositive (red lines) and -seronegative (black lines) donors as a function of age, with each dot representing an individual donor and changes with age determined by linear regression analysis, as in Fig. 6. Significant p-values for comparison of slope regression lines between seropositive and -negative are shown in green; P-values for the comparison of slope intercepts are shown in blue, and nonsignificant P-values for the comparison of slope intercepts are denoted by NS.

Similar articles

Cited by

References

    1. Adland E., Klenerman P., Goulder P., and Matthews P.C.. 2015. Ongoing burden of disease and mortality from HIV/CMV coinfection in Africa in the antiretroviral therapy era. Front. Microbiol. 6:1016 10.3389/fmicb.2015.01016 - DOI - PMC - PubMed
    1. Akulian J.A., Pipeling M.R., John E.R., Orens J.B., Lechtzin N., and McDyer J.F.. 2013. High-quality CMV-specific CD4+ memory is enriched in the lung allograft and is associated with mucosal viral control. Am. J. Transplant. 13:146–156. 10.1111/j.1600-6143.2012.04282.x - DOI - PMC - PubMed
    1. Anderson K.G., Sung H., Skon C.N., Lefrancois L., Deisinger A., Vezys V., and Masopust D.. 2012. Cutting edge: intravascular staining redefines lung CD8 T cell responses. J. Immunol. 189:2702–2706. 10.4049/jimmunol.1201682 - DOI - PMC - PubMed
    1. Arens R., Remmerswaal E.B., Bosch J.A., and van Lier R.A.. 2015. 5(th) International Workshop on CMV and Immunosenescence - A shadow of cytomegalovirus infection on immunological memory. Eur. J. Immunol. 45:954–957. 10.1002/eji.201570044 - DOI - PubMed
    1. Betts M.R., Brenchley J.M., Price D.A., De Rosa S.C., Douek D.C., Roederer M., and Koup R.A.. 2003. Sensitive and viable identification of antigen-specific CD8+ T cells by a flow cytometric assay for degranulation. J. Immunol. Methods. 281:65–78. 10.1016/S0022-1759(03)00265-5 - DOI - PubMed

Publication types

MeSH terms

Substances

Associated data