5-fluorouracil causes endothelial cell senescence: potential protective role of glucagon-like peptide 1
- PMID: 28127745
- PMCID: PMC5647192
- DOI: 10.1111/bph.13725
5-fluorouracil causes endothelial cell senescence: potential protective role of glucagon-like peptide 1
Abstract
Background and purpose: 5-fluorouracil (5FU) and its prodrug, capecitabine, can damage endothelial cells, whilst endothelial integrity is preserved by glucagon-like peptide 1 (GLP-1). Here, we studied the effect of 5FU on endothelial senescence and whether GLP-1 antagonizes it.
Experimental approach: EA.hy926 cells were exposed to 5FU or sera from patients taking capecitabine, with or without pre-incubation with GLP-1. Senescence was identified by expression of senescence-associated β-galactosidase and p16INK4a and reduced cell proliferation. Soluble vascular cell adhesion molecule-1 (sVCAM-1), soluble intercellular adhesion molecule-1 (sICAM-1) and CD146 (marker of endothelial injury) were measured by ELISA before and at completion of capecitabine chemotherapy. RT-PCR, western blotting, functional experiments with signalling inhibitors and ERK1/2 silencing were performed to characterize 5FU-induced phenotype and elucidate the pathways underlying 5FU and GLP-1 activity.
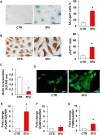
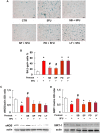
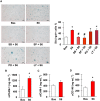
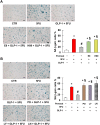
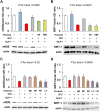
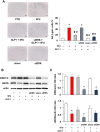
Key results: Both 5FU and sera from capecitabine-treated patients stimulated endothelial cell senescence. 5FU-elicited senescence occurred via activation of p38 and JNK, and was associated with decreased eNOS and SIRT-1 levels. Furthermore, 5FU up-regulated VCAM1 and TYMP (encodes enzyme activating capecitabine and 5FU), and sVCAM-1 and CD146 concentrations were higher after than before capecitabine chemotherapy. A non-significant trend for higher ICAM1 levels was also observed. GLP-1 counteracted 5FU-initiated senescence and reduced eNOS and SIRT-1 expression, this protection being mediated by GLP-1 receptor, ERK1/2 and, possibly, PKA and PI3K.
Conclusions and implications: 5FU causes endothelial cell senescence and dysfunction, which may contribute to its cardiovascular side effects. 5FU-triggered senescence was prevented by GLP-1, raising the possibility of using GLP-1 analogues and degradation inhibitors to treat 5FU and capecitabine vascular toxicity.
Linked articles: This article is part of a themed section on New Insights into Cardiotoxicity Caused by Chemotherapeutic Agents. To view the other articles in this section visit http://onlinelibrary.wiley.com/doi/10.1111/bph.v174.21/issuetoc.
© 2017 The British Pharmacological Society.
Figures

Similar articles
-
Glucagon-like peptide 1 prevents reactive oxygen species-induced endothelial cell senescence through the activation of protein kinase A.Arterioscler Thromb Vasc Biol. 2010 Jul;30(7):1407-14. doi: 10.1161/ATVBAHA.110.206425. Epub 2010 May 6. Arterioscler Thromb Vasc Biol. 2010. PMID: 20448207
-
GLP-1 and Ghrelin Attenuate High Glucose/High Lipid-Induced Apoptosis and Senescence of Human Microvascular Endothelial Cells.Cell Physiol Biochem. 2017;44(5):1842-1855. doi: 10.1159/000485820. Epub 2017 Dec 7. Cell Physiol Biochem. 2017. PMID: 29224011
-
A glucagon-like peptide-1 (GLP-1) analogue, liraglutide, upregulates nitric oxide production and exerts anti-inflammatory action in endothelial cells.Diabetologia. 2010 Oct;53(10):2256-63. doi: 10.1007/s00125-010-1831-8. Epub 2010 Jul 1. Diabetologia. 2010. Retraction in: Diabetologia. 2012 Feb;55(2):533. doi: 10.1007/s00125-011-2394-z. PMID: 20593161 Retracted.
-
Brain GLP-1 and the regulation of food intake: GLP-1 action in the brain and its implications for GLP-1 receptor agonists in obesity treatment.Br J Pharmacol. 2022 Feb;179(4):557-570. doi: 10.1111/bph.15638. Epub 2021 Aug 28. Br J Pharmacol. 2022. PMID: 34323288 Free PMC article. Review.
-
Actions of glucagon-like peptide-1 receptor ligands in the gut.Br J Pharmacol. 2022 Feb;179(4):727-742. doi: 10.1111/bph.15611. Epub 2021 Aug 4. Br J Pharmacol. 2022. PMID: 34235727 Free PMC article. Review.
Cited by
-
Data regarding the effects of thrombin and dabigatran-inhibited thrombin on protease-activated receptor 1 and activation of human atrial fibroblasts.Data Brief. 2018 May 25;19:925-931. doi: 10.1016/j.dib.2018.05.124. eCollection 2018 Aug. Data Brief. 2018. PMID: 29900391 Free PMC article.
-
Endogenous Vasoactive Peptides and Vascular Aging-Related Diseases.Oxid Med Cell Longev. 2022 Oct 3;2022:1534470. doi: 10.1155/2022/1534470. eCollection 2022. Oxid Med Cell Longev. 2022. PMID: 36225176 Free PMC article. Review.
-
Senescence in the bone marrow microenvironment: A driver in development of therapy-related myeloid neoplasms.J Bone Oncol. 2024 Jul 5;47:100620. doi: 10.1016/j.jbo.2024.100620. eCollection 2024 Aug. J Bone Oncol. 2024. PMID: 39072049 Free PMC article.
-
Metformin inhibits cholesterol‑induced adhesion molecule expression via activating the AMPK signaling pathway in vascular smooth muscle cells.Mol Med Rep. 2021 Oct;24(4):709. doi: 10.3892/mmr.2021.12348. Epub 2021 Aug 13. Mol Med Rep. 2021. PMID: 34396446 Free PMC article.
-
Impaired microvascular reactivity in patients treated with 5-fluorouracil chemotherapy regimens: Potential role of endothelial dysfunction.Int J Cardiol Heart Vasc. 2023 Nov 17;49:101300. doi: 10.1016/j.ijcha.2023.101300. eCollection 2023 Dec. Int J Cardiol Heart Vasc. 2023. PMID: 38173789 Free PMC article.
References
-
- Adamsen BL, Kravik KL, De Angelis PM (2011). DNA damage signaling in response to 5‐fluorouracil in three colorectal cancer cell lines with different mismatch repair and TP53 status. Int J Oncol 39: 673–682. - PubMed
-
- Azimzadeh O, Sievert W, Sarioglu H, Merl‐Pham J, Yentrapalli R, Bakshi MV et al. (2015). Integrative proteomics and targeted transcriptomics analyses in cardiac endothelial cells unravel mechanisms of long‐term radiation‐induced vascular dysfunction. J Proteome Res 14: 1203–1219. - PubMed
MeSH terms
Substances
LinkOut - more resources
Full Text Sources
Other Literature Sources
Research Materials
Miscellaneous

