. 2017 Feb 9;542(7640):197-202.
doi: 10.1038/nature21025. Epub 2017 Jan 23.

An Argonaute phosphorylation cycle promotes microRNA-mediated silencing

Affiliations

An Argonaute phosphorylation cycle promotes microRNA-mediated silencing

Ryan J Golden et al. Nature. .

Abstract

MicroRNAs (miRNAs) perform critical functions in normal physiology and disease by associating with Argonaute proteins and downregulating partially complementary messenger RNAs (mRNAs). Here we use clustered regularly interspaced short palindromic repeats (CRISPR) and CRISPR-associated protein 9 (Cas9) genome-wide loss-of-function screening coupled with a fluorescent reporter of miRNA activity in human cells to identify new regulators of the miRNA pathway. By using iterative rounds of screening, we reveal a novel mechanism whereby target engagement by Argonaute 2 (AGO2) triggers its hierarchical, multi-site phosphorylation by CSNK1A1 on a set of highly conserved residues (S824-S834), followed by rapid dephosphorylation by the ANKRD52-PPP6C phosphatase complex. Although genetic and biochemical studies demonstrate that AGO2 phosphorylation on these residues inhibits target mRNA binding, inactivation of this phosphorylation cycle globally impairs miRNA-mediated silencing. Analysis of the transcriptome-wide binding profile of non-phosphorylatable AGO2 reveals a pronounced expansion of the target repertoire bound at steady-state, effectively reducing the active pool of AGO2 on a per-target basis. These findings support a model in which an AGO2 phosphorylation cycle stimulated by target engagement regulates miRNA:target interactions to maintain the global efficiency of miRNA-mediated silencing.


Figures

Extended Data Figure 1
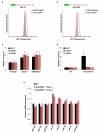
Extended Data Figure 1. Knockout of candidate miRNA regulators in HCT116EGFP cells
Flow cytometry analysis of EGFP in HCT116EGFP cells after transduction with lentiCRISPR vectors targeting the indicated genes.
Extended Data Figure 2
Extended Data Figure 2. BRD4, CTNNB1, and POU2F1 positively regulate miR-19 expression
a, Model depicting how each gene may promote expression of the miR-17-92 cluster. b, c, d, Western blot analysis confirming loss of expression of the indicated gene in HCT116 knockout clones. Asterisk indicates non-specific band. For each protein, all lanes came from the same blot but irrelevant lanes were removed. e, f, g, qRT-PCR assays demonstrating reduced expression of MYC (e), pri-miR-17-92 (f), or mature miR-19a/b (g) in BRD4−/−, CTNNB1−/−, or POU2F1−/− cells. For gel source data, see Supplementary Figure 1.
Extended Data Figure 3
Extended Data Figure 3. Western blot analysis confirms loss of protein expression in AGO2 (a) and ANKRD52 (b) HCT116 clonal knockout lines
For each protein, all lanes came from the same blot but irrelevant lanes were removed. For gel source data, see Supplementary Figure 1.
Extended Data Figure 4
Extended Data Figure 4. General impairment of miRNA-mediated silencing in ANKRD52−/− cells
a, b, Flow cytometry analysis of EGFP expression in HCT116 cells stably expressing reporters for miR-16 (a) or miR-200 (b) after transduction with lentiCRISPR vectors targeting ANKRD52 or expressing a non-targeting sgRNA. c, qRT-PCR showing de-repression of established let-7 targets (DICER1 or HMGA2) in AGO2−/− or ANKRD52−/− cells. *p < 0.05, **p < 0.01, two-tailed student’s t test comparing AGO2−/− or ANKRD52−/− to parental. (N = 3 biological replicates, each assayed in triplicate). d, qRT-PCR analysis of DICER1 and HMGA2 in non-transfected (NT) HCT116EGFP-miR-19 cells or after transfection with miR-19 antisense oligonucleotides (Anti-miR-19) confirms that these transcripts are not regulated by miR-19. Upregulation of the EGFP miR-19 reporter transcript served as a positive control in this experiment. (N = 3 biological replicates, each assayed in triplicate). e, qRT-PCR was performed for the indicated miRNAs and expression levels were normalized to U6 snRNA (N = 2 biological replicates, each assayed in triplicate).
Extended Data Figure 5
Extended Data Figure 5. The ANKRD52-PPP6C complex interacts with and dephosphorylates AGO proteins
a, Co-immunoprecipitation of FLAG-HA-AGO2 (FH-AGO2) with V5-ANKRD52 or V5-PPP6C with or without RNase A treatment. b, Phos-tag electrophoresis demonstrating AGO2 hyperphosphorylation in multiple ANKRD52/PPP6C-deficient cell lines. c, Phos-tag western blot analysis of FLAG-HA-AGO1 (FH-AGO1) stably expressed in ANKRD52+/+ and ANKRD52−/− HCT116 cells. For gel source data, see Supplementary Figure 1.
Extended Data Figure 6
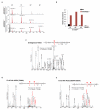
Extended Data Figure 6. Identification of multiple definitively phosphorylated residues in the S824-S834 region of AGO2 by mass spectrometry
a, Full scan mass spectra zoomed to the region for the AGO2 815-837 peptide. The unphosphorylated and multiply phosphosphorylated precursor ions are shown in red. Peak labels indicate the mass-to-charge ratios and the charge state. The singly charged ion with grey label (top panel) does not correspond to peptide 815-837. Data at two close elution time points are shown for ANKRD52−/− to illustrate the unphosphorylated (0P), singly (1P), doubly (2P) and triply (3P) phosphorylated peptides. b, Quantification of the indicated endogenous AGO2 phosphopeptides relative to unphosphorylated peptide as determined by mass spectrometry. 1P, 2P, or 3P respectively denotes singly, doubly, or triply phosphorylated peptides spanning residues 815-837 of AGO2. Superscript indicates peptide charge state. ND, not detected. c, MS/MS spectra demonstrating phosphorylation of endogenous AGO2 at S824 in ANKRD52−/− cells. Red bars denote site-determining ions. d, e, MS/MS spectra demonstrating phosphorylation of FH-AGO2 (T830A) at S824 and S828 (d) or phosphorylation of FH-AGO2 (S824A/T830A) at S828 and S831(e) in ANKRD52−/− cells.
Extended Data Figure 7
Extended Data Figure 7. Phosphomimetic mutants of FH-AGO2 do not exhibit reduced miRNA association
a, Western blots showing expression of the indicated FH-AGO2 mutants. Within each panel (upper, middle, lower), all lanes came from the same blot but irrelevant lanes were removed. b, miRNA association of wild-type or mutant FH-AGO2 assessed as described in Figure 3a (N = 4 biological replicates, each assayed in triplicate). For gel source data, see Supplementary Figure 1.
Extended Data Figure 8
Extended Data Figure 8. Analysis of serine/threonine kinases identified in the CRISPR-Cas9 suppressor screen
a, b, Flow cytometry demonstrating EGFP expression in HCT116EGFP-miR19 (a) or HCT116EGFP cells (b) after transduction with lentiCRISPR vectors targeting the indicated genes. c, Flow cytometry demonstrating EGFP expression in HCT116EGFP-miR19 cells treated with the indicated dose of rapamycin. NT, not treated. d, Phos-tag western blot analysis of AGO2 in ANKRD52−/− cells after treatment with rapamycin. For gel source data, see Supplementary Figure 1.
Extended Data Figure 9
Extended Data Figure 9. Functional characterization of CSNK1A1 and AGO2 target binding mutants
a, Western blot analysis confirms loss of CSNK1A1 expression in HCT116 ANKRD52−/−; CSNK1A1−/− clonal knockout cells. All lanes came from the same blot but irrelevant lanes were removed. b, miR-19 expression normalized to U6 expression, assessed by qRT-PCR, in cells of the indicated genotypes (N = 4 biological replicates, each assayed in triplicate). c, Co-immunoprecipitation of V5-CSNK1A1 with FH-AGO2, with or without RNase A treatment. d, miRNA association of FH-AGO2 assessed as in Fig. 3e (N = 4 biological replicates, each assayed in triplicate). *p < 0.05 comparing mutant to wild-type AGO2, two-tailed student’s t test. For gel source data, see Supplementary Figure 1.
Extended Data Figure 10
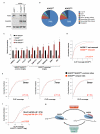
Extended Data Figure 10. Generation and eCLIP analysis of AGO2−/− cells reconstituted with AGO2WT or AGO25XA
a, Western blot showing equivalent expression of FH-AGO2WT and FH-AGO25XA at physiologic levels. b, Distribution of AGO2 binding sites determined by eCLIP. For gel source data, see Supplementary Figure 1. c, Validation of targets identified by eCLIP using FH-AGO2 pull-down assays performed in reconstituted AGO2−/− cells. Experiment was performed as in Fig. 3a except anti-FLAG antibody was used for immunoprecipitation (N = 3 biological replicates, each assayed in triplicate). *p < 0.05, **p < 0.01, one-tailed student’s t test comparing FH-AGO25XA to FH-AGO2WT. n.s., not significant. d, FH-AGO2WT CLIP coverage (normalized total number of reads in clusters in a given 3' UTR divided by FPKM) of genes whose AGO2-mediated repression is or is not rescued by FH-AGO25XA. e, 8mer, 7mer, or 6mer binding sites for active miRNAs in HCT116 were identified within FH-AGO2WT/FH-AGO25XA-common CLIP clusters or FH-AGO25XA-unique CLIP clusters in 3' UTRs. CDF plots show CLIP coverage for each class of site (normalized number of crosslinking events within 10 nucleotides of each site). n.s., Kolmogorov-Smirnov (KS) test not significant. f, CDF plot showing the fold-change in CLIP coverage comparing FH-AGO25XA to FH-AGO2WT for transcripts with long half-lives (top quartile) vs. those with short half-lives (bottom quartile). g, Summary of the newly-defined AGO2 phosphorylation cycle. Target engagement triggers the hierarchical, multi-site phosphorylation of AGO2 by CSNK1A1, which inhibits target binding. The ANKRD52-PPP6C phosphatase complex dephosphorylates these residues, allowing AGO2 to engage new targets. Continual phosphorylation/de-phosphorylation of AGO2 through this cycle is necessary to maintain the global efficiency of miRNA-mediated silencing.
Fig. 1
Fig. 1. A genome-wide CRISPR-Cas9 screen reveals known and novel regulators of the miRNA pathway
a, Design of CRISPR-Cas9 screen. b, Validation of reporter cell lines. EGFP fluorescence after introduction of lentiCRISPR vectors (top) or antisense miR-19 inhibitors (bottom). c, RIGER analysis of screening results in HCT116EGFP-miR19 (top) or HCT116EGFP cells (bottom). Red dots, known components of the miRNA pathway; blue dots, putative novel regulators. d, Components of the miRNA pathway identified as significant hits. e, EGFP expression in HCT116EGFP-miR19 cells after transduction with lentiCRISPR vectors.
Fig. 2
Fig. 2. Loss of ANKRD52-PPP6C activity globally impairs miRNA-mediated silencing and results in AGO2 hyperphosphorylation
a, Cumulative distribution function (CDF) plot demonstrating that genes upregulated in AGO2−/− HCT116 cells (Supplementary Table 4; FDR ≤ 0.05) are similarly upregulated in ANKRD52−/− cells. Kolmogorov-Smirnov (KS) p value shown for this and all subsequent CDF plots. b, c, Phos-tag electrophoresis demonstrating enhanced AGO2 phosphorylation in ANKRD52/PPP6C-deficient HCT116 cells (b) and sensitivity of AGO2 phosphorylation to lambda protein phosphatase (λPP) (c). d, Evolutionary conservation of AGO2 S824-S834. Putative phosphorylation sites shown in red. e, Phos-tag analysis of FH-AGO2 mutants stably expressed in ANKRD52−/− cells. f, EGFP expression in ANKRD52−/− HCT116EGFP-miR19 cells expressing the indicated FH-AGO2 constructs. For gel source data, see Supplementary Figure 1.
Fig. 3
Fig. 3. AGO2 phosphorylation impairs mRNA target association
a, Measurement of AGO2-associated miRNA by qRT-PCR. N = 2 biological replicates each assayed in triplicate. Error bars indicate SD for this and all subsequent qRT-PCR data. b, AGO2-target association assessed as described in (a). *p < 0.05, two-tailed student’s t test comparing ANKRD52−/− to WT. c, d, Schematic (c) and phos-tag western blot (d) of AGO2:miRNA target capture experiment. e, EGFP target association of FH-AGO2 assessed as described in (a). *p < 0.05; **p < 0.001, two-tailed student’s t test (N = 4 biological replicates). f, AGO2 tethering experiments demonstrating repression of luciferase-BoxB (pGL3-BoxB) by λN-AGO2 (WT), λN-AGO2 (5XA), and λN-AGO2 (5XE), but not by untethered AGO2 or λN alone. A luciferase transcript lacking BoxB sites (pGL3-Control) served as a negative control. *p < 0.05; ** p < 0.01, two-tailed student’s t test (N = 3 biological replicates). For gel source data, see Supplementary Figure 1.
Fig. 4
Fig. 4. A CRISPR-Cas9 suppressor screen reveals CSNK1A1 as the inhibitory AGO2 kinase
a, Design of CRISPR-Cas9 screen to identify ANKRD52−/− suppressors. b, RIGER analysis with serine/threonine kinases highlighted. c, EGFP expression in ANKRD52−/− HCT116EGFP-miR19 cells transduced with lentiCRISPR vectors targeting CSNK1A1. d, Abrogated phosphorylation of AGO2 in ANKRD52−/−; CSNK1A1−/− cells. e, Relative association of miR-19a, miR-19b and EGFP target mRNA with AGO2 assessed as described in Fig. 3a (N = 3 biological replicates). f, In vitro phosphorylation of FH-AGO2 by CSNK1A1 with or without pre-treatment with λPP. g, In vitro CSNK1A1-mediated phosphorylation of the indicated peptides. For gel source data, see Supplementary Figure 1.
Fig. 5
Fig. 5. Argonaute S824-S834 phosphorylation is required for fully efficient miRNA-mediated silencing and is triggered by target binding
a, CDF plot demonstrating that genes upregulated in AGO2−/− HCT116 cells (Supplementary Table 4; FDR ≤ 0.05) are similarly upregulated in CSNK1A1−/−; ANKRD52−/− cells. b, CDF plot showing partially rescued repression of genes upregulated in AGO2−/− cells (Supplementary Table 6; FDR ≤ 0.05) reconstituted with FH-AGO25XA compared to cells reconstituted with FH-AGO2WT. c, EGFP target association of FH-AGO2 assessed as in Fig. 3e (N = 4 biological replicates, each assayed in triplicate). d, e, Phosphorylation of AGO2 mutants in ANKRD52−/− cells (d) or endogenous AGO2 after transfection of ciRS-7 constructs and the indicated miRNAs (e). For gel source data, see Supplementary Figure 1.
Fig. 6
Fig. 6. Expansion of the target repertoire bound by AGO25XA
a, Number of AGO2 binding sites determined by eCLIP. b, Unique and common genes bound by FH-AGO2WT and FH-AGO25XA. c, Binding sites for active miRNAs in HCT116 were identified within FH-AGO2WT CLIP clusters in 3' UTRs. CDF plots show CLIP coverage for each class of site (normalized number of crosslinking events within 10 nucleotides of each site divided by FPKM of the transcript) in FH-AGO2WT and FH-AGO25XA datasets.

Similar articles

Cited by

References

    1. Mendell JT, Olson EN. MicroRNAs in stress signaling and human disease. Cell. 2012;148:1172–1187. - PMC - PubMed
    1. Vidigal JA, Ventura A. The biological functions of miRNAs: lessons from in vivo studies. Trends Cell Biol. 2015;25:137–147. - PMC - PubMed
    1. Bartel DP. MicroRNAs: target recognition and regulatory functions. Cell. 2009;136:215–233. - PMC - PubMed
    1. Jonas S, Izaurralde E. Towards a molecular understanding of microRNA-mediated gene silencing. Nat Rev Genet. 2015;16:421–433. - PubMed
    1. Grimson A, et al. MicroRNA targeting specificity in mammals: determinants beyond seed pairing. Mol Cell. 2007;27:91–105. - PMC - PubMed

Publication types