

Structural basis of dual Ca2+/pH regulation of the endolysosomal TRPML1 channel
- PMID: 28112729
- PMCID: PMC5336481
- DOI: 10.1038/nsmb.3362
Structural basis of dual Ca2+/pH regulation of the endolysosomal TRPML1 channel
Abstract
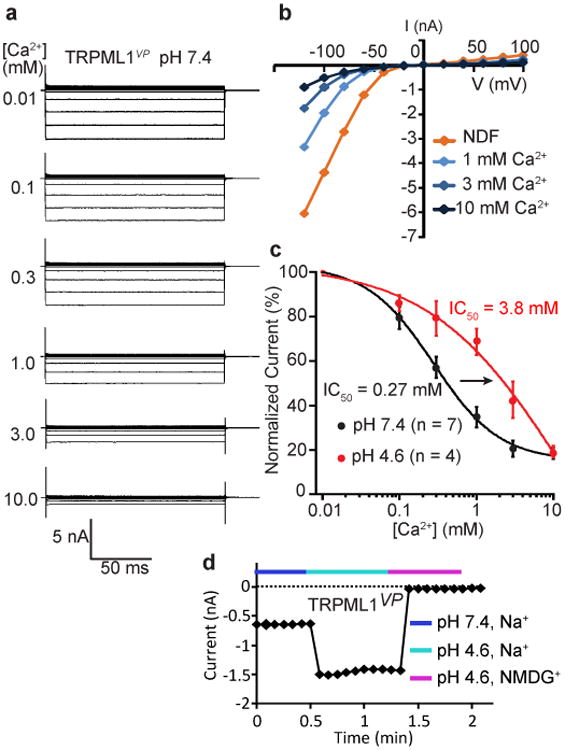
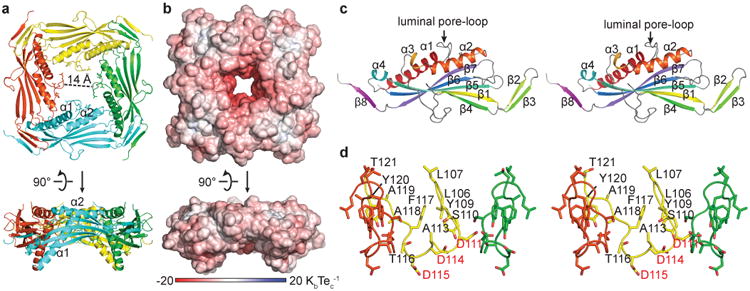
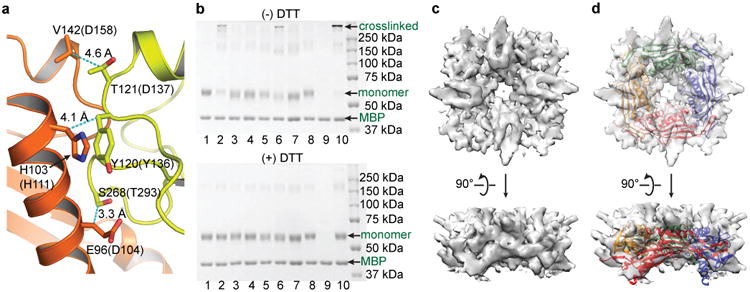
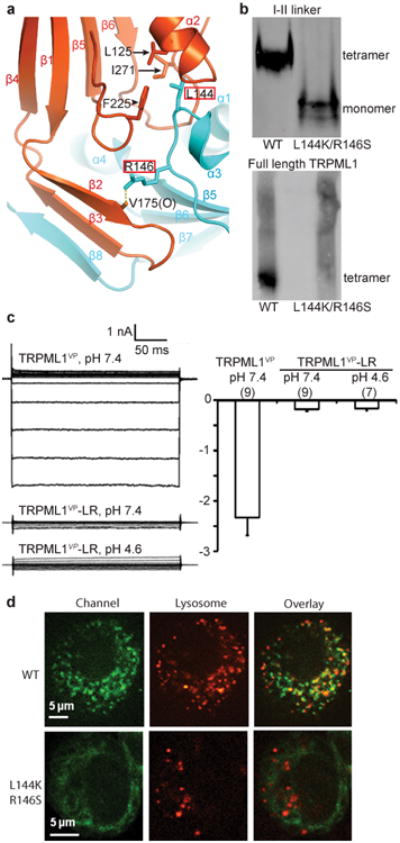
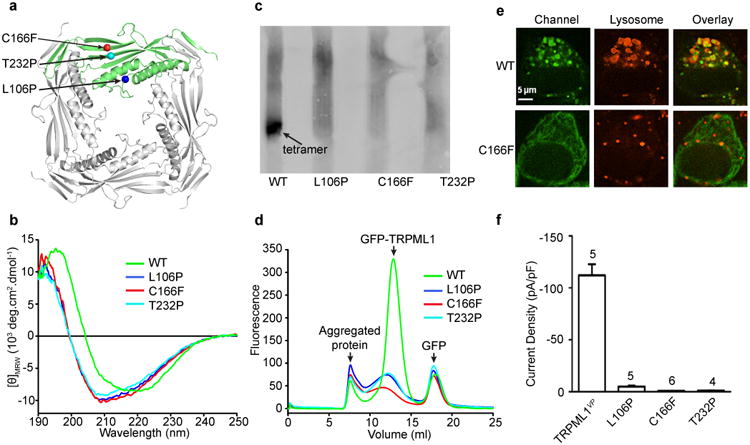
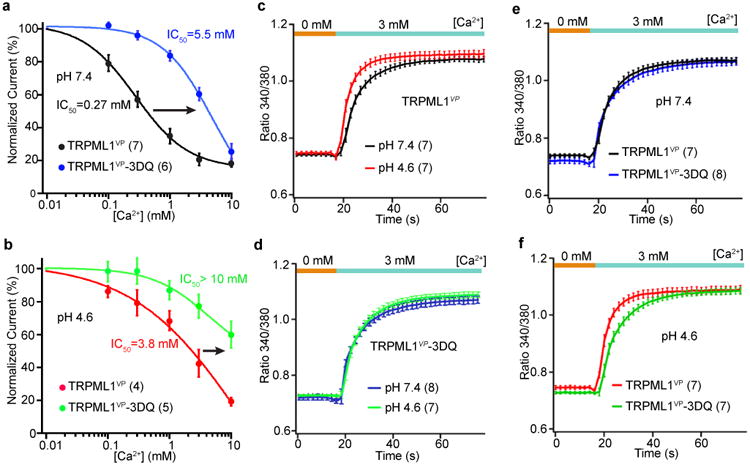
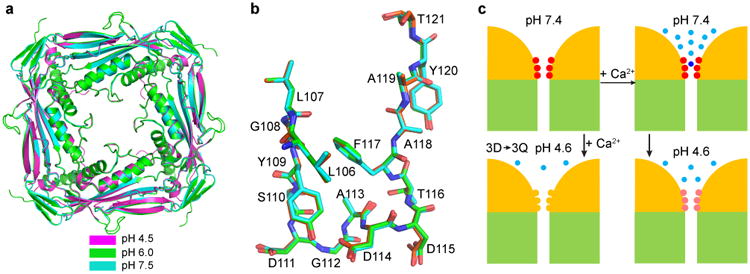
The activities of organellar ion channels are often regulated by Ca2+ and H+, which are present in high concentrations in many organelles. Here we report a structural element critical for dual Ca2+/pH regulation of TRPML1, a Ca2+-release channel crucial for endolysosomal function. TRPML1 mutations cause mucolipidosis type IV (MLIV), a severe lysosomal storage disorder characterized by neurodegeneration, mental retardation and blindness. We obtained crystal structures of the 213-residue luminal domain of human TRPML1 containing three missense MLIV-causing mutations. This domain forms a tetramer with a highly electronegative central pore formed by a novel luminal pore loop. Cysteine cross-linking and cryo-EM analyses confirmed that this architecture occurs in the full-length channel. Structure-function studies demonstrated that Ca2+ and H+ interact with the luminal pore and exert physiologically important regulation. The MLIV-causing mutations disrupt the luminal-domain structure and cause TRPML1 mislocalization. Our study reveals the structural underpinnings of TRPML1's regulation, assembly and pathogenesis.
Figures
Similar articles
-
Cryo-EM structures of the mammalian endo-lysosomal TRPML1 channel elucidate the combined regulation mechanism.Protein Cell. 2017 Nov;8(11):834-847. doi: 10.1007/s13238-017-0476-5. Epub 2017 Sep 21. Protein Cell. 2017. PMID: 28936784 Free PMC article.
-
Transient receptor potential mucolipin 1 (TRPML1) and two-pore channels are functionally independent organellar ion channels.J Biol Chem. 2011 Jul 1;286(26):22934-42. doi: 10.1074/jbc.M110.210930. Epub 2011 May 3. J Biol Chem. 2011. PMID: 21540176 Free PMC article.
-
The type IV mucolipidosis-associated protein TRPML1 is an endolysosomal iron release channel.Nature. 2008 Oct 16;455(7215):992-6. doi: 10.1038/nature07311. Epub 2008 Sep 14. Nature. 2008. PMID: 18794901 Free PMC article.
-
TRPML1: The Ca(2+)retaker of the lysosome.Cell Calcium. 2018 Jan;69:112-121. doi: 10.1016/j.ceca.2017.06.006. Epub 2017 Jun 24. Cell Calcium. 2018. PMID: 28689729 Review.
-
Mucolipin 1: endocytosis and cation channel--a review.Pflugers Arch. 2005 Oct;451(1):313-7. doi: 10.1007/s00424-004-1361-7. Epub 2004 Nov 27. Pflugers Arch. 2005. PMID: 15570434 Review.
Cited by
-
Involvement of the TRPML Mucolipin Channels in Viral Infections and Anti-viral Innate Immune Responses.Front Immunol. 2020 Apr 29;11:739. doi: 10.3389/fimmu.2020.00739. eCollection 2020. Front Immunol. 2020. PMID: 32425938 Free PMC article. Review.
-
The regulatory mechanism of mammalian TRPMLs revealed by cryo-EM.FEBS J. 2018 Jul;285(14):2579-2585. doi: 10.1111/febs.14443. Epub 2018 Apr 14. FEBS J. 2018. PMID: 29577631 Free PMC article. Review.
-
Structural mechanisms of transient receptor potential ion channels.J Gen Physiol. 2020 Mar 2;152(3):e201811998. doi: 10.1085/jgp.201811998. J Gen Physiol. 2020. PMID: 31972006 Free PMC article. Review.
-
The role of π-helices in TRP channel gating.Curr Opin Struct Biol. 2019 Oct;58:314-323. doi: 10.1016/j.sbi.2019.06.011. Epub 2019 Aug 2. Curr Opin Struct Biol. 2019. PMID: 31378426 Free PMC article. Review.
-
Current Methods to Unravel the Functional Properties of Lysosomal Ion Channels and Transporters.Cells. 2022 Mar 8;11(6):921. doi: 10.3390/cells11060921. Cells. 2022. PMID: 35326372 Free PMC article. Review.
References
-
- Stauber T, Jentsch TJ. Chloride in vesicular trafficking and function. Annu Rev Physiol. 2013;75:453–477. - PubMed
Publication types
MeSH terms
Substances
Grants and funding
LinkOut - more resources
Full Text Sources
Other Literature Sources
Molecular Biology Databases
Miscellaneous
