. 2017 Apr 15;77(8):2112-2123.
doi: 10.1158/0008-5472.CAN-16-2850. Epub 2017 Jan 20.

Biomarker-Based PET Imaging of Diffuse Intrinsic Pontine Glioma in Mouse Models

Affiliations

Biomarker-Based PET Imaging of Diffuse Intrinsic Pontine Glioma in Mouse Models

Susanne Kossatz et al. Cancer Res. .

Abstract

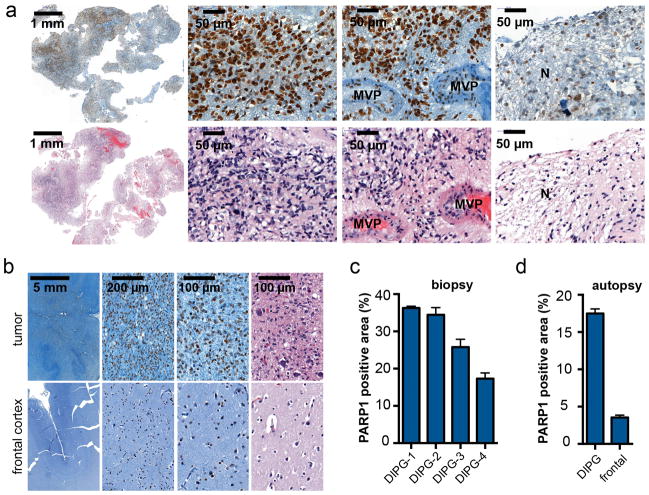
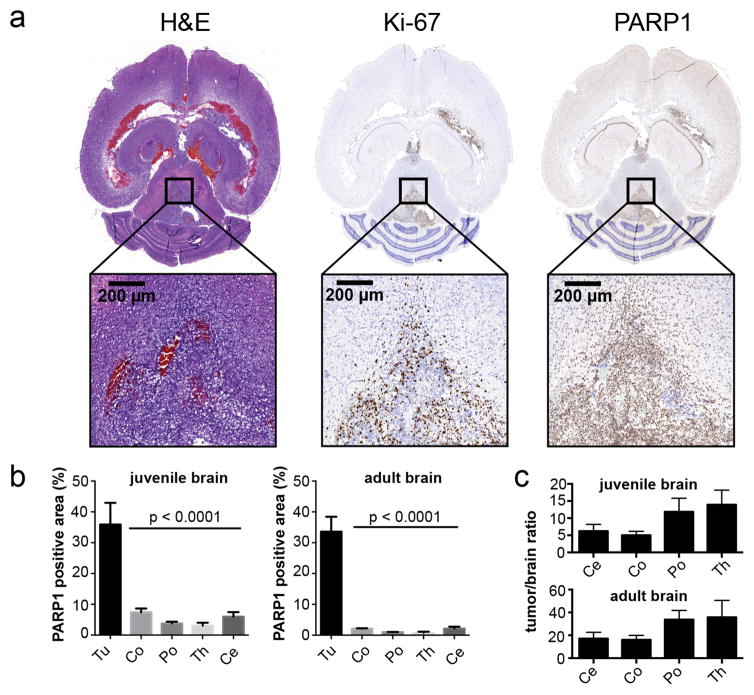
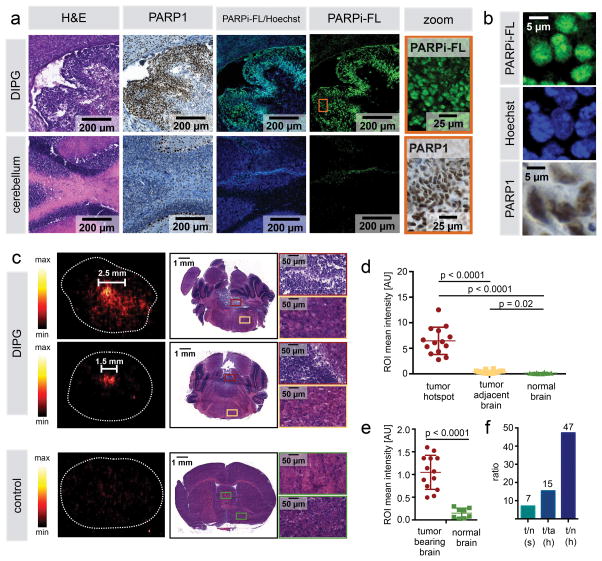
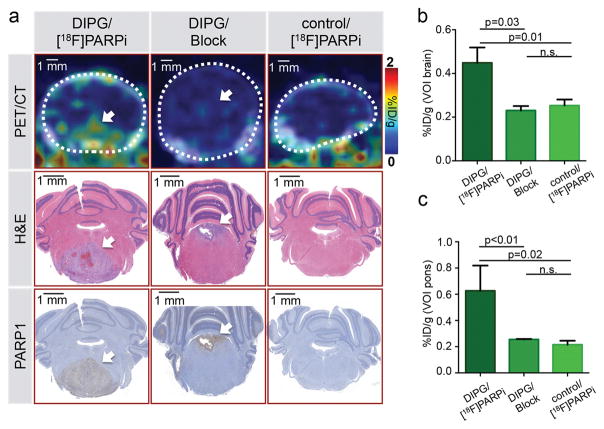
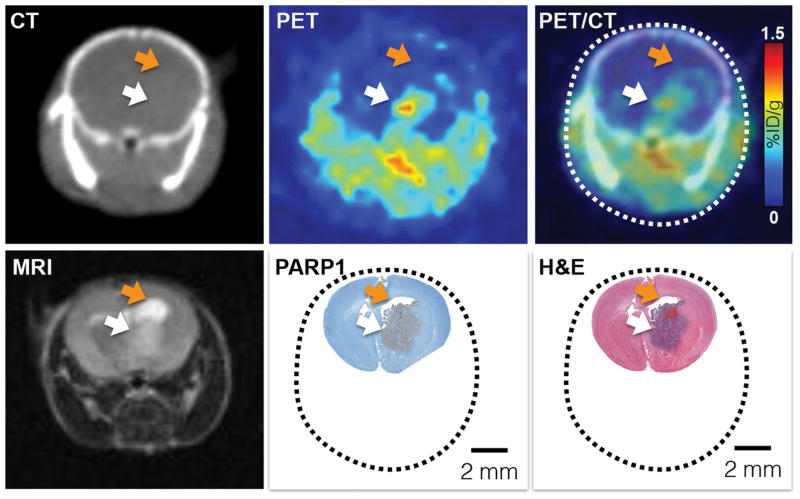
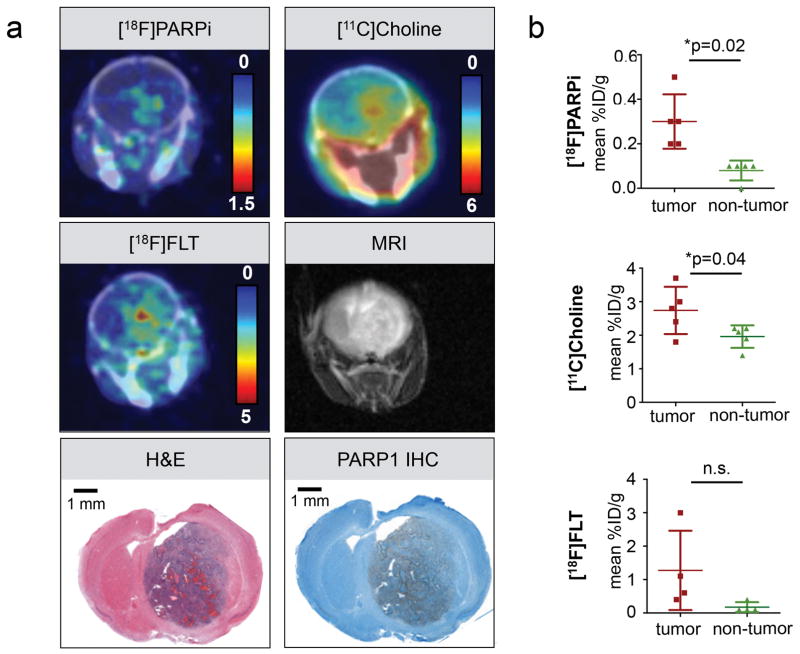
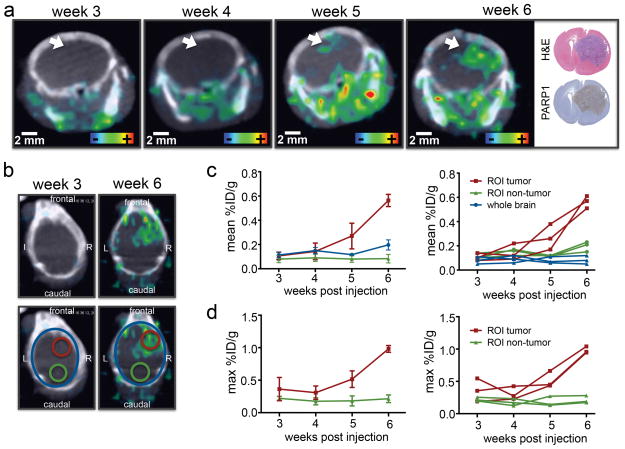
Diffuse intrinsic pontine glioma (DIPG) is a childhood brainstem tumor with a universally poor prognosis. Here, we characterize a positron emission tomography (PET) probe for imaging DIPG in vivo In human histological tissues, the probes target, PARP1, was highly expressed in DIPG compared to normal brain. PET imaging allowed for the sensitive detection of DIPG in a genetically engineered mouse model, and probe uptake correlated to histologically determined tumor infiltration. Imaging with the sister fluorescence agent revealed that uptake was confined to proliferating, PARP1-expressing cells. Comparison with other imaging technologies revealed remarkable accuracy of our biomarker approach. We subsequently demonstrated that serial imaging of DIPG in mouse models enables monitoring of tumor growth, as shown in modeling of tumor progression. Overall, this validated method for quantifying DIPG burden would serve useful in monitoring treatment response in early phase clinical trials. Cancer Res; 77(8); 2112-23. ©2017 AACR.


Conflict of interest statement

Competing financial interests. The authors declare no potential conflicts of interest.

Figures

Figure 1
Figure 1. PARP1 expression in human biospecimens of DIPG
(a) Immunohistochemical staining of DIPG biopsy tissue for PARP1 protein and H&E. From left to right: low magnification overview, viable tumor tissue, tumor area with microvascular proliferation (MVP), and necrosis (N). (b) PARP1 staining of a DIPG autopsy specimen shows strong infiltrative growth of PARP1-positive tumor cells into the dentate nucleus (first row), while PARP1 expression and cellular density in the frontal cortex of the same brain (second row) is low (H&E in Supplementary Fig. 1a). (c) Quantification of PARP1 in biopsy and (d) autopsy specimens based on histological staining (brown stained area (=PARP1) vs. whole tissue area). N=4 histopathologically confirmed cases of DIPG; n=1 DIPG autopsy brain.
Figure 2
Figure 2. PARP1 is overexpressed in RCAS-based murine DIPG mouse models
(a) Immunohistochemical staining of formalin-fixed, paraffin-embedded tumor-bearing brains following tumor generation in ntv-a/p53fl/fl mice injected with DF1 cells (transfected with RCAS-PDGFB, RCAS-Cre) in the brainstem at 2–4 days of age or right hemisphere at 4–6 weeks of age (Supplementary Fig. 1c). Anti-PARP1, anti-Ki67 (proliferation), and H&E staining for morphological evaluation were carried out on adjacent sections. (b) Quantification of PARP1 staining in juvenile and adult tumor-bearing mice in order to calculate the relative PARP1-positive area in relation to the entire tissue area. ROIs were placed on tumor (Tu) regions and anatomically defined brain regions (Co=cortex, Po=pons, Ce=cerebellum, Th=thalamus; n≥3 animals/4–7 ROIs per region; data represented as mean ± standard error). Statistical significance was determined using an unpaired Student’s t-test, corrected for multiple comparisons by the Holm-Sidak method with an alpha of 0.01. Automated analysis based on color thresholding was carried out using Metamorph Software. (c) Tumor-to-brain-area ratios are displayed as mean values ± standard error. N=4 animals for the juvenile brain; n=3 for the adult brain.
Figure 3
Figure 3. Intratumoral accumulation of PARPi-FL and [18F]PARPi in mouse model of DIPG after intravenous injection
(a) Juvenile brainstem tumor-bearing ntv-a/p53fl/fl mice were intravenously injected with 22.4 nmol PARPi-FL upon occurrence of symptoms of tumor growth (gait instability, weight loss, crouching, head swelling). Brains were processed for cryoconservation 2 h p.i. of PARPi-FL. Cryosections were co-stained with Hoechst DNA stain and evaluated for presence of PARPi-FL (green fluorescence) using confocal microscopy. Adjacent sections were stained for PARP1 expression and H&E. Representative staining from n=5. (b) High magnification images from (a) showing nuclear localization of PARPi-FL, Hoechst, and PARP1. (c) [18F]PARPi accumulation in DIPG and healthy control mice after intravenous injection. 150–170 μCi [18F]PARPi were injected in juvenile brainstem tumor-bearing ntv-a/p53fl/fl mice (n=4) or healthy ntv-a/p53fl/fl control mice (n=2). For autoradiography, animals were sacrificed 2 h p.i., brains were extracted and flash-frozen, and 20 μm coronal cryosections were cut. Sections were exposed to a storage phosphor autoradiography plate overnight at −20 °C and read the following day. Adjacent sections were submitted for H&E staining for morphological confirmation that activity hotspots represent tumor tissue. (d) For signal quantification, ROIs were placed on activity hotspots, tumor-adjacent brain, and corresponding sections in healthy brains (n=3–8 ROIs per specimen) and results were pooled. (e) To evaluate the difference between tumor-bearing and non-tumor-bearing brains, ROIs were placed over entire tumor-bearing cross-sections, independent of size and number of activity hotspots and intensities were compared to non-tumor-bearing brains. (f) Calculation of signal ratios using mean values of ROI categories; t=tumor, n=normal brain, ta=tumor adjacent, h=hotspot, s=section. Statistical significance was determined using an unpaired student’s t-test, assuming equal SD of populations.
Figure 4
Figure 4. Specificity of [18F]PARPi tumor uptake was confirmed by blocking with Olaparib
In vivo PET/CT imaging and quantification of [18F]PARPi in juvenile brainstem tumor-bearing mice (ntv-a/p53fl/fl mice injected with transfected DF1 cells RCAS-PDGFB and RCAS-Cre in the brainstem at 2–4 days of age). [18F]PARPi was intravenously injected in tumor-bearing (DIPG) or healthy mice (control); to control for specificity, 1 mg olaparib was injected 30 min prior to [18F]PARPi (Block) to occupy specific binding sites (n=3/group). After imaging, intracardiac perfusion with 4% PFA was carried out and brains were conserved for histology. (a) Representative PET/CT images of the brainstem region compared to H&E and PARP1 staining of the same animals. (b) Quantification of %ID/g of the entire brain was derived from the PET/CT data set using the CT as reference for creating VOIs. (c) Similarly, the %ID/g was analyzed for the brainstem region using the CT as reference for creating VOIs. Statistical significance was determined using an unpaired student’s t-test assuming equal SD. White arrow points at tumor location.
Figure 5
Figure 5. [18F]PARPi accurately delineates tumors in vivo
To evaluate the ability and quality of [18F]PARPi to delineate brain tumors in vivo, we compared [18F]PARPi PET/CT imaging to MRI and histology. First row (left to right): CT, PET, and PET/CT 1 h p.i. of [18F]PARPi. Second row (left to right): T2-weighted 1.05T MRI image, PARP1 IHC (brown staining) and H&E. All images are from the same animal. PET/CT and MRI were conducted on the same day and the animal was sacrificed immediately after MRI to preserve the brain for histology. White arrow indicates tumor location. Orange arrow points at an accumulation of cerebrospinal fluid (CSF), which causes a strong MRI signal, but is not seen in [18F]PARPi imaging.
Figure 6
Figure 6. Comparison of [18F]PARPi to [11C]Choline and [18F]FLT imaging
(a) Representative PET/CT images of the same tumor-bearing animal (adult model, right hemisphere) using [18F]PARPi (2 h p.i.), [11C]Choline (5 min p.i.), [18F]FLT (2 h p.i.), and MRI (T2 weighted) compared to PARP1 IHC and H&E histology. [18F]FLT and MRI were conducted 48 h after the [18F]PARPi and [11C]Choline imaging. (b) Quantification of the mean %ID/g of a VOI in the tumor area compared to a control area in the back region of the brain. Statistical significance was determined using a paired t-test.
Figure 7
Figure 7. Tumor growth monitoring is feasible using [18F]PARPi
(a) Tumor development was followed over the course of 6 weeks using ntv-a;p53fl/fl mice injected with DF1 cells in the right hemisphere at 4–6 weeks old (n=4 total, n=3 that showed tumor growth displayed in figure). In the displayed example the white arrow indicates tumor location. For weekly PET/CT imaging animals were injected with 100–200 μCi [18F]PARPi 2 h prior to PET/CT imaging. H&E and PARP1 histology were conducted after the last imaging time point. (b) To quantify uptake, VOIs were created in the tumor region and control region, using the PET/CT and histologically confirmed tumor location. These were then applied to earlier imaging time points. Mean (c) and max (d) %ID/g were quantified between week 3 and 6 post-tumor inoculation. One animal showed no tumor development and was histologically confirmed to have no tumor (Supplementary Fig. 7b).

Comment in

Similar articles

Cited by

References

    1. Kohler BA, Ward E, McCarthy BJ, Schymura MJ, Ries LA, Eheman C, et al. Annual report to the nation on the status of cancer, 1975–2007, featuring tumors of the brain and other nervous system. Journal of the National Cancer Institute. 2011;103:714–36. - PMC - PubMed
    1. Ostrom QT, Gittleman H, Fulop J, Liu M, Blanda R, Kromer C, et al. CBTRUS Statistical Report: Primary Brain and Central Nervous System Tumors Diagnosed in the United States in 2008–2012. Neuro-oncology. 2015;17(Suppl 4):iv1–iv62. - PMC - PubMed
    1. Smith MA, Seibel NL, Altekruse SF, Ries LA, Melbert DL, O’Leary M, et al. Outcomes for children and adolescents with cancer: challenges for the twenty-first century. Journal of clinical oncology : official journal of the American Society of Clinical Oncology. 2010;28:2625–34. - PMC - PubMed
    1. Patel S, Bhatnagar A, Wear C, Osiro S, Gabriel A, Kimball D, et al. Are pediatric brain tumors on the rise in the USA? Significant incidence and survival findings from the SEER database analysis. Child Nerv Syst. 2014;30:147–54. - PubMed
    1. Deorah S, Lynch CF, Sibenaller ZA, Ryken TC. Trends in brain cancer incidence and survival in the United States: Surveillance, Epidemiology, and End Results Program, 1973 to 2001. Neurosurgical focus. 2006;20:E1. - PubMed

Publication types

MeSH terms

LinkOut - more resources