. 2017 Jan 17;18(3):816-829.
doi: 10.1016/j.celrep.2016.12.069.

A Systems Approach Reveals MAVS Signaling in Myeloid Cells as Critical for Resistance to Ebola Virus in Murine Models of Infection

Affiliations

A Systems Approach Reveals MAVS Signaling in Myeloid Cells as Critical for Resistance to Ebola Virus in Murine Models of Infection

Mukta Dutta et al. Cell Rep. .

Abstract

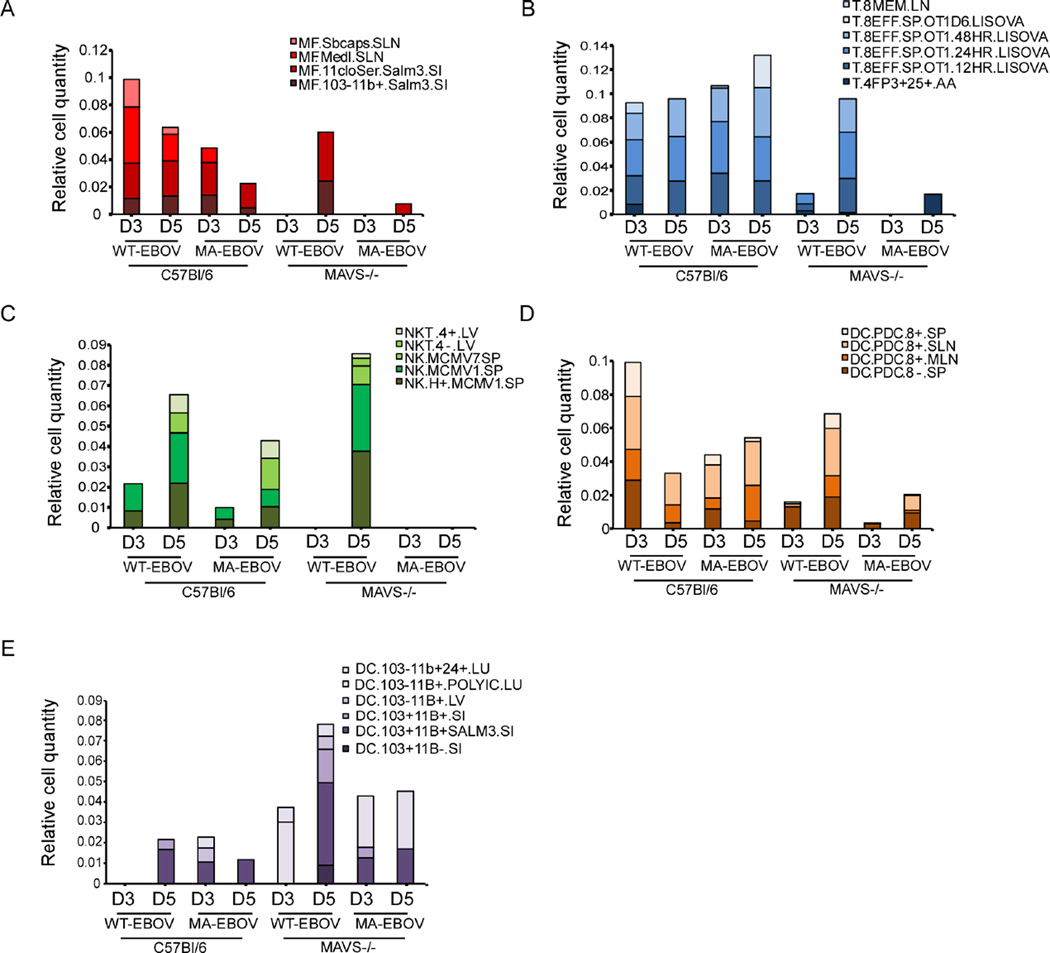
The unprecedented 2013-2016 outbreak of Ebola virus (EBOV) resulted in over 11,300 human deaths. Host resistance to RNA viruses requires RIG-I-like receptor (RLR) signaling through the adaptor protein, mitochondrial antiviral signaling protein (MAVS), but the role of RLR-MAVS in orchestrating anti-EBOV responses in vivo is not known. Here we apply a systems approach to MAVS-/- mice infected with either wild-type or mouse-adapted EBOV. MAVS controlled EBOV replication through the expression of IFNα, regulation of inflammatory responses in the spleen, and prevention of cell death in the liver, with macrophages implicated as a major cell type influencing host resistance. A dominant role for RLR signaling in macrophages was confirmed following conditional MAVS deletion in LysM+ myeloid cells. These findings reveal tissue-specific MAVS-dependent transcriptional pathways associated with resistance to EBOV, and they demonstrate that EBOV adaptation to cause disease in mice involves changes in two distinct events, RLR-MAVS antagonism and suppression of RLR-independent IFN-I responses.

Keywords: Ebola virus; MAVS; RLR; conditional; interferon; knockout; macrophages; mouse adapted.


Figures

Figure 1
Figure 1. MAVS is required for control of EBOV replication and resistance associated with production of IFNα
(A) Percent change in body weight following infection with WT-EBOV or MA-EBOV (mean ± SD). (B) Survival curves of C57Bl/6 or MAVS−/− mice infected with 100 ffu WT-EBOV or MA-EBOV. N=5 per group from 2 experiments. P value of Kaplan-Meier survival curve analysis is indicated. (C–D) Virus titer in spleen (C) and liver (D) from mice infected with WT-EBOV or MA-EBOV and euthanized at day 3 (D3) or day 5 (D5) post infection. Data is represented as mean ± SD from 3–5 mice per group from 2 experiments. ND, none detected. (E–F) IFNα or IFNβ concentrations in the sera of mice measured by ELISA (n=3–7 from 2 experiments performed). M, mock infected. *P<0.05, **P<0.01, ***P<0.001, ****P<0.0001 determined by one-way ANOVA with Dunnett’s multiple comparison test. Dashed line indicates limit of detection.
Figure 2
Figure 2. Global analysis of the transcriptional profile of WT-EBOV and MA-EBOV infections, see also Figure S1
(A) Multidimensional scaling (MDS) representation of the similarities in transcriptional profiles elicited by viral infection over time in liver. Each biological replicate is represented by shape denoting virus infection and color denoting mouse strain. The quality of the representation is provided by the Kruskal stress value, with a low percentage of Kruskal stress (15.02%) suggesting a faithful two-dimensional representation of global transcriptional differences between viral strains. (B) Most highly DEGs following virus infection relative to time-matched mocks in the liver. DEG cutoff was set to a fold change >1.5 and a q-value < 0.05 calculated using a moderated t test with subsequent Benjamini-Hochberg correction. The number of DEGs is indicated in each direction. (C) MDS representation and (D) DEGs in the spleen of the same animals depicted in (A) and (B). (E) Biofunction enrichment analysis of 4000 DEG in liver of MA-EBOV-infected MAVS−/− mice. Based on Fisher's exact test performed with IPA software, nonredundant biological functions with the top 10 enrichment scores (given by −log10 P values) or absolute activation Z-score values are shown. Bar graphs represent the activation z- scores for each biofunction (bar length) and the number of target genes associated with each biofunction.
Figure 3
Figure 3. EBOV VP40 antigen in liver of C57Bl/6 and MAVS−/− mice, see also Figure S2
The presence of EBOV VP40 was examined by immunohistochemistry in C57Bl/6 or MAVS−/− mice that were (A–B) mock infected (scale bars=100µm), (C–D) infected with WT-EBOV at 3 dpi, (E–F) infected with MA-EBOV at 3 dpi, (G–H) infected with WT-EBOV at 5 dpi, or (I–J) infected with MA-EBOV at 3dpi. Insets (scale bars=20µm) show greater detail of infected cells. In all conditions, endothelial (white arrowhead) and Kupffer cells (black arrowheads) contain viral antigen. In the absence of MAVS, hepatocytes (asterisk) also contain EBOV VP40. Data are representative of 5 mice examined from 2 experiments performed.
Figure 4
Figure 4. Canonical pathway analysis of DEGs, see also Figure S3
Canonical pathway enrichment analysis of DEGs in spleen in all infection conditions on (A) day 3 and (B) day 5 p.i. Canonical pathways with the top five enrichment scores (given by the −log10 P value) in at least one gene list are shown (based on Fisher's exact test, performed with IPA software). The size of each circle is proportional to the −log10 P value, and the color gradient represents the relative frequency of DEG compared to the total number of genes associated with each pathway. X's indicate that the respective pathway had no enrichment for the DEG list of interest. (C) Hierarchical clustering of DEG derived from the canonical pathways in Figure S3A between spleen from WT and KO infected mouse strains. Gene expression is shown as log10 (ratio) of EBOV-infected to strain-matched mock-infected mice. 60 DEGs whose expression was significantly induced over strain-matched mock-infected mice are depicted in the heat map (1.5 fold; P≤0.01). Clustering was performed using Pearson correlation. (D–E) MAVS−/− mice were administered neutralizing antibody to IFNα/β, IFNγ or both one day prior to infection with WT-EBOV and again at 2–3 dpi. Mice treated with anti-IFNγ antibody alone did not succumb to infection and so were administered a third dose of antibody or isotype control at 6 dpi to no effect. The percent change in body weight (mean ± SD) and the survival curves are shown for these mice (N=4–5 per group). P value of Kaplan-Meier survival curve analysis is indicated.
Figure 5
Figure 5. DCQ analysis of immune cell dynamics following EBOV infection and their dependence on MAVS signaling, see also Figure S4
Immune cell dynamics in infected spleen as predicted by digital cell quantifier (DCQ). Bar graphs show the relative cell quantities for macrophages (A), CD8 T cells (B), NK/NK T cells (C), pDCs (D), and conventional DCs (E) following EBOV infection at 3 or 5 dpi. Distinct colors have been assigned to each immune cell type from the Immgen compendium. Each cell type name is followed by the tissue from which it was previously isolated, abbreviated as follows: BL, blood; BM, bone marrow; LN, lymph nodes; SI, small intestine; PC, peritoneal cavity; SLN, subcutaneous LN; and SP, spleen.
Figure 6
Figure 6. MAVS expression specifically in monocytes/macrophages is required for resistance to infection with MA-EBOV
(A) Schematic depicting the generation of the MAVS locus with the open reading frame outlined by a black arrow. Exons (1–7) are shown in black boxes. Gray circles indicate the start (ATG) and termination codons (TGA). The insert shows the locations of the loxP sites flanking exon 3 (MAVSfl/fl) in the conditional allele. Cre-recombinase removes exon 3 as depicted in the deleted allele. (B) PCR genotyping of mouse tail DNA. A single primer set was designed to distinguish between the WT (300 bp) and floxed allele (379 bp). (C) Mean fluorescence intensity (MFI) of intracellular MAVS in immune cell types from the spleen of CD19-Cre MAVSfl/fl mice as determined by flow cytometry. One of two experiments is shown. (D) MFI of intracellular MAVS in immune cell types from the peritoneum of LysM-Cre MAVSfl/fl as determined by flow cytometry. (E) IFNβ mRNA expression in BMDM stimulated with LPS, poly I:C or infected with SeV. Expression of IFNβ mRNA was determined by qRT-PCR normalized to the house-keeping gene HRPT and expressed as fold change relative to unstimulated cells. Data is represented as mean ± SD from 3 mice (D–E). (F) Survival curves of MAVS−/−, Cre-MAVSfl/fl littermate controls, LysMCre+MAVSfl/fl, or CD19Cre+MAVSfl/fl mice infected IP with 100 ffu MA-EBOV. N=3–6 per group. P value of Kaplan-Meier survival curve analysis is labeled. (G) Titers of WT-EBOV or MA-EBOV following infection of BMM derived from C57Bl/6 or MAVS−/− mice. (H) IFNα or IFNβ protein in supernatants of BMM shown in (G). SeV infection was used as a positive control for IFN-I induction. Dashed line indicates limit of detection. *P<0.05, **P<0.01, ***P<0.001, ns, not significant.
Figure 7
Figure 7. Pathologic changes, EBOV VP40 antigen and active caspase 3 in the liver and spleen of MA-EBOV infected LysMCre- or LysMCre+ MAVSfl/fl mice at 5 dpi
Depletion of MAVS in LysM+ myeloid cells resulted in increased depletion of lymphocytes in the spleen (A,D) and increased necrosis of hepatocytes in the liver (G,J). These pathological changes were associated with increased VP40 antigen staining (B,E,H,K) and increased incidence of cleaved caspase 3 (C,F,I,L) in both spleen and lover. Arrows indicate increased cleaved caspase 3 in splenic follicles. Scale bar = 100µm or 20µm (insets).

Similar articles

Cited by

References

    1. Albarino CG, Wiggleton Guerrero L, Lo MK, Nichol ST, Towner JS. Development of a reverse genetics system to generate a recombinant Ebola virus Makona expressing a green fluorescent protein. Virology. 2015;484:259–264. - PubMed
    1. Bradfute SB, Braun DR, Shamblin JD, Geisbert JB, Paragas J, Garrison A, Hensley LE, Geisbert TW. Lymphocyte death in a mouse model of Ebola virus infection. J. Infect. Dis. 2007;196(Suppl 2):S296–S304. - PubMed
    1. Bradfute SB, Warfield KL, Bray M. Mouse models for filovirus infections. Viruses. 2012;4:1477–1508. - PMC - PubMed
    1. Bray M. The role of the Type I interferon response in the resistance of mice to filovirus infection. J. Gen. Virol. 2001;82:1365–1373. - PubMed
    1. Chakrabarti A, Banerjee S, Franchi L, Loo YM, Gale M, Jr, Nunez G, Silverman RH. RNase L activates the NLRP3 inflammasome during viral infections. Cell Host Microbe. 2015;17:466–477. - PMC - PubMed

MeSH terms

Substances