RNA Binding to CBP Stimulates Histone Acetylation and Transcription
- PMID: 28086087
- PMCID: PMC5325706
- DOI: 10.1016/j.cell.2016.12.020
RNA Binding to CBP Stimulates Histone Acetylation and Transcription
Abstract
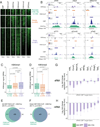
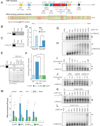
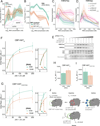
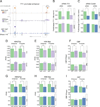
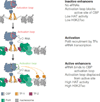
CBP/p300 are transcription co-activators whose binding is a signature of enhancers, cis-regulatory elements that control patterns of gene expression in multicellular organisms. Active enhancers produce bi-directional enhancer RNAs (eRNAs) and display CBP/p300-dependent histone acetylation. Here, we demonstrate that CBP binds directly to RNAs in vivo and in vitro. RNAs bound to CBP in vivo include a large number of eRNAs. Using steady-state histone acetyltransferase (HAT) assays, we show that an RNA binding region in the HAT domain of CBP-a regulatory motif unique to CBP/p300-allows RNA to stimulate CBP's HAT activity. At enhancers where CBP interacts with eRNAs, stimulation manifests in RNA-dependent changes in the histone acetylation mediated by CBP, such as H3K27ac, and by corresponding changes in gene expression. By interacting directly with CBP, eRNAs contribute to the unique chromatin structure at active enhancers, which, in turn, is required for regulation of target genes.
Keywords: CBP/p300; RNA-binding; acetyltransferase; chromatin modification; eRNA; enhancers; epigenetic enzymes; gene regulation; histone acetylation; non-coding RNA.
Copyright © 2017 Elsevier Inc. All rights reserved.
Figures


Similar articles
-
eRNA binding produces tailored CBP activity profiles to regulate gene expression.RNA Biol. 2017 Dec 2;14(12):1655-1659. doi: 10.1080/15476286.2017.1353862. Epub 2017 Sep 26. RNA Biol. 2017. PMID: 28891741 Free PMC article. Review.
-
Enhancer Activity Requires CBP/P300 Bromodomain-Dependent Histone H3K27 Acetylation.Cell Rep. 2018 Aug 14;24(7):1722-1729. doi: 10.1016/j.celrep.2018.07.041. Cell Rep. 2018. PMID: 30110629
-
Is histone acetylation the most important physiological function for CBP and p300?Aging (Albany NY). 2012 Apr;4(4):247-55. doi: 10.18632/aging.100453. Aging (Albany NY). 2012. PMID: 22511639 Free PMC article.
-
Enhancers are activated by p300/CBP activity-dependent PIC assembly, RNAPII recruitment, and pause release.Mol Cell. 2021 May 20;81(10):2166-2182.e6. doi: 10.1016/j.molcel.2021.03.008. Epub 2021 Mar 24. Mol Cell. 2021. PMID: 33765415
-
Genomic occupancy of the transcriptional co-activators p300 and CBP.Transcription. 2013 Jan-Feb;4(1):18-23. doi: 10.4161/trns.22601. Epub 2012 Nov 6. Transcription. 2013. PMID: 23131664 Free PMC article. Review.
Cited by
-
H3K27ac-induced lncRNA PAXIP1-AS1 promotes cell proliferation, migration, EMT and apoptosis in ovarian cancer by targeting miR-6744-5p/PCBP2 axis.J Ovarian Res. 2021 Jun 9;14(1):76. doi: 10.1186/s13048-021-00822-z. J Ovarian Res. 2021. Retraction in: J Ovarian Res. 2023 Dec 19;16(1):239. doi: 10.1186/s13048-023-01327-7. PMID: 34108034 Free PMC article. Retracted.
-
Enriched environment enhances histone acetylation of NMDA receptor in the hippocampus and improves cognitive dysfunction in aged mice.Neural Regen Res. 2020 Dec;15(12):2327-2334. doi: 10.4103/1673-5374.285005. Neural Regen Res. 2020. PMID: 32594057 Free PMC article.
-
Neuronal RNA processing: cross-talk between transcriptional regulation and RNA-binding proteins.Front Mol Neurosci. 2024 Aug 1;17:1426410. doi: 10.3389/fnmol.2024.1426410. eCollection 2024. Front Mol Neurosci. 2024. PMID: 39149613 Free PMC article. Review.
-
FTO mediates LINE1 m6A demethylation and chromatin regulation in mESCs and mouse development.Science. 2022 May 27;376(6596):968-973. doi: 10.1126/science.abe9582. Epub 2022 May 5. Science. 2022. PMID: 35511947 Free PMC article.
-
H3K27ac-activated EGFR-AS1 promotes cell growth in cervical cancer through ACTN4-mediated WNT pathway.Biol Direct. 2022 Jan 8;17(1):3. doi: 10.1186/s13062-021-00315-5. Biol Direct. 2022. PMID: 34998421 Free PMC article.
References
-
- Bailey TL, Elkan C. Fitting a mixture model by expectation maximization to discover motifs in biopolymers. Proc Int Conf Intell Syst Mol Biol. 1994;2:28–36. - PubMed
-
- Barlev NA, Liu L, Chehab NH, Mansfield K, Harris KG, Halazonetis TD, Berger SL. Acetylation of p53 activates transcription through recruitment of coactivators/histone acetyltransferases. Mol Cell. 2001;8:1243–1254. - PubMed
-
- Berndsen CE, Denu JM. Assays for mechanistic investigations of protein/histone acetyltransferases. Methods. 2005;36:321–331. - PubMed
MeSH terms
Substances
Grants and funding
LinkOut - more resources
Full Text Sources
Other Literature Sources
Molecular Biology Databases
Miscellaneous

