Adaptive resistance of melanoma cells to RAF inhibition via reversible induction of a slowly dividing de-differentiated state
- PMID: 28069687
- PMCID: PMC5248573
- DOI: 10.15252/msb.20166796
Adaptive resistance of melanoma cells to RAF inhibition via reversible induction of a slowly dividing de-differentiated state
Abstract
Treatment of BRAF-mutant melanomas with MAP kinase pathway inhibitors is paradigmatic of the promise of precision cancer therapy but also highlights problems with drug resistance that limit patient benefit. We use live-cell imaging, single-cell analysis, and molecular profiling to show that exposure of tumor cells to RAF/MEK inhibitors elicits a heterogeneous response in which some cells die, some arrest, and the remainder adapt to drug. Drug-adapted cells up-regulate markers of the neural crest (e.g., NGFR), a melanocyte precursor, and grow slowly. This phenotype is transiently stable, reverting to the drug-naïve state within 9 days of drug withdrawal. Transcriptional profiling of cell lines and human tumors implicates a c-Jun/ECM/FAK/Src cascade in de-differentiation in about one-third of cell lines studied; drug-induced changes in c-Jun and NGFR levels are also observed in xenograft and human tumors. Drugs targeting the c-Jun/ECM/FAK/Src cascade as well as BET bromodomain inhibitors increase the maximum effect (Emax) of RAF/MEK kinase inhibitors by promoting cell killing. Thus, analysis of reversible drug resistance at a single-cell level identifies signaling pathways and inhibitory drugs missed by assays that focus on cell populations.
Keywords: BRAFV600E melanomas; RAF and MEK inhibitors; adaptive and reversible drug resistance; de‐differentiated NGFRHigh state.
© 2017 The Authors. Published under the terms of the CC BY 4.0 license.
Figures

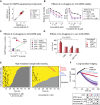
- A, B
Representative images and cell cycle phases (A) and representative maps of cell lineage (B) are depicted for COLO858 under DMSO and vemurafenib conditions.
- C
Single‐cell analysis of division and death events. Horizontal axes represent single‐cell tracks with time. Division events are displayed as black or pink (in the case of slowly cycling cells) dots. Transition from yellow to gray indicates cell death.
- D
Percentage of surviving and dead cells among cells tracked for 84 h.
- E
Percentage of division events among cells tracked during indicated time intervals.
- F
Length of different cell cycle phases (G0/G1 and S/G2) in cells tracked for 84 h. No data are reported for MMACSF‐vemurafenib because all cells stopped dividing ˜24 h after treatment and no single cell divided more than once.
- G
Division times for COLO858 cells tracked between days 4 and 8 post‐treatment with 1 μM vemurafenib. Minimum doubling times were estimated for 100 individual cells by identifying the longest time interval before or after which a cell divides.

p‐ERKT202/Y204 levels as measured in duplicate by immunofluorescence in COLO858 and MMACSF cells treated for 48 h with vemurafenib in combination with DMSO or trametinib at indicated doses.
p‐ERKT202/Y204 variation with time (24, 48, 72 h) in COLO858 cells treated in duplicate with vemurafenib at indicated doses.
Covariate single‐cell analysis of p‐RbS807/811 versus p‐ERK in COLO858 cells 72 h after exposure to indicated doses of vemurafenib. Vertical dashed lines were used to gate p‐RbHigh versus p‐RbLow cells.
Mean p‐ERK levels in p‐RbHigh versus p‐RbLow subpopulations of COLO858 cells treated in duplicate with indicated doses of vemurafenib for 72 h.

Schematic outline of a two‐stage drug treatment experiment to measure the impact of drug adaptation on the response of COLO858 and MMACSF cells to RAF/MEK inhibitors.
Viability of cells pre‐treated with DMSO, multiple doses of vemurafenib, or vemurafenib plus trametinib, and then treated with an additional 1 μM vemurafenib or vemurafenib plus trametinib (without change of media). Cell viability measured in four replicates was normalized to the viability of cells pre‐treated with DMSO. Data are presented as mean ± SD.

- A, B
Cells were pre‐treated for 24 h with DMSO or 0.1 μM vemurafenib and then treated with 0–5 μM vemurafenib for 72 h. Cell viability (normalized to the viability of cells pre‐treated and treated with DMSO) (A) and apoptotic fraction of cells (B) were measured in four replicates. Data are presented as mean ± SD.
- C, D
Sequential treatment and measurements were repeated as described in (A, B) using vemurafenib in combination with trametinib with 1:1 dose ratio.

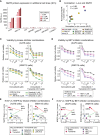
Differentially up‐regulated genes in COLO858 relative to MMACSF cells treated with 0.2 μM vemurafenib for 24 and 48 h (log2 (ratio) ≥ 1). Selected genes involved in neurogenesis, neural differentiation and myelination (red), cell adhesion, ECM remodeling and epithelial–mesenchymal transition (brown), and cell cycle regulation (blue) are highlighted.
Top Gene Ontology (GO) biological processes differentially regulated between COLO858 and MMACSF cells.
NGFR protein levels measured in duplicate by immunofluorescence in COLO858 and MMACSF cells treated with indicated doses of vemurafenib for 48 or 72 h. Data are presented as mean ± SD.
Covariate single‐cell analysis of Ki‐67 versus NGFR in COLO858 cells 24–72 h after exposure to 1 μM vemurafenib or DMSO.

- A
Schematic outline of an experiment involving induction of the slowly cycling NGFRHigh state in COLO858 cells following 48‐h treatment with 0.32 μM vemurafenib, sorting cells to obtain NGFRLow and NGFRHigh subpopulations, recovering each cell subpopulation in fresh growth medium for 1–9 days, and re‐inducing recovered cells with vemurafenib.
- B
NGFR and Ki‐67 protein levels measured by immunofluorescence in cells grown for 9 days in fresh medium (n = 4).
- C, D
Growth rate (GR) inhibition assay performed on FACS‐sorted NGFRHigh and NGFRLow pools of cells after 2 (C) or 9 (D) days of outgrowth in fresh medium. Measurements were performed in 4 (C) or 6 (D) replicates.
- E
Growth rate and doubling time measurements in 4 replicates in FACS‐sorted NGFRHigh and NGFRLow cells during 2–5 days of outgrowth in fresh medium.
- F
NGFR levels measured in duplicate by immunofluorescence in COLO858 cells recovered after 9 days of outgrowth in fresh media and subsequently re‐exposed for 48 h to four doses of vemurafenib.


- A, B
Top differentially regulated genes encoding secreted proteins (A) and cell surface receptors (B) between COLO858 and MMACSF cells.
- C
Ranked GSEA plots of top KEGG pathways significantly correlated with NGFR expression in 25 BRAF V600E melanoma cell lines from the CCLE (top) and tumor biopsies of 128 BRAF V600E melanoma patients in TCGA (bottom).
- D, E
A list of transcription factor candidates predicted (by DAVID; see Materials and Methods) to regulate differentially expressed genes between vemurafenib‐treated COLO858 and MMACSF cells (D), and the corresponding transcription factor gene expression levels in these cells (E).
- F
Quantified Western blot measurements (see Materials and Methods) for thrombospondin‐1 (THBS1; TSP‐1), integrin β1, and p‐FAKY397 in COLO858 and MMACSF cells treated for 48 h with indicated doses of vemurafenib. Data are first normalized to HSP90α/β levels in each cell line at each treatment condition and then to DMSO‐treated COLO858 cells.
- G
c‐Jun and p‐c‐JunS73 changes as measured in duplicate by immunofluorescence in COLO858 and MMACSF cells treated for 48 h with indicated doses of vemurafenib. Data are normalized to DMSO‐treated COLO858 cells.

A list of transcription factor candidates predicted to regulate differentially expressed receptors and secreted factors between vemurafenib‐treated COLO858 and MMACSF cells.
Western blotting for NGFR‐inducible COLO858 cells, NGFRHigh A375 and WM115 cells, and NGFRLow MMACSF and MZ7MEL cells, treated for 48 h with 0.2 or 1 μM vemurafenib or DMSO.
The effect of NGF at indicated concentrations on viability of COLO858 and MMACSF cells treated in duplicate with vemurafenib at indicated doses for 48 h. Data are presented as mean ± SD. Statistical significance was determined by two‐way ANOVA.

NGFR levels as measured by immunofluorescence (left panel) and relative cell viability (right panel) in COLO858 cells following treatment in duplicate with indicated doses of vemurafenib in the presence of siRNAs targeting JUN, PTK2, and NGFR for 72 h. Viability data for each siRNA condition at each dose of vemurafenib were normalized to cells treated with the same dose and the non‐targeting siRNA.
NGFR protein levels measured by immunofluorescence in duplicate in COLO858 cells treated for 48 h with indicated doses of vemurafenib, in combination with DMSO, MEK inhibitor trametinib (0.6 μM), FAK inhibitors defactinib (3 μM) and PF562271 (3 μM), JNK inhibitor JNK‐IN‐8 (3 μM), or Src inhibitors dasatinib (3 μM) and saracatinib (3 μM).
Pairwise comparison between drug combination‐induced changes in NGFR and Ki‐67 in COLO858 cells treated for 48 h with vemurafenib at 0.32 and 1 μM in combination with DMSO or two doses of trametinib (0.2, 0.6 μM), defactinib (1, 3 μM), PF562271 (1, 3 μM), dasatinib (1, 3 μM), saracatinib (1, 3 μM), and JNK‐IN‐8 (1, 3 μM). NGFR and Ki‐67 levels were measured by immunofluorescence. For each signal, data were averaged across two replicates, two doses of vemurafenib, and two doses of the second drug, log‐transformed, and z‐score‐scaled across seven different drug combinations.
Relative viability of COLO858 cells treated for 72 h with vemurafenib or vemurafenib plus trametinib (10:1 dose ratio) in combination with DMSO, JNK‐IN‐8, dasatinib, saracatinib, and defactinib at indicated doses. Viability data were measured in three replicates and normalized to DMSO‐treated controls.


COLO858 cells were treated for 48 h in duplicate with vemurafenib (at 0.32 μM) in combination with DMSO or three doses (0.11, 0.53, and 2.67 μM) of each of 41 compounds in a chromatin‐targeting library. NGFR protein levels were measured by immunofluorescence, averaged across three doses of each compound, and z‐scored.
Relative viability of COLO858 cells treated for 72 h with vemurafenib or vemurafenib plus trametinib (10:1 dose ratio) in combination with DMSO, (+)‐JQ1, I‐BET, and I‐BET151 at indicated doses. Viability data were measured in three replicates and normalized to DMSO‐treated controls.
Pairwise comparison between drug‐induced changes in NGFR and Ki‐67 in COLO858 cells treated with vemurafenib at 0.32, 1, and 3.2 μM in combination with DMSO or trametinib (0.2 μM), I‐BET (1 μM), I‐BET151 (1 μM), and (+)‐JQ1 (1 μM) for 48 h. Data for each drug combination were averaged across two replicates and three doses of vemurafenib, log‐transformed, and z‐score‐scaled.
c‐Jun protein levels measured by immunofluorescence in duplicate in COLO858 cells treated for 48 h with indicated doses of vemurafenib, in combination with DMSO, I‐BET (1 μM), (+)‐JQ1 (1 μM), and I‐BET151 (1 μM).
Single‐cell analysis of division and death events following live‐cell imaging of COLO858 cells treated with 1 μM vemurafenib in combination with DMSO or (+)‐JQ1 (0.32 μM) for 84 h. Data are presented as described in Figure 1.
Time‐lapse analysis of COLO858 cells treated in three replicates for ˜1 week with different drug combinations at indicated doses. Data for DMSO‐treated cells are shown until day 3, the time at which cells reach ˜100% confluency.


- A
NGFR protein levels measured in duplicate by immunofluorescence in seven BRAF V600E/D cell lines treated with vemurafenib at indicated doses for 48 h.
- B
Correlation between vemurafenib‐induced changes in c‐Jun and NGFR protein levels across nine BRAF V600E/D melanoma cell lines. Cells were treated with five doses of vemurafenib (0, 0.1, 0.32, 1, and 3.2 μM) for 48 h. c‐Jun and NGFR protein levels measured by immunofluorescence at each condition were averaged across two replicates and normalized to DMSO‐treated controls. The area under the dose–response curve (AUC) for the two measurements (c‐Jun and NGFR) was calculated, z‐score‐scaled across nine cell lines, and their pairwise Pearson's correlation was reported.
- C, D
Relative viability of A375 and WM115 cells treated in 3 replicates for 72 h with vemurafenib or vemurafenib plus trametinib (10:1 dose ratio) in combination with indicated kinase inhibitors (C) or BET inhibitors (D).
- E, F
Pairwise comparison between NGFR and Ki‐67 levels in A375 and WM115 cells treated with vemurafenib in combination with indicated kinase inhibitors (E) or BET inhibitors (F). Drug doses, time points, and data normalization are similar to Figs 7C and 8C.

Immunohistochemical analysis of vemurafenib‐naïve tumors from three melanoma patients stained for NGFR, MITF, and Ki‐67 (see Materials and Methods for patient clinical information).
Covariate single‐cell analysis of Ki‐67 versus NGFR measured by immunofluorescence in pre‐treatment, on‐treatment (with dabrafenib and trametinib combination for 2 weeks), and post‐relapse tumor biopsies of a BRAF‐mutant melanoma patient (see Materials and Methods for patient clinical information).
Cell population histograms representing c‐Jun variations measured by immunofluorescence in the same patient‐matched biopsies as shown in (B).
NGFR gene expression changes in 21 matched pairs of pre‐treatment and post‐resistance tumor biopsies analyzed by RNA sequencing. MITF changes are shown for tumors with a post‐resistance NGFR increase (increase = log2 (fold‐change) > 0.5, decrease = log2 (fold‐change) < −0.5, no change = |log2 (fold‐change)| ≤ 0.5). Gene expression data from patients treated with RAF inhibitor, MEK inhibitor, or their combination were analyzed by combining two published datasets (Sun et al, 2014; Hugo et al, 2015).
Ranked GSEA plots of top KEGG pathways significantly correlated with NGFR expression in 18 matched pairs of pre‐treatment and post‐resistance tumor biopsies (Hugo et al, 2015).

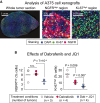
Immunofluorescence analysis of A375 melanoma xenograft tumors co‐stained for Ki‐67 and NGFR proteins. Selected images from a whole tumor section as well as NGFRHigh/Ki‐67Low and NGFRLow/Ki‐67High regions of a vehicle‐treated tumor are shown to highlight the spatial and cell‐to‐cell heterogeneity in Ki‐67 and NGFR protein expression.
Percentage of Ki‐67High and NGFRHigh cells in tumors treated for 5 days with dabrafenib (25 mg/kg) only, dabrafenib (25 mg/kg) in combination with JQ1 (50 mg/kg), or vehicle. Number of tumors (mice) analyzed per condition is shown. Solid horizontal lines represent the mean of measurements. Up to 50,000 individual cells per tumor were analyzed for NGFR and Ki‐67 intensities. Statistical significance was determined using two‐tailed two‐sample t‐test.
Similar articles
-
A Novel Plant Sesquiterpene Lactone Derivative, DETD-35, Suppresses BRAFV600E Mutant Melanoma Growth and Overcomes Acquired Vemurafenib Resistance in Mice.Mol Cancer Ther. 2016 Jun;15(6):1163-76. doi: 10.1158/1535-7163.MCT-15-0973. Epub 2016 Apr 5. Mol Cancer Ther. 2016. PMID: 27048951 Free PMC article.
-
Systematic analysis of BRAF(V600E) melanomas reveals a role for JNK/c-Jun pathway in adaptive resistance to drug-induced apoptosis.Mol Syst Biol. 2015 Mar 26;11(3):797. doi: 10.15252/msb.20145877. Mol Syst Biol. 2015. PMID: 25814555 Free PMC article.
-
Overcoming acquired BRAF inhibitor resistance in melanoma via targeted inhibition of Hsp90 with ganetespib.Mol Cancer Ther. 2014 Feb;13(2):353-63. doi: 10.1158/1535-7163.MCT-13-0481. Epub 2014 Jan 7. Mol Cancer Ther. 2014. PMID: 24398428
-
BRAF as a target for cancer therapy.Anticancer Agents Med Chem. 2011 Mar;11(3):285-95. doi: 10.2174/187152011795347469. Anticancer Agents Med Chem. 2011. PMID: 21426297 Review.
-
Drug tolerance to target therapy in melanoma revealed at single cell level: What next?Biochim Biophys Acta Rev Cancer. 2020 Dec;1874(2):188440. doi: 10.1016/j.bbcan.2020.188440. Epub 2020 Sep 29. Biochim Biophys Acta Rev Cancer. 2020. PMID: 33007433 Review.
Cited by
-
Overloading And unpacKing (OAK) - droplet-based combinatorial indexing for ultra-high throughput single-cell multiomic profiling.Nat Commun. 2024 Oct 23;15(1):9146. doi: 10.1038/s41467-024-53227-z. Nat Commun. 2024. PMID: 39443484 Free PMC article.
-
AP-1 Mediates Cellular Adaptation and Memory Formation During Therapy Resistance.bioRxiv [Preprint]. 2024 Jul 25:2024.07.25.604999. doi: 10.1101/2024.07.25.604999. bioRxiv. 2024. PMID: 39091739 Free PMC article. Preprint.
-
Chromatin assembly factor 1 suppresses epigenetic reprogramming toward adaptive drug resistance.J Natl Cancer Cent. 2021 Jan 16;1(1):15-22. doi: 10.1016/j.jncc.2020.12.003. eCollection 2021 Mar. J Natl Cancer Cent. 2021. PMID: 39036786 Free PMC article.
-
Purinergic Ca2+ Signaling as a Novel Mechanism of Drug Tolerance in BRAF-Mutant Melanoma.Cancers (Basel). 2024 Jun 30;16(13):2426. doi: 10.3390/cancers16132426. Cancers (Basel). 2024. PMID: 39001489 Free PMC article.
-
AMBRA1 levels predict resistance to MAPK inhibitors in melanoma.Proc Natl Acad Sci U S A. 2024 Jun 18;121(25):e2400566121. doi: 10.1073/pnas.2400566121. Epub 2024 Jun 13. Proc Natl Acad Sci U S A. 2024. PMID: 38870061
References
-
- Barretina J, Caponigro G, Stransky N, Venkatesan K, Margolin AA, Kim S, Wilson CJ, Lehar J, Kryukov GV, Sonkin D, Reddy A, Liu M, Murray L, Berger MF, Monahan JE, Morais P, Meltzer J, Korejwa A, Jane‐Valbuena J, Mapa FA et al (2012) The Cancer Cell Line Encyclopedia enables predictive modelling of anticancer drug sensitivity. Nature 483: 603–607 - PMC - PubMed
-
- Cohen AA, Geva‐Zatorsky N, Eden E, Frenkel‐Morgenstern M, Issaeva I, Sigal A, Milo R, Cohen‐Saidon C, Liron Y, Kam Z, Cohen L, Danon T, Perzov N, Alon U (2008) Dynamic proteomics of individual cancer cells in response to a drug. Science 322: 1511–1516 - PubMed
MeSH terms
Substances
Grants and funding
LinkOut - more resources
Full Text Sources
Other Literature Sources
Medical
Research Materials
Miscellaneous

