. 2016 Dec 13;24(6):848-862.
doi: 10.1016/j.cmet.2016.09.016. Epub 2016 Oct 27.

Hepatocyte TAZ/WWTR1 Promotes Inflammation and Fibrosis in Nonalcoholic Steatohepatitis

Affiliations

Hepatocyte TAZ/WWTR1 Promotes Inflammation and Fibrosis in Nonalcoholic Steatohepatitis

Xiaobo Wang et al. Cell Metab. .

Abstract

Nonalcoholic steatohepatitis (NASH) is a leading cause of liver disease worldwide. However, the molecular basis of how benign steatosis progresses to NASH is incompletely understood, which has limited the identification of therapeutic targets. Here we show that the transcription regulator TAZ (WWTR1) is markedly higher in hepatocytes in human and murine NASH liver than in normal or steatotic liver. Most importantly, silencing of hepatocyte TAZ in murine models of NASH prevented or reversed hepatic inflammation, hepatocyte death, and fibrosis, but not steatosis. Moreover, hepatocyte-targeted expression of TAZ in a model of steatosis promoted NASH features, including fibrosis. In vitro and in vivo mechanistic studies revealed that a key mechanism linking hepatocyte TAZ to NASH fibrosis is TAZ/TEA domain (TEAD)-mediated induction of Indian hedgehog (Ihh), a secretory factor that activates fibrogenic genes in hepatic stellate cells. In summary, TAZ represents a previously unrecognized factor that contributes to the critical process of steatosis-to-NASH progression.


Figures

Figure 1
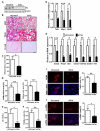
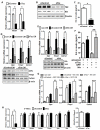
Figure 1. TAZ Levels are Increased in the Livers of Humans and Mice with NASH
(A) TAZ immunofluorescence (red) in normal, steatotic, and NASH human liver sections; DAPI counterstain for nuclei is shown in bottom panels. NASH-IgG refers to control for primary antibody. Bar, 100 μm. The data were quantified as percent TAZ+ cells relative to total liver cells (*p < 0.0001; mean ± SEM; n=7 specimens/group). (B) Immunoblots of TAZ in early NAFLD, normal, NASH, and steatotic human liver. For sake of comparison, samples #10-12 of NASH from the left blot were re-run with the steatosis samples in the right blot. β-actin was used as loading control. (C) Immunoblot of liver TAZ in mice fed chow or MCD diet, with β-actin as loading control. (D) Immunoblot of liver TAZ in mice fed chow or FPC diet, with β-actin as loading control. (E) Quantification of Wwtr1 (Taz) mRNA in livers from mice fed chow or FPC diet (*p < 0.0001; mean ± SEM; n=6 mice/group)
Figure 2
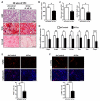
Figure 2. TAZ Silencing Reduces Liver Inflammation, Fibrosis, and Cell Death in FPC-Fed Mice
The following parameters were measured in male C57BL/6J mice treated with AAV8-H1-shTaz or control vector and then fed the FPC diet for 16 weeks (*p < 0.05, **p < 0.01, ***p < 0.0002, mean ± SEM; n=10 mice/group): (A) Immunoblot of TAZ in liver, with β-actin as loading control. (B) Staining of liver sections for H&E (upper panels; Bar, 100 μm), Masson’s trichrome (Trichr) (middle panels; Bar, 100 μm), and Sirius red (Sir red) (lower panels; Bar, 500 μm). (C) Hepatic inflammatory cells. (D) Aniline blue- and Sirius red-positive area. (E) Plasma ALT. (F) TUNEL+ cells. (G) mRNA levels of Tnfa, Mcp1, and F4/80 (Adgre1). (H) mRNA levels of the indicated genes related to fibrosis. (I) F4/80 immunofluorescence (red) and quantification; DAPI counterstain for nuclei is shown in bottom panels; Bar, 100 μm. (J) α-SMA immunofluorescence (red) and quantification; DAPI counterstain for nuclei is shown in bottom panels; Bar, 100 μm.
Figure 3
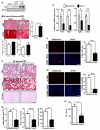
Figure 3. TAZ Silencing After the Development of NASH Reduces Liver Inflammation and Fibrosis in FPC-Fed Mice
The following parameters were measured in male C57BL/6J mice fed the FPC diet for 28 weeks, with AAV8-H1-shTaz or control vector administered at the 16-week time point (*p < 0.05; **p < 0.01, ***p < 0.0001, mean ± SEM; n=5 mice/group): (A) Staining of liver sections for H&E (upper panels; Bar, 100 μm), Masson’s trichrome (Trichr) (middle panels; Bar, 500 μm), and Sirius red (Sir red) (lower panels; Bar, 500 μm). (B) Hepatic inflammatory cells. (C) Aniline blue- and Sirius red-positive area. (D) mRNA levels of Mcp1, Acta2 (α-SMA), Col1a1, Col3a1, Des, Vim and Timp1. (E) F4/80 immunofluorescence (red) and quantification; DAPI counterstain for nuclei is shown in bottom panels; Bar, 500 μm. (F) α-SMA immunofluorescence (red) and quantification; DAPI counterstain for nuclei is shown in bottom panels; Bar, 500 μm.
Figure 4
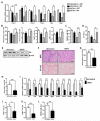
Figure 4. TAZ Silencing After the Development of Steatosis Reduces Liver Inflammation and Fibrosis in FPC-Fed Mice
(A) TAZ immunoblot of liver extracts from C57BL/6J mice fed chow or FPC diet for 8 or 16 weeks. (B) H&E- and Masson’s trichrome (Trich)-stained liver sections and quantified lipid droplet area, inflammatory cells, and aniline blue-positive area for C57BL/6J mice fed chow or FPC diet for 8 weeks. Bar, 100 μm. (C-H) The following parameters were measured in male C57BL/6J mice fed the FPC diet for 16 weeks, with AAV8-H1-shTaz or control vector administered at the 8-week time point (*p < 0.05; **p < 0.01, ***p < 0.0001, mean ± SEM; n=5 mice/group): (C) Staining of liver sections for H&E (upper panels; Bar, 100 μm), Masson’s trichrome (Trichr) (middle panels; Bar, 100 μm), and Sirius red (Sir red) (lower panels; Bar, 500 μm). (D) Aniline blue- and Sirius red-positive area and hepatic inflammatory cells. (E) mRNA levels of Tnfa, Mcp1, Tgfb1, and Acta2 (α-SMA). (F) F4/80 immunofluorescence (red) and quantification; DAPI counterstain for nuclei is shown in bottom panels; Bar, 100 μm. (G) α-SMA immunofluorescence (red) and quantification; DAPI counterstain for nuclei is shown in bottom panels; Bar, 100 μm. (H) Plasma ALT.
Figure 5
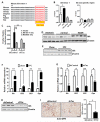
Figure 5. TAZ Induces Ihh, and TAZ Silencing Lowers the Expression of Pro-Fibrotic Hedgehog Pathway Genes in the Livers of FPC-Fed Mice
(A) Conserved TAZ/TEAD consensus sequence in intron 1 of the mouse Ihh gene. (B) Liver nuclear extracts from mice fed chow diet or FPC diet for 16 weeks with or without TAZ silencing were subjected to TAZ ChIP analysis using anti-TAZ or IgG control. The intronic region containing the TAZ/TEAD binding sequence, or a non-consensus sequence as control, was amplified by qPCR and normalized to the values obtained from input DNA (*p = 0.03; mean ± SEM; n=3). (C) A dual-luciferase reporter assay in control and TAZ-silenced AML12 cells was conducted using the Ihh intron 1 region in (B), or a mutated version, together with 500 bp of flanking upstream and downstream sequence. (**p < 0.01, ***p < 0.0001; mean ± SEM; n=6). (D) Immunoblot of Ihh in normal humam livers or those with steatosis or NASH. (E) Immunoblot of Ihh in the livers of mice fed chow or FPC diet for 16 weeks. (F) Relative expression of Ihh, Gli2, Gli3, and Opn mRNAs in the livers of mice fed chow or FPC diet for 16 weeks (*p < 0.04, **p < 0.0001; mean ± SEM; n=6). (G) Relative expression of Ihh, Gli2, Gli3, and Opn mRNAs in the livers of mice fed the FPC diet for 16 weeks with or without TAZ silencing (*p < 0.05, **p < 0.002; mean ± SEM; n=10). (H) Immunoblot of Ihh in the livers of mice fed the FPC diet for 16 weeks with or without TAZ silencing. (I) OPN immunohistochemistry and quantification in the livers of mice fed the FPC diet for 16 weeks with or without TAZ silencing (*p < 0.0001; mean ± SEM; n=10); Bar, 200 μm.
Figure 6
Figure 6. TAZ-Induced Hepatocyte Ihh Increases the Expression of Fibrosis-Related Genes in Hepatic Stellate Cells
(A) Expression of Wwtr1 and Ihh mRNA in control and TAZ-silenced AML12 cells (*p < 0.0003; mean ± SEM; n=3). (B) Immunoblot of TAZ and Ihh in control and TAZ-silenced AML12 cells. (C) Ihh concentrations, assayed by ELISA, in the media of control and TAZ-silenced AML12 cells (*p < 0.003; mean ± SEM; n=3). (D) Primary hepatic stellate cells (HSCs) were incubated for 72 h with conditioned medium (CM) obtained from control or Taz-silenced AML12 cells or with medium not exposed to cells (non-CM). The HSCs were then assayed for Opn, Timp1, and Col1a1 mRNA (upper panel; *p < 0.05; mean ± SEM; n=4) and the respective proteins by immunoblot (lower panel). (E) HSCs were incubated for 72 h with non-CM or CM obtained from control or Ihh-silenced AML12 cells and then assayed for Opn, Timp1, and Col1a1 mRNA (*p < 0.04; **p < 0.0001, mean ± SEM; n=4). Immunoblot of Ihh and TAZ in siIhh-treated and control AML12 cells is shown below the graph. (F) Control or Taz-silenced AML12 cells that were transduced with a plasmid encoding Ihh or control GFP. Aliquots of the four sets of conditioned medium were assayed for Ihh by ELISA (*p < 0.002; mean ± SEM; n=3). (G) HSCs were incubated with conditioned media from the 4 sets of cells in (F) or with non-CM and then assayed for Opn, Timp1, and Col1a1 mRNA (*p < 0.05; **p < 0.004, ***p < 0.0004, mean ± SEM; n=4). Note that bars 2 and 3 for Opn and Col1a1 are significantly different at p < 0.05. (H) Primary HSCs were activated by culturing for 72 h in medium containing 10% FBS and then treated with siControl or siTaz duplex, followed by culturing in the same medium for an additional 48 h. The cells were then assayed for Wwtr1, Acta2, Col1a1, Col4a1, Timp1, Opn, and Des mRNAs or cell proliferation. For the proliferation assay, the cells were synchronized by overnight culture in medium containing 0.2% FBS and then cultured an additional 48 h in medium containing 10% FBS. The cells were incubated with WST-1, and absorbance at 440 nm was measured to assess cell number.
Figure 7
Figure 7. Ihh Restoration in Taz-Silenced FPC-Fed Mice Promotes NASH Features, and Ihh Silencing Reduces NASH Features
(A-D) The following parameters were measured in male C57BL/6J mice treated with AAV8-H1-shTaz or control vector and then overexpressed Ihh or GFP by AAV8 vector, fed the FPC diet for 16 weeks (*p < 0.05, **p < 0.01, mean ± SEM; n=6 mice/group): (A) mRNA levels of Wwtr1, Ihh, Col1a1, Timp1, Opn, and Mcp1. (B) Quantification of inflammatory cells, Sirius red positive area, F4/80+ cells, and α-SMA+ area. (C) TUNEL+ cells. (D) Plasma ALT. (E-L) The following parameters were measured in male C57BL/6J mice treated with AAV8-H1-shIhh or control vector and then fed the FPC diet for 16 weeks (*p < 0.05, **p < 0.01, ***p < 0.0001, mean ± SEM; n=5 mice/group): (E) Immunoblot of Ihh, with β-actin as loading control. (F) Staining of liver sections for H&E (upper panels; Bar, 500 μm) and Sirius red (Sir red) (lower panels; Bar, 500 μm). (G) Hepatic inflammatory cells. (H) Sirius red-positive area. (I) mRNA levels of the indicated genes related to inflammation and fibrosis. (J) F4/80+ cells. (K) α-SMA+ area. (L) TUNEL+ cells.

Comment in

Similar articles

Cited by

References

    1. Abdelmalek MF, Suzuki A, Guy C, Unalp-Arida A, Colvin R, Johnson RJ, Diehl AM, Nonalcoholic Steatohepatitis Clinical Research, N. Increased fructose consumption is associated with fibrosis severity in patients with nonalcoholic fatty liver disease. Hepatology. 2010;51:1961–1971. - PMC - PubMed
    1. Angulo P, Kleiner DE, Dam-Larsen S, Adams LA, Bjornsson ES, Charatcharoenwitthaya P, Mills PR, Keach JC, Lafferty HD, Stahler A, et al. Liver Fibrosis, but No Other Histologic Features, Is Associated With Long-term Outcomes of Patients With Nonalcoholic Fatty Liver Disease. Gastroenterology. 2015a;149:389–397. e310. - PMC - PubMed
    1. Angulo P, Machado MV, Diehl AM. Fibrosis in nonalcoholic Fatty liver disease: mechanisms and clinical implications. Semin Liver Dis. 2015b;35:132–145. - PubMed
    1. Bataller R, Schwabe RF, Choi YH, Yang L, Paik YH, Lindquist J, Qian T, Schoonhoven R, Hagedorn CH, Lemasters JJ, et al. NADPH oxidase signal transduces angiotensin II in hepatic stellate cells and is critical in hepatic fibrosis. J Clin Invest. 2003;112:1383–1394. - PMC - PubMed
    1. Bertero T, Cottrill KA, Annis S, Bhat B, Gochuico BR, Osorio JC, Rosas I, Haley KJ, Corey KE, Chung RT, et al. A YAP/TAZ-miR-130/301 molecular circuit exerts systems-level control of fibrosis in a network of human diseases and physiologic conditions. Sci Rep. 2015;5:18277. - PMC - PubMed

MeSH terms

Substances