Saturated palmitic acid induces myocardial inflammatory injuries through direct binding to TLR4 accessory protein MD2
- PMID: 28045026
- PMCID: PMC5216130
- DOI: 10.1038/ncomms13997
Saturated palmitic acid induces myocardial inflammatory injuries through direct binding to TLR4 accessory protein MD2
Erratum in
-
Author Correction: Saturated palmitic acid induces myocardial inflammatory injuries through direct binding to TLR4 accessory protein MD2.Nat Commun. 2018 Mar 19;9:16185. doi: 10.1038/ncomms16185. Nat Commun. 2018. PMID: 29553572 Free PMC article.
Abstract
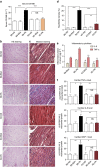
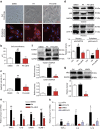
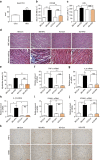
Obesity increases the risk for a number of diseases including cardiovascular diseases and type 2 diabetes. Excess saturated fatty acids (SFAs) in obesity play a significant role in cardiovascular diseases by activating innate immunity responses. However, the mechanisms by which SFAs activate the innate immune system are not fully known. Here we report that palmitic acid (PA), the most abundant circulating SFA, induces myocardial inflammatory injury through the Toll-like receptor 4 (TLR4) accessory protein MD2 in mouse and cell culture experimental models. Md2 knockout mice are protected against PA- and high-fat diet-induced myocardial injury. Studies of cell surface binding, cell-free protein-protein interactions and molecular docking simulations indicate that PA directly binds to MD2, supporting a mechanism by which PA activates TLR4 and downstream inflammatory responses. We conclude that PA is a crucial contributor to obesity-associated myocardial injury, which is likely regulated via its direct binding to MD2.
Conflict of interest statement
The authors declare no competing financial interests.
Figures


Similar articles
-
Arachidonic acid inhibits inflammatory responses by binding to myeloid differentiation factor-2 (MD2) and preventing MD2/toll-like receptor 4 signaling activation.Biochim Biophys Acta Mol Basis Dis. 2020 May 1;1866(5):165683. doi: 10.1016/j.bbadis.2020.165683. Epub 2020 Jan 14. Biochim Biophys Acta Mol Basis Dis. 2020. PMID: 31953218
-
Blockade of myeloid differentiation protein 2 prevents obesity-induced inflammation and nephropathy.J Cell Mol Med. 2017 Dec;21(12):3776-3786. doi: 10.1111/jcmm.13287. Epub 2017 Aug 2. J Cell Mol Med. 2017. PMID: 28767204 Free PMC article.
-
MD2 Blockage Protects Obesity-Induced Vascular Remodeling via Activating AMPK/Nrf2.Obesity (Silver Spring). 2017 Sep;25(9):1532-1539. doi: 10.1002/oby.21916. Epub 2017 Jul 20. Obesity (Silver Spring). 2017. PMID: 28726347
-
Recent progress in the discovery of myeloid differentiation 2 (MD2) modulators for inflammatory diseases.Drug Discov Today. 2018 Jun;23(6):1187-1202. doi: 10.1016/j.drudis.2018.01.015. Epub 2018 Jan 9. Drug Discov Today. 2018. PMID: 29330126 Review.
-
Toll-like receptor 4 (TLR4) inhibitors: Current research and prospective.Eur J Med Chem. 2022 May 5;235:114291. doi: 10.1016/j.ejmech.2022.114291. Epub 2022 Mar 15. Eur J Med Chem. 2022. PMID: 35307617 Review.
Cited by
-
Cardioprotective Effects of Aconite in Isoproterenol-Induced Myocardial Infarction in Rats.Oxid Med Cell Longev. 2022 Dec 26;2022:1090893. doi: 10.1155/2022/1090893. eCollection 2022. Oxid Med Cell Longev. 2022. PMID: 36600948 Free PMC article.
-
Downregulation of MALAT1 alleviates saturated fatty acid-induced myocardial inflammatory injury via the miR-26a/HMGB1/TLR4/NF-κB axis.Diabetes Metab Syndr Obes. 2019 May 7;12:655-665. doi: 10.2147/DMSO.S203151. eCollection 2019. Diabetes Metab Syndr Obes. 2019. PMID: 31123414 Free PMC article.
-
Protein Palmitoylation and Its Role in Bacterial and Viral Infections.Front Immunol. 2018 Jan 19;8:2003. doi: 10.3389/fimmu.2017.02003. eCollection 2017. Front Immunol. 2018. PMID: 29403483 Free PMC article. Review.
-
The Impacts of Animal-Based Diets in Cardiovascular Disease Development: A Cellular and Physiological Overview.J Cardiovasc Dev Dis. 2023 Jun 30;10(7):282. doi: 10.3390/jcdd10070282. J Cardiovasc Dev Dis. 2023. PMID: 37504538 Free PMC article. Review.
-
Decoding the secrets of longevity: unraveling nutraceutical and miRNA-Mediated aging pathways and therapeutic strategies.Front Aging. 2024 Mar 28;5:1373741. doi: 10.3389/fragi.2024.1373741. eCollection 2024. Front Aging. 2024. PMID: 38605867 Free PMC article. Review.
References
-
- Smith K. B. & Smith M. S. Obesity statistics. Prim. Care 43, 121–135ix (2016). - PubMed
-
- Poirier P. & Eckel R. H. in Hurst’s The Heart (eds Fuster V. et al..) (McGraw-Hill Companies, 2000).
Publication types
MeSH terms
Substances
LinkOut - more resources
Full Text Sources
Other Literature Sources
Medical
Molecular Biology Databases

