Regression of Glioblastoma after Chimeric Antigen Receptor T-Cell Therapy
- PMID: 28029927
- PMCID: PMC5390684
- DOI: 10.1056/NEJMoa1610497
Regression of Glioblastoma after Chimeric Antigen Receptor T-Cell Therapy
Abstract
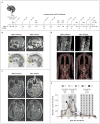
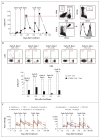
A patient with recurrent multifocal glioblastoma received chimeric antigen receptor (CAR)-engineered T cells targeting the tumor-associated antigen interleukin-13 receptor alpha 2 (IL13Rα2). Multiple infusions of CAR T cells were administered over 220 days through two intracranial delivery routes - infusions into the resected tumor cavity followed by infusions into the ventricular system. Intracranial infusions of IL13Rα2-targeted CAR T cells were not associated with any toxic effects of grade 3 or higher. After CAR T-cell treatment, regression of all intracranial and spinal tumors was observed, along with corresponding increases in levels of cytokines and immune cells in the cerebrospinal fluid. This clinical response continued for 7.5 months after the initiation of CAR T-cell therapy. (Funded by Gateway for Cancer Research and others; ClinicalTrials.gov number, NCT02208362 .).
Figures


Comment in
-
Targeting Glioblastoma with CAR T Cells.Cancer Discov. 2017 Mar;7(3):238-239. doi: 10.1158/2159-8290.CD-NB2017-007. Epub 2017 Jan 20. Cancer Discov. 2017. PMID: 28108463
-
Use of Chimeric Antigen Receptor T Cells as a Potential Therapeutic for Glioblastoma.Neurosurgery. 2017 May 1;80(5):N33-N34. doi: 10.1093/neuros/nyx105. Neurosurgery. 2017. PMID: 28586488 No abstract available.
-
Adoptive T cell therapy for solid tumors: current landscape and future challenges.Front Immunol. 2024 Mar 14;15:1352805. doi: 10.3389/fimmu.2024.1352805. eCollection 2024. Front Immunol. 2024. PMID: 38550594 Free PMC article. Review.
Similar articles
-
Bioactivity and Safety of IL13Rα2-Redirected Chimeric Antigen Receptor CD8+ T Cells in Patients with Recurrent Glioblastoma.Clin Cancer Res. 2015 Sep 15;21(18):4062-72. doi: 10.1158/1078-0432.CCR-15-0428. Epub 2015 Jun 9. Clin Cancer Res. 2015. PMID: 26059190 Free PMC article. Clinical Trial.
-
Optimization of IL13Rα2-Targeted Chimeric Antigen Receptor T Cells for Improved Anti-tumor Efficacy against Glioblastoma.Mol Ther. 2018 Jan 3;26(1):31-44. doi: 10.1016/j.ymthe.2017.10.002. Epub 2017 Oct 5. Mol Ther. 2018. PMID: 29103912 Free PMC article.
-
Transgenic Expression of IL15 Improves Antiglioma Activity of IL13Rα2-CAR T Cells but Results in Antigen Loss Variants.Cancer Immunol Res. 2017 Jul;5(7):571-581. doi: 10.1158/2326-6066.CIR-16-0376. Epub 2017 May 26. Cancer Immunol Res. 2017. PMID: 28550091 Free PMC article.
-
Current progress in chimeric antigen receptor T cell therapy for glioblastoma multiforme.Cancer Med. 2021 Aug;10(15):5019-5030. doi: 10.1002/cam4.4064. Epub 2021 Jun 19. Cancer Med. 2021. PMID: 34145792 Free PMC article. Review.
-
Chimeric Antigen Receptor T-Cell Therapy in Glioblastoma: Current and Future.Front Immunol. 2020 Nov 3;11:594271. doi: 10.3389/fimmu.2020.594271. eCollection 2020. Front Immunol. 2020. PMID: 33224149 Free PMC article. Review.
Cited by
-
Hypoxic glioma-derived exosomes promote M2-like macrophage polarization by enhancing autophagy induction.Cell Death Dis. 2021 Apr 7;12(4):373. doi: 10.1038/s41419-021-03664-1. Cell Death Dis. 2021. PMID: 33828078 Free PMC article.
-
Phase I clinical trials in adoptive T-cell therapies.J R Stat Soc Ser C Appl Stat. 2021 Aug;70(4):815-834. doi: 10.1111/rssc.12485. Epub 2021 Mar 29. J R Stat Soc Ser C Appl Stat. 2021. PMID: 36017232 Free PMC article.
-
Allogeneic Natural Killer and Cytomegalovirus (CMV)-pp65 Pulsed Dendritic Cells Induced Complete Response Through 15 Months in a Patient with Recurrent Glioblastoma: A Case Study.Am J Case Rep. 2021 Mar 31;22:e931030. doi: 10.12659/AJCR.931030. Am J Case Rep. 2021. Retraction in: Am J Case Rep. 2022 Jul 05;23:e937680. doi: 10.12659/AJCR.937680 PMID: 33788825 Free PMC article. Retracted.
-
Emerging immunotherapies for malignant glioma: from immunogenomics to cell therapy.Neuro Oncol. 2020 Oct 14;22(10):1425-1438. doi: 10.1093/neuonc/noaa154. Neuro Oncol. 2020. PMID: 32615600 Free PMC article. Review.
-
Obstacles and Coping Strategies of CAR-T Cell Immunotherapy in Solid Tumors.Front Immunol. 2021 May 19;12:687822. doi: 10.3389/fimmu.2021.687822. eCollection 2021. Front Immunol. 2021. PMID: 34093592 Free PMC article. Review.
References
-
- Kahlon KS, Brown C, Cooper LJ, Raubitschek A, Forman SJ, Jensen MC. Specific recognition and killing of glioblastoma multiforme by interleukin 13-zetakine redirected cytolytic T cells. Cancer Res. 2004;64:9160–6. - PubMed
-
- Debinski W, Gibo DM, Hulet SW, Connor JR, Gillespie GY. Receptor for interleukin 13 is a marker and therapeutic target for human high-grade gliomas. Clin Cancer Res. 1999;5:985–90. - PubMed
Publication types
MeSH terms
Substances
Associated data
Grants and funding
LinkOut - more resources
Full Text Sources
Other Literature Sources
