An RNA-binding atypical tropomyosin recruits kinesin-1 dynamically to oskar mRNPs
- PMID: 28028052
- PMCID: PMC5286366
- DOI: 10.15252/embj.201696038
An RNA-binding atypical tropomyosin recruits kinesin-1 dynamically to oskar mRNPs
Abstract
Localization and local translation of oskar mRNA at the posterior pole of the Drosophila oocyte directs abdominal patterning and germline formation in the embryo. The process requires recruitment and precise regulation of motor proteins to form transport-competent mRNPs. We show that the posterior-targeting kinesin-1 is loaded upon nuclear export of oskar mRNPs, prior to their dynein-dependent transport from the nurse cells into the oocyte. We demonstrate that kinesin-1 recruitment requires the DmTropomyosin1-I/C isoform, an atypical RNA-binding tropomyosin that binds directly to dimerizing oskar 3'UTRs. Finally, we show that a small but dynamically changing subset of oskar mRNPs gets loaded with inactive kinesin-1 and that the motor is activated during mid-oogenesis by the functionalized spliced oskar RNA localization element. This inefficient, dynamic recruitment of Khc decoupled from cargo-dependent motor activation constitutes an optimized, coordinated mechanism of mRNP transport, by minimizing interference with other cargo-transport processes and between the cargo-associated dynein and kinesin-1.
Keywords: RNA binding protein; active transport; atypical tropomyosin isoform; molecular motor; oocyte.
© 2016 European Molecular Biology Laboratory. Published under the terms of the CC BY 4.0 license.
Figures
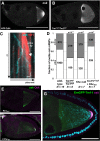
- A, B
Localization of oskar mRNA in wild‐type (A) and Tm1 eg9/Tm1 eg9 (B) egg‐chambers.
- C
Kymograph of oskMS2‐GFP mRNPs (cyan) travelling along polarity‐marked MTs (red, EB1 protein) in an ex vivo ooplasmic preparation. White dashed arrow shows the growing plus tip of the MT. Scale bars represent 1 s and 1 μm, respectively.
- D
Distribution of oskMS2‐GFP mRNP runs towards plus (white) and minus ends (grey). Numbers within the bars indicate the number of runs. P‐value of chi‐squared test against wild type is indicated above each bar.
- E, F
oskar mRNA (green) and Oskar protein (magenta) distribution in Tm1 eg1/Tm1 eg9 egg‐chambers expressing oskarMS2(6x) (E) or oskarMS2(6x) and Khc401–MCP (F).
- G
oskar mRNA (magenta) distribution in Tm1 eg1/Tm1 eg9 egg‐chambers rescued with EmGFP‐Tm1‐I (green).
- A
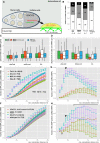
Schematic of ex vivo ooplasmic preparation imaged with TIRF microscopy.
- B
Distribution of oskMS2‐GFP mRNP runs towards plus (white) and minus ends (grey). Black boxes indicate the fraction of RNP runs to which no polarity could be assigned (n.d.). Numbers within the bars indicate the number of runs.
- C, D
Speed (C) and displacement (D) of oskMS2‐GFP mRNP runs towards plus and minus ends of MTs. Bars indicate wild‐type (green), Tm1 eg1/Tm1 eg9 (orange), Khc‐null (white) and Tm1 eg1/Tm1 eg9 + Khc401 ooplasms (light blue), from left to right. The parameters are statistically not different from those determined in the wild‐type control (P > 0.05), with exception of the plus‐end‐directed transport length observed in Tm1 eg1/Tm1 eg9 extracts (*P = 1.4 × 10⁻⁴, pairwise Mann–Whitney U‐test). Runs of undetermined polarity were excluded from testing. Number of runs analysed is indicated in panel (B). The bottom and the top of the box represent the first and third quartiles, the thick horizontal lines indicate the data median. Whiskers show the data range excluding outliers, which are represented by dots.
- E, F
Observed (points) and estimated random (coloured ribbons) colocalization of oskMS2‐mCherry mRNPs with different GFP fusion proteins (E) in different ooplasms (F) as a function of colocalization window size. MCP indicates MCP‐EGFP which, like MCP‐mCherry, can bind to MS2 loops. Numbers indicate the number of particle clusters (160 mRNPs in each) and the number of preparations (in brackets) analysed.
- G, H
Difference between the observed and estimated random colocalization values. Horizontal black line above the graphs indicates the clipping point and regime when random colocalization dominates the difference values (H). For comparison of colocalization levels, the data points lying midway between zero distance and the onset of the random dominated regime (clipping point) were selected (at 200 nm, indicated by arrowheads). 0 indicates that colocalization values observed in Tm1 eg1/Tm1 eg9‐mutant ooplasms using 100‐nm colocalization window are not different from zero (P > 0.05, one‐sample t‐test).
- A–B″
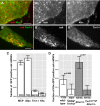
Colocalization of oskMS2‐mCherry (red, A, B) (A′, B′) with Khc‐EGFP (green, A) (A′) or with EmGFP‐Tm1‐I (green B) (B′) in ex vivo ooplasmic preparations. Scale bars represent 5 μm.
- C
Fraction of oskMS2‐MCP‐mCherry mRNPs located non‐randomly within a 200 nm distance of one of the indicated GFP‐tagged protein particles in ex vivo ooplasmic preparations. MCP indicates MCP‐EGFP which, like MCP‐mCherry, can bind to MS2 loops. Staufen (Stau) is a dsRNA binding protein and bona fide partner of oskar mRNA (St Johnston et al, 1991, 1992). All values are significantly different from zero (P < 10−3, one‐sample t‐test).
- D
Fraction of oskMS2‐mCherry mRNPs colocalizing (max. 200 nm) non‐randomly with Khc‐EGFP particles in wild‐type and Tm1 eg1/Tm1 eg9 ooplasms in the presence of two (white) or one (grey) copy of endogenous Khc.
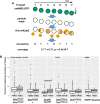
Schematics of temporal colocalization. oskarMS2 mRNPs were tracked in a manually assisted way. The mRNP particle outlines during a trajectory were used as a mask to measure the fluorescence of the fluorescently tagged protein molecules (e.g. Khc‐mKate2). The measured mean signal intensities of the assayed protein were compared to a threshold during every frame of the trajectory to determine colocalization of the protein of interest and the tracked mRNP (occupancy). These threshold values were determined as the lower 10th percentile of the mean signal intensity distribution of all observed assayed protein “particles” (not exclusively those under the mask) in heterozygous extracts. None of the threshold values of a given protein molecule determined in individual extracts differed by more than 10% of their mean. The mean threshold value was used for a given protein both for hetero‐ and homozygous extracts. The sum of the occupancies divided by the total number of frames in the trajectory defined a single coverage value, which is plotted in Fig 3C–E. The probability of random occurrence of a coverage sequence was determined by calculating the corresponding frequency of a binominal distribution (Pr). As a “success probability in each trial” (P) measure, we used the estimated random colocalization values of each protein observed at ˜250 nm max distance, since the particle masks had an average diameter of 250 nm: for Khc‐mKate2, mCherry‐Tm1 and GFP‐Staufen, these P‐values were 0.132, 0.077 and 0.08, respectively. We scored a colocalization event as highly confident when the calculated Pr value was smaller than 0.01 and the coverage was ≥ 0.5. The fraction of these events is indicated above the boxplots in Fig 3C–E.
Duration of motile (white) and non‐motile (grey) oskar mRNP trajectories. To avoid bias during the determination of high‐confidence association, a population of non‐motile RNPs was selected whose duration did not differ significantly (P > 0.05, pairwise Mann–Whitney U‐test) from that of the corresponding motile RNP population. The Tm1 eg1/Tm1 eg9 data were an exception, as in this case we observed a significant difference between the duration of motile and non‐motile trajectories; however, there was no significant difference between the Khc coverage of the two motility categories (P = 0.023, Fig 3C). Frame duration (temporal resolution) is indicated above the boxplots. Numbers below the boxplots indicate the number of trajectories and the number of ooplasms (in brackets) analysed. The bottom and the top of the box represent the first and third quartiles, the thick horizontal lines indicate the data median. Whiskers show the data range excluding outliers, which are represented by dots.
- A, B
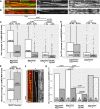
Kymographs of oskMS2‐GFP mRNPs (green) associated with Khc‐mKate2 (A, red) and mCherry‐Tm1‐I/C (B, red) ex vivo. Arrows indicate motile RNPs in stable complex with Khc (A) or Tm1‐I/C (B), and the arrowheads point to non‐motile oskMS2‐RNPs showing no obvious accumulation of the tagged protein. Note that mCherry‐Tm1‐I was exposed twice as long as Khc‐mKate to obtain comparable red fluorescence signals. Scale bars represent 1 μm and 1 s, respectively.
- C–E
Relative Khc‐mKate2 (C), mCherry‐Tm1‐I/C (D) and GFP‐Staufen (E) coverage of motile (white) and non‐motile (grey) oskMS2‐GFP trajectories. Numbers within the boxes indicate the number of trajectories and the number of ooplasms (in brackets) analysed. Percentages above the plots show the fraction of RNPs that were found stably and reliably associating with the indicated protein (for at least half of the duration of the trajectory, P < 0.01, binominal distribution; see also Fig EV2B). P‐values of pairwise Mann–Whitney U‐tests are indicated above the boxplots. The bottom and the top of the box represent the first and third quartiles, the thick horizontal lines indicate the data median. Whiskers show the data range excluding outliers, which are represented by dots.
- F
Example kymograph of Khc molecules (red) associating with an oskMS2‐GFP mRNP (green) before and during its run. White arrowheads indicate two association events, and yellow arrow indicates the onset of motility. Scale bars represent 5 μm and 1 s, respectively.
- G
Frequency of Khc‐mKate2 appearance on motile (white), before (motility‐primed, checked) and after (dotted) the onset of motility, and non‐motile (grey) oskMS2‐GFP trajectories. Fractions within the bars indicate the number of association events that lasted longer than a single frame over the total number of frames analysed. Indicated P‐values show results of pairwise Fisher's exact test. The Khc association frequency observed on RNPs before (checked) and during (dotted) their motility is not significantly different from wild‐type motile RNP controls (P > 0.01).

- A
Western blots of oskar mRNP components (Staufen, Bruno and Y14) and motor‐associated proteins (Khc, BicD, Dic) co‐immunoprecipitated with EmGFP‐Tm1‐I from ovarian lysates. Protein marker bands and their molecular weight in kDa are indicated.
- B
Signal developed with oligo(dT)25–Texas Red probes on GFP‐Trap_M beads binding EmGFP‐Tm1‐I or FlagMycGFP after denaturing washes. 594 nm reflection marks bead boundaries. Scale bars represent 5 μm.
- B′
Quantification of mean oligo(dT) signal measured on beads. P‐value of a pairwise Mann–Whitney U‐test is indicated. The bottom and the top of the box represent the first and third quartiles, the thick horizontal lines indicate the data median. Whiskers show the data range excluding outliers, which are represented by dots.
- C
qRT–PCR of EmGFP‐Tm1‐I and control Flag‐Myc‐GFP and bead alone (w 1118) bound oskar and gapdh RNAs after stringent washes (mean ± s.e.m., N = 3, two‐sample t‐test).
- D
Images of beads binding to EmGFP‐Tm1‐I (green) and DIG‐labelled in vitro‐transcribed RNA fragments (magenta). Scale bars represent 5 μm.
- E, F
Mean DIG‐Cy5 fluorescence measured on beads capturing the RNA fragment, with or without UV cross‐linking, indicated below the charts. P‐values of pairwise Mann–Whitney U‐tests are indicated. In panel (F), none of the non‐cross‐linked samples differ significantly from the no‐RNA control (P > 0.05). Numbers below the plots indicate the number of beads analysed. The bottom and the top of the box represent the first and third quartiles, the thick horizontal lines indicate the data median. Whiskers show the data range excluding outliers, which are represented by dots.
- A–C
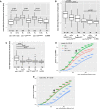
Mean DIG‐Cy5 fluorescence of GFP‐Trap_M beads in the presence of the indicated RNA fragments with and without UV cross‐linking. In the case of the FlagMycGFP negative control (B) and the truncated, non‐binding oskar 3′UTR fragments (C), non‐cross‐linking conditions were not tested. P‐values of pairwise Mann–Whitney U‐tests are indicated. Numbers indicate the number of beads analysed. The bottom and the top of the box represent the first and third quartiles, the thick horizontal lines indicate the data median. Whiskers show the data range excluding outliers, which are represented by dots.
- D, E
Observed (points) and estimated random (coloured ribbons) colocalization of oskar mRNPs with Khc‐mKate2 (green) or EmGFP‐Tm1‐I (red) or with both fusion proteins (blue) in wild‐type oocytes (C) and nurse cells (D). Arrows indicate the maximal colocalization distance (250 nm) chosen to analyse oskar mRNP composition in Fig 5F–I. The expected value of independent interaction was calculated by taking the difference of the products of observed individual colocalizations (Khc or Tm1‐I) and of expected individual colocalizations. Numbers indicate the number of particle clusters (100 oskar mRNPs in each) and the number of egg‐chambers (in brackets) analysed. Error bars represent 95% confidence intervals.

- A–C′
Confocal image of a Tm1 eg9 homozygous egg‐chamber expressing EmGFP‐Tm1‐I (green) and Khc‐mKate2 (magenta). oskar mRNA labelled with osk1‐5 FIT probes (Hovelmann et al, 2014) is in yellow. (B′, C′) oskar mRNPs colocalizing with both EmGFP‐Tm1‐I and Khc‐mKate2. Colours indicate the maximal colocalization distance (C′). Panels (B–C′) represent the boxed regions in panel (A).
- D, E
Localization of Khc‐mKate2 (green) and oskar mRNA (magenta) in wild‐type and Tm1 gs‐mutant nurse cells.
- F, G
Fraction of oskar mRNPs colocalizing with Khc‐mKate (dark grey), EmGFP‐Tm1‐I (white) or both of these proteins (light grey) in the oocyte (F) or in the nurse cells (G) (max. colocalization distance is 250 nm). None of the values are significantly different from each other (one‐way ANOVA, P > 10−3). Horizontal dashed lines indicate the expected value of observing both proteins in an oskar mRNP if the interactions are independent (see Fig EV3C and D). Significance of the observed colocalization values versus the expected values is shown (one‐sample t‐test). Data obtained from nurse cells and oocytes were compared with pairwise t‐test.
- H
Fraction of oskar mRNPs colocalizing with Khc‐mKate in wild‐type and Tm1 gs‐mutant nurse cells when half or all Khc molecules are labelled (as indicated above the graph). P‐values of pairwise t‐tests are indicated.
- I
Fraction of oskar mRNPs colocalizing with free mCherry in wild‐type nurse cells used as negative control. The measured fraction (˜1.6%) is significantly different from zero (one‐sample t‐test). All other measured colocalization values are significantly different from this negative control (P < 0.001, one‐way ANOVA).
- A–A″
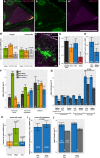
Confocal image of a wild‐type egg‐chamber expressing GFP‐Mago (green, A′) and mKate2‐Tm1‐I (magenta, A”). oskar mRNA labelled with osk1‐5 FIT probes is in yellow.
- B
Fraction of oskar mRNPs colocalizing with GFP‐Mago (green), mKate2‐Tm1‐I (orange), or both of these proteins (light grey) in the oocyte or in the nurse cells (max. colocalization distance is 250 nm). Horizontal dashed lines indicate the expected value of observing both protein in an oskar mRNP if the interactions are independent (see legend to Fig EV3D and E). Significance of the observed colocalization values versus the expected values is shown. In the nurse cells, GFP‐Mago and mKate2‐Tm1‐I appear to be independent (P > α = 0.001, one‐sample t‐test), whereas in the oocyte the presence of the two proteins on oskar mRNPs appears to anti‐correlate.
- C, C′
Example confocal (C) and gated STED image (C′) of EmGFP‐Tm1‐I‐expressing nurse cells. EmGFP‐Tm1‐I is in magenta, and oskar mRNA is in green.
- D
Difference between observed and estimated random colocalization of oskar mRNPs with oskMS2(10x)‐MCP‐GFP (black), EmGFP‐Tm1‐I (orange), Khc‐EGFP (blue) and Ketel‐GFP (importin‐β, red) in STED images. At 100 nm maximal distance, oskar mRNPs barely colocalize with the negative control Ketel‐GFP (P = 0.012, one‐sample t‐test versus zero). All other colocalization values are significantly different from that observed for Ketel‐GFP (P < 0.005, two‐sample t‐test).
- E
Fraction of Khc‐EGFP‐positive oskar RNPs in the indicated nurse cells. P‐values of two‐sample t‐tests against wild type are indicated.
- F, G
Mean density of detected oskar mRNA (dark grey), GFP‐Mago (green), mKate2‐Tm1‐I (orange) and Khc‐mKate2 (blue) in the nurse cell nuclei, cytoplasm and the ooplasm (F) and in the nurse cells under the conditions tested (G). All values are significantly different from zero (P < 0.05, one‐sample t‐test). Khc is considered to be a ubiquitous cytoplasmic protein, and therefore, we took its nuclear density as an estimate of the errors of the analysis (e.g. false positive recognition and uncertainties during definition of the nucleo‐cytoplasmic border). All other nuclear density values are significantly different from that of Khc‐mKate2 (F, P < 0.05, two‐sample t‐test). None of the Khc‐mKate2 and oskar mRNA density values are significantly different in the appropriate pairwise comparisons (G, P > 0.05). Numbers in the bars show the number of samples analysed.
- H
Fraction of nuclear oskar mRNPs colocalizing with mKate2‐Tm1‐I (orange), GFP‐Mago (green) or Khc‐mKate2 (blue). The observed Tm1‐I/C‐ or Khc‐positive mRNPs are not different from zero (P‐values of one‐sample t‐tests are indicated, α = 0.01).
- I
Fraction of Khc‐mKate2‐positive oskar mRNPs containing the full‐length mRNA (wild type) or only the oskar 3′UTR in the nurse cells. oskar mRNA was detected using a set of 15 singly labelled probes against the oskar 3′UTR.
- J
Mean density of the detected Khc‐mKate2 (blue) and mRNPs labelled by the oskar 3′UTR probe set (grey) in the nurse cells (N = 5 each).
- A–C
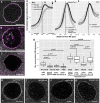
Localization of EmGFP‐Tm1‐I (A), oskar mRNA (B) and Khc (C) around the nurse cell nuclear envelope (magenta, WGA staining).
- D–F
Mean distribution profile of Khc (D) mKate2‐Tm1‐I, EmGFP‐Tm1‐I (E) and oskar mRNA (F) around the NE of nurse cells (marked with a dotted vertical line). Genotypes are indicated as follows: wild‐type control with solid black line (D–F), oskar RNA null with solid grey line (D, E) and Tm1 eg9/Tm1 eg9 with dotted black line (D, F). Lines indicate mean and 95% confidence intervals. We analysed the accumulation of mKate2‐Tm1‐I instead of EmGFP‐Tm1‐I due to unexpected GFP expression from the oskar 0 allele.
- G
Khc accumulation around the NE. To calculate accumulation, the signal intensity measured at the position of the peak observed in the wild‐type control (D, arrowhead, 356 ± 17.6 nm away from NE) was divided by the signal intensity 2 s.d. away (D, arrow, at 356 + 2*410 nm). P‐values of pairwise Mann–Whitney U‐tests against wild‐type control or Tm1 gs rescued with EmGFP‐Tm1‐I are indicated above the boxplots. Numbers indicate the number of nuclei and the number of egg‐chambers (in brackets) analysed. The bottom and the top of the box represent the first and third quartiles, the thick horizontal lines indicate the data median. Whiskers show the data range excluding outliers, which are represented by dots.
- H–K
Khc accumulation around the NE of nurse cells over‐expressing EmGFP‐Tm1‐I within Tm1 eg9/Tm1 eg9 (H), and oskar RNA‐null egg‐chambers (I) expressing either the oskar 3′UTR (J) or oskar Δi(1,2,3) (K).
- A
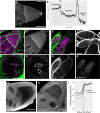
Localization of EmGFP‐Tm1‐I expressed within the female germline.
- B
Intensity profile of EmGFP‐Tm1‐I along the dashed arrow in (A). Cellular compartments are indicated above the curve. The non‐EmGFP‐Tm1‐I‐expressing follicle cells serve as a background reference.
- C–D′
Localization of mCherry‐Tm1 (magenta) relative to actin (green) within egg‐chambers. (D and D′) High‐magnification imaging of nurse cells reveals dim actin fibres surrounding the nuclei. However, mCherry‐Tm1 puncta do not appear to co‐align with these fibres. An infolding of the NE (D′, arrows) appears as an enrichment of mCherry‐Tm1 and actin inside the nucleus.
- E, F
Immunostaining of EmGFP‐Tm1‐I‐expressing (E–E″) and wild‐type (F) PFA‐fixed egg‐chambers with pan‐Tm1 antibody. The Tm1 antibody staining (green) shows a signal distribution similar to that of EmGFP‐Tm1‐I (magenta) within oocytes; however, Tm1‐I localization around the nurse cell NE is barely recognizable in PFA‐fixed mid‐oogenetic egg‐chambers (E′ and F).
- G–I
In heat‐fixed specimen, on the other hand, we could detect a faint perinuclear accumulation of the pan‐Tm1 antibody signal in wild‐type (G) but not in Tm1 gs‐mutant (H) stage 8–10 nurse cells. The subtle accumulation we could quantify (I: Nwt = 23, NTm1gs = 18). Lines indicate mean and 95% confidence intervals.
- A–E
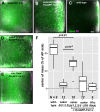
Mean oskar mRNA distribution (green, detected by conventional FISH) within oocytes in which oskar mRNA is substituted by oskar Δi(1,2,3) mRNA (A, B) and oskar 3′UTR mRNA (D) and (in addition) over‐express EmGFP‐Tm1‐I (B, D and E). Wild‐type control (C) and oocytes expressing Khc RNAi and EmGFP‐Tm1‐I (E). Magenta indicates standard deviation of the distribution of oskar mRNA. Scale bar is 10% of total oocyte length (C).
- F
Position of the oskar mRNA centre of mass relative to the geometric centre of the oocyte (dotted horizontal line) along the anteroposterior (AP) axis. Posterior pole is the top of the chart. P‐values of pairwise Mann–Whitney U‐tests are indicated. Numbers indicate the number of oocytes analysed. The bottom and the top of the box represent the first and third quartiles, the thick horizontal lines indicate the data median. Whiskers show the data range excluding outliers, which are represented by dots.
Similar articles
-
Assembly of endogenous oskar mRNA particles for motor-dependent transport in the Drosophila oocyte.Cell. 2009 Nov 25;139(5):983-98. doi: 10.1016/j.cell.2009.10.012. Cell. 2009. Retraction in: Cell. 2010 Oct 29;143(3):485. doi: 10.1016/j.cell.2010.10.011 PMID: 19945381 Retracted.
-
A new isoform of Drosophila non-muscle Tropomyosin 1 interacts with Kinesin-1 and functions in oskar mRNA localization.J Cell Sci. 2016 Nov 15;129(22):4252-4264. doi: 10.1242/jcs.194332. Epub 2016 Oct 17. J Cell Sci. 2016. PMID: 27802167 Free PMC article.
-
Dynein associates with oskar mRNPs and is required for their efficient net plus-end localization in Drosophila oocytes.PLoS One. 2013 Nov 11;8(11):e80605. doi: 10.1371/journal.pone.0080605. eCollection 2013. PLoS One. 2013. PMID: 24244700 Free PMC article.
-
Kinesin-1 captures RNA cargo in its adaptable coils.Genes Dev. 2021 Jul 1;35(13-14):937-939. doi: 10.1101/gad.348691.121. Genes Dev. 2021. PMID: 34210804 Free PMC article. Review.
-
Axis formation during Drosophila oogenesis.Curr Opin Genet Dev. 2001 Aug;11(4):374-83. doi: 10.1016/s0959-437x(00)00207-0. Curr Opin Genet Dev. 2001. PMID: 11448623 Review.
Cited by
-
Organizing the oocyte: RNA localization meets phase separation.Curr Top Dev Biol. 2020;140:87-118. doi: 10.1016/bs.ctdb.2020.02.007. Epub 2020 Mar 9. Curr Top Dev Biol. 2020. PMID: 32591084 Free PMC article.
-
Ex vivo Ooplasmic Extract from Developing Drosophila Oocytes for Quantitative TIRF Microscopy Analysis.Bio Protoc. 2017 Jul 5;7(13):e2380. doi: 10.21769/BioProtoc.2380. Bio Protoc. 2017. PMID: 28798946 Free PMC article.
-
Transiently structured head domains control intermediate filament assembly.Proc Natl Acad Sci U S A. 2021 Feb 23;118(8):e2022121118. doi: 10.1073/pnas.2022121118. Proc Natl Acad Sci U S A. 2021. PMID: 33593918 Free PMC article.
-
Subcellular Specialization and Organelle Behavior in Germ Cells.Genetics. 2018 Jan;208(1):19-51. doi: 10.1534/genetics.117.300184. Genetics. 2018. PMID: 29301947 Free PMC article. Review.
-
Kinesin-1 patterns Par-1 and Rho signaling at the cortex of syncytial embryos of Drosophila.J Cell Biol. 2024 Jan 1;223(1):e202206013. doi: 10.1083/jcb.202206013. Epub 2023 Nov 13. J Cell Biol. 2024. PMID: 37955925 Free PMC article.
References
-
- Castello A, Fischer B, Eichelbaum K, Horos R, Beckmann BM, Strein C, Davey NE, Humphreys DT, Preiss T, Steinmetz LM, Krijgsveld J, Hentze MW (2012) Insights into RNA biology from an atlas of mammalian mRNA‐binding proteins. Cell 149: 1393–1406 - PubMed
-
- Chekulaeva M, Hentze MW, Ephrussi A (2006) Bruno acts as a dual repressor of oskar translation, promoting mRNA oligomerization and formation of silencing particles. Cell 124: 521–533 - PubMed
MeSH terms
Substances
Grants and funding
LinkOut - more resources
Full Text Sources
Other Literature Sources
Molecular Biology Databases

