

ATXN2 trinucleotide repeat length correlates with risk of ALS
- PMID: 28017481
- PMCID: PMC5302215
- DOI: 10.1016/j.neurobiolaging.2016.11.010
ATXN2 trinucleotide repeat length correlates with risk of ALS
Abstract
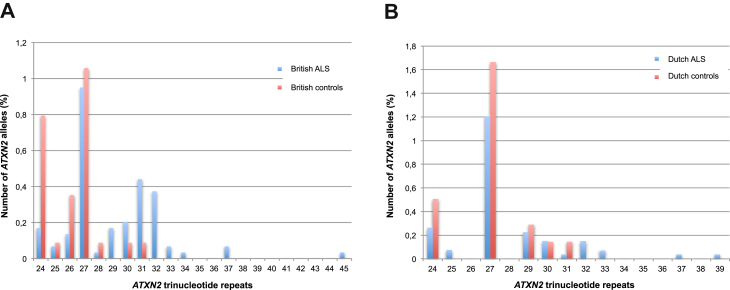
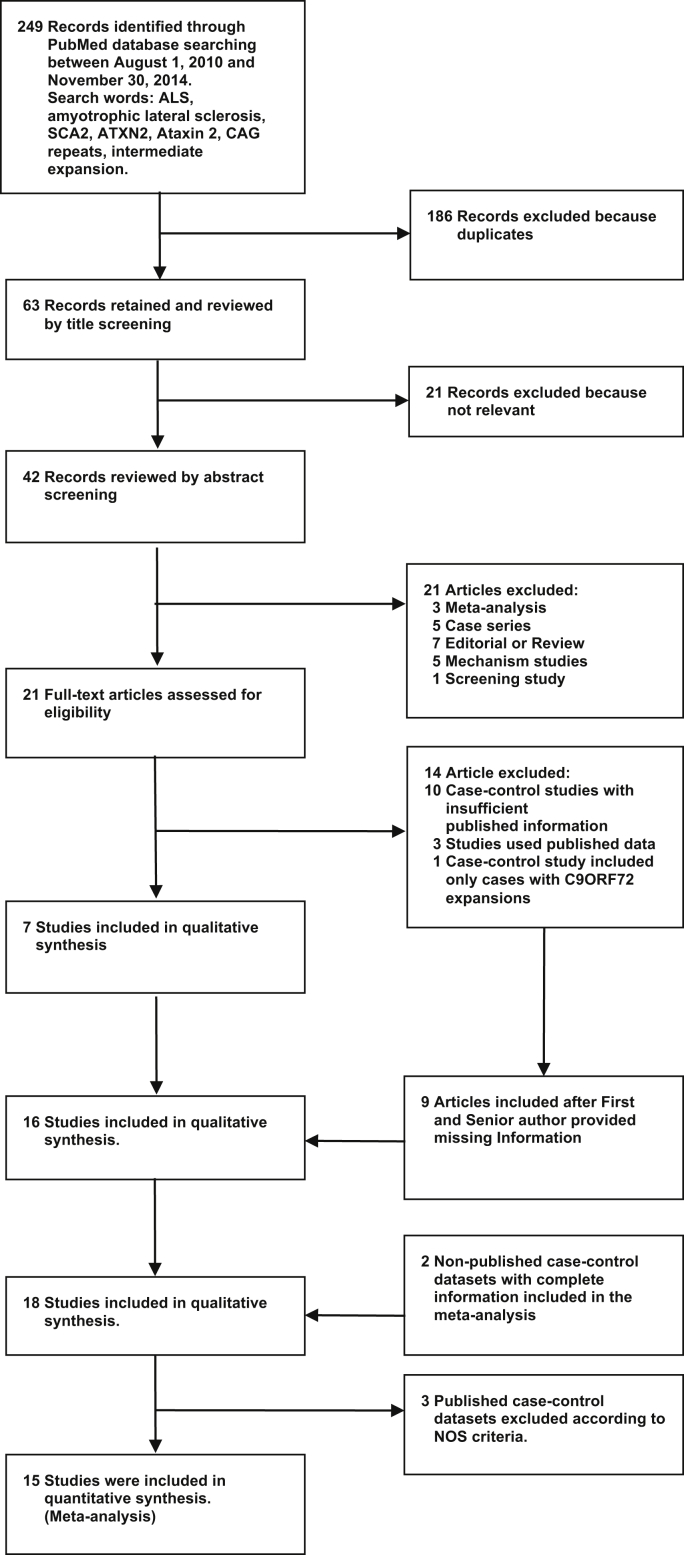
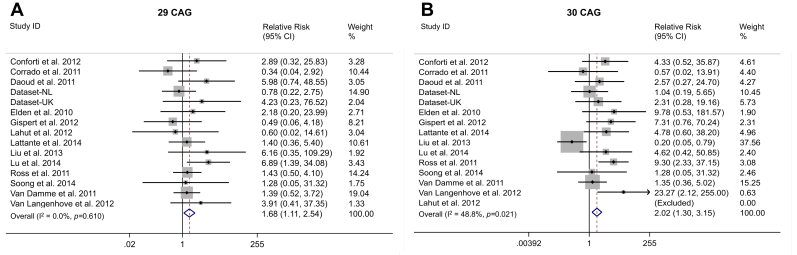
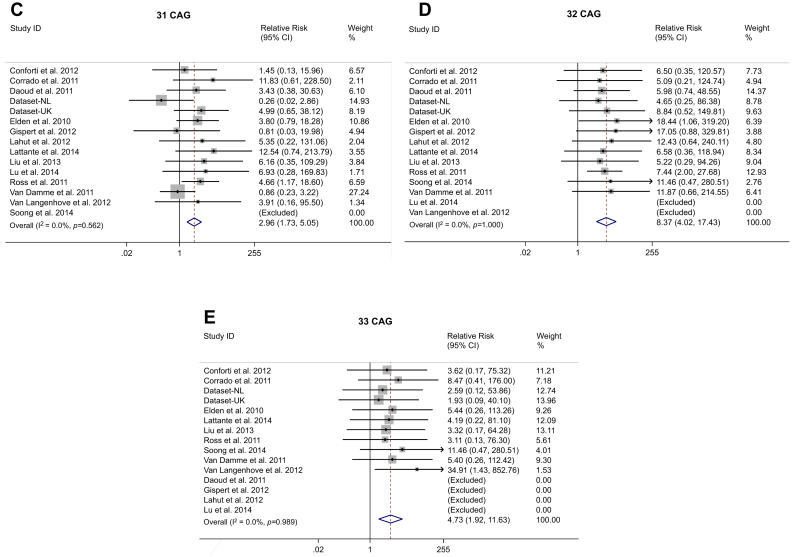
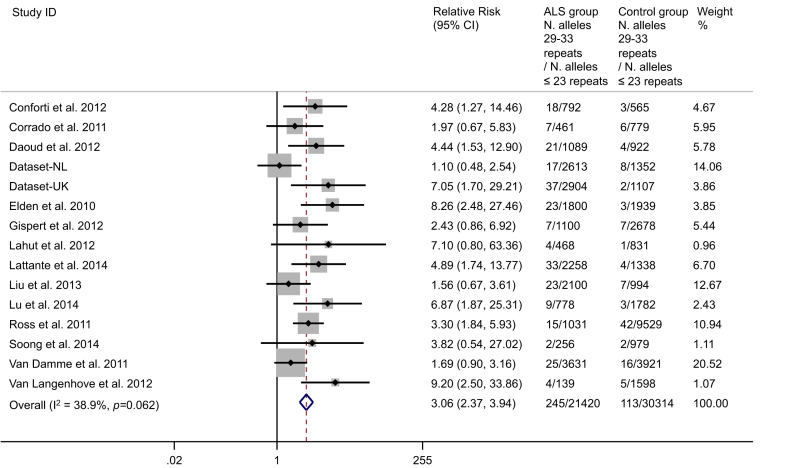
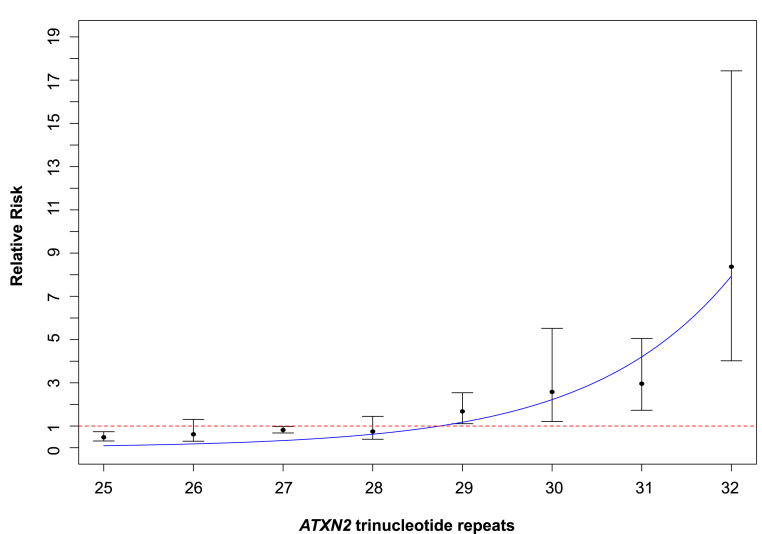
We investigated a CAG trinucleotide repeat expansion in the ATXN2 gene in amyotrophic lateral sclerosis (ALS). Two new case-control studies, a British dataset of 1474 ALS cases and 567 controls, and a Dutch dataset of 1328 ALS cases and 691 controls were analyzed. In addition, to increase power, we systematically searched PubMed for case-control studies published after 1 August 2010 that investigated the association between ATXN2 intermediate repeats and ALS. We conducted a meta-analysis of the new and existing studies for the relative risks of ATXN2 intermediate repeat alleles of between 24 and 34 CAG trinucleotide repeats and ALS. There was an overall increased risk of ALS for those carrying intermediate sized trinucleotide repeat alleles (odds ratio 3.06 [95% confidence interval 2.37-3.94]; p = 6 × 10-18), with an exponential relationship between repeat length and ALS risk for alleles of 29-32 repeats (R2 = 0.91, p = 0.0002). No relationship was seen for repeat length and age of onset or survival. In contrast to trinucleotide repeat diseases, intermediate ATXN2 trinucleotide repeat expansion in ALS does not predict age of onset but does predict disease risk.
Keywords: ALS; ATXN2; Age of onset; Amyotrophic lateral sclerosis; CAG; Expansion; Exponential risk; Intermediate expansion; Risk; SCA2; Trinucleotide repeat; Triplet.
Copyright © 2016 The Author(s). Published by Elsevier Inc. All rights reserved.
Figures
Similar articles
-
Analysis of ATXN2 trinucleotide repeats in Korean patients with amyotrophic lateral sclerosis.Neurobiol Aging. 2018 Jul;67:201.e5-201.e8. doi: 10.1016/j.neurobiolaging.2018.03.019. Epub 2018 Mar 23. Neurobiol Aging. 2018. PMID: 29665996
-
Amyotrophic lateral sclerosis risk for spinocerebellar ataxia type 2 ATXN2 CAG repeat alleles: a meta-analysis.JAMA Neurol. 2014 Dec;71(12):1529-34. doi: 10.1001/jamaneurol.2014.2082. JAMA Neurol. 2014. PMID: 25285812 Free PMC article.
-
Simultaneous ALS and SCA2 associated with an intermediate-length ATXN2 CAG-repeat expansion.Amyotroph Lateral Scler Frontotemporal Degener. 2021 Nov;22(7-8):579-582. doi: 10.1080/21678421.2020.1853172. Epub 2020 Dec 7. Amyotroph Lateral Scler Frontotemporal Degener. 2021. PMID: 33284045
-
Intermediate CAG repeat expansion in the ATXN2 gene is a unique genetic risk factor for ALS--a systematic review and meta-analysis of observational studies.PLoS One. 2014 Aug 22;9(8):e105534. doi: 10.1371/journal.pone.0105534. eCollection 2014. PLoS One. 2014. PMID: 25148523 Free PMC article. Review.
-
Model organisms reveal insight into human neurodegenerative disease: ataxin-2 intermediate-length polyglutamine expansions are a risk factor for ALS.J Mol Neurosci. 2011 Nov;45(3):676-83. doi: 10.1007/s12031-011-9548-9. Epub 2011 Jun 10. J Mol Neurosci. 2011. PMID: 21660502 Free PMC article. Review.
Cited by
-
Moving Toward Patient-Tailored Treatment in ALS and FTD: The Potential of Genomic Assessment as a Tool for Biological Discovery and Trial Recruitment.Front Neurosci. 2021 Mar 1;15:639078. doi: 10.3389/fnins.2021.639078. eCollection 2021. Front Neurosci. 2021. PMID: 33732107 Free PMC article. Review.
-
Genetics of Ataxias in Indian Population: A Collative Insight from a Common Genetic Screening Tool.Adv Genet (Hoboken). 2022 Mar 10;3(2):2100078. doi: 10.1002/ggn2.202100078. eCollection 2022 Jun. Adv Genet (Hoboken). 2022. PMID: 36618024 Free PMC article.
-
Identification and characterization of novel and rare susceptible variants in Indian amyotrophic lateral sclerosis patients.Neurogenetics. 2019 Oct;20(4):197-208. doi: 10.1007/s10048-019-00584-3. Epub 2019 Aug 20. Neurogenetics. 2019. PMID: 31432357
-
An update on the neurological short tandem repeat expansion disorders and the emergence of long-read sequencing diagnostics.Acta Neuropathol Commun. 2021 May 25;9(1):98. doi: 10.1186/s40478-021-01201-x. Acta Neuropathol Commun. 2021. PMID: 34034831 Free PMC article. Review.
-
The role of DNA damage response in amyotrophic lateral sclerosis.Essays Biochem. 2020 Oct 26;64(5):847-861. doi: 10.1042/EBC20200002. Essays Biochem. 2020. PMID: 33078197 Free PMC article. Review.
References
-
- Abel O., Powell J.F., Andersen P.M., Al-Chalabi A. ALSoD: a user-friendly online bioinformatics tool for amyotrophic lateral sclerosis genetics. Hum. Mutat. 2012;33:1345–1351. - PubMed
-
- Al-Chalabi A., Calvo A., Chio A., Colville S., Ellis C.M., Hardiman O., Heverin M., Howard R.S., Huisman M.H., Keren N., Leigh P.N., Mazzini L., Mora G., Orrell R.W., Rooney J., Scott K.M., Scotton W.J., Seelen M., Shaw C.E., Sidle K.S., Swingler R., Tsuda M., Veldink J.H., Visser A.E., van den Berg L.H., Pearce N. Analysis of amyotrophic lateral sclerosis as a multistep process: a population-based modelling study. Lancet Neurol. 2014;13:1108–1113. - PMC - PubMed
-
- Al-Chalabi A., Hardiman O. The epidemiology of ALS: a conspiracy of genes, environmental and time. Nat. Rev. Neurol. 2013;9:617–628. - PubMed
-
- Burnham K.P., Anderson D.R. Springer-Verlag; New York: 2002. Model Selection and Multimodel Inference: A Practical Information-theoretic Approach.
-
- Chen Y., Huang R., Yang Y., Chen K., Song W., Pan P., Li J., Shang H.F. Ataxin-2 intermediate-length polyglutamine: a possible risk factor for Chinese patients with amyotrophic lateral sclerosis. Neurobiol. Aging. 2011;32:1925. - PubMed
Publication types
MeSH terms
Substances
Grants and funding
- MR/M008606/1/MRC_/Medical Research Council/United Kingdom
- AL-CHALABI/APR15/844-791/MNDA_/Motor Neurone Disease Association/United Kingdom
- FRATTA/JAN15/946-795/MNDA_/Motor Neurone Disease Association/United Kingdom
- MRF_MRF-060-0003-RG-SMITH/MRF/MRF/United Kingdom
- JONES/OCT15/958-799/MNDA_/Motor Neurone Disease Association/United Kingdom
- G0600974/MRC_/Medical Research Council/United Kingdom
- G1100695/MRC_/Medical Research Council/United Kingdom
- ALCHALABI-DOBSON/APR14/829-791/MNDA_/Motor Neurone Disease Association/United Kingdom
- MC_G1000733/MRC_/Medical Research Council/United Kingdom
- G0500289/MRC_/Medical Research Council/United Kingdom
- G0300329/MRC_/Medical Research Council/United Kingdom
- G0900688/MRC_/Medical Research Council/United Kingdom
- MR/L501529/1/MRC_/Medical Research Council/United Kingdom
- G0501573/MRC_/Medical Research Council/United Kingdom
- MR/L021803/1/MRC_/Medical Research Council/United Kingdom
- G0900635/MRC_/Medical Research Council/United Kingdom
- R35 NS097275/NS/NINDS NIH HHS/United States
- WT_/Wellcome Trust/United Kingdom
- SHAW/NOV14/985-797/MNDA_/Motor Neurone Disease Association/United Kingdom
- MALASPINA/APR13/817-791/MNDA_/Motor Neurone Disease Association/United Kingdom
LinkOut - more resources
Full Text Sources
Other Literature Sources
Medical
Research Materials
Miscellaneous
