. 2017 Feb 2;20(2):233-246.e7.
doi: 10.1016/j.stem.2016.11.003. Epub 2016 Dec 15.

Adaptive Chromatin Remodeling Drives Glioblastoma Stem Cell Plasticity and Drug Tolerance

Affiliations

Adaptive Chromatin Remodeling Drives Glioblastoma Stem Cell Plasticity and Drug Tolerance

Brian B Liau et al. Cell Stem Cell. .

Abstract

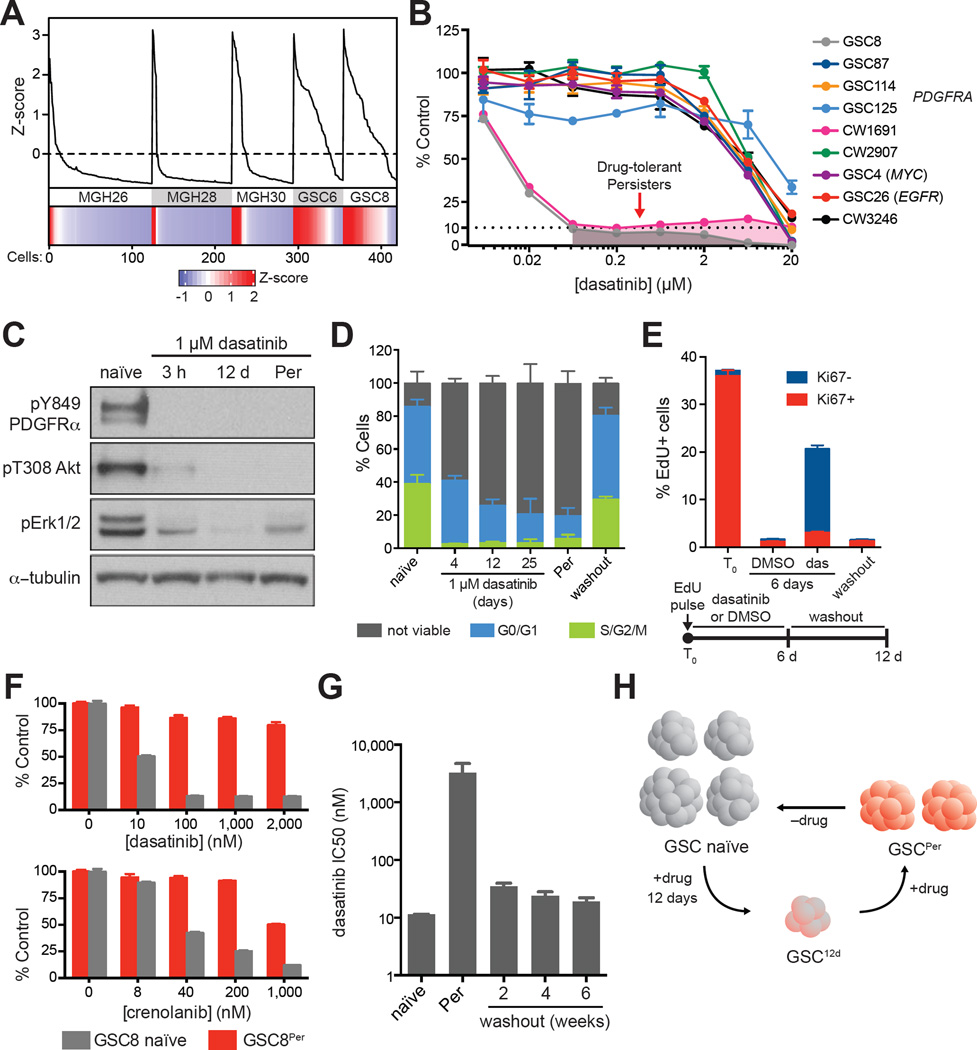
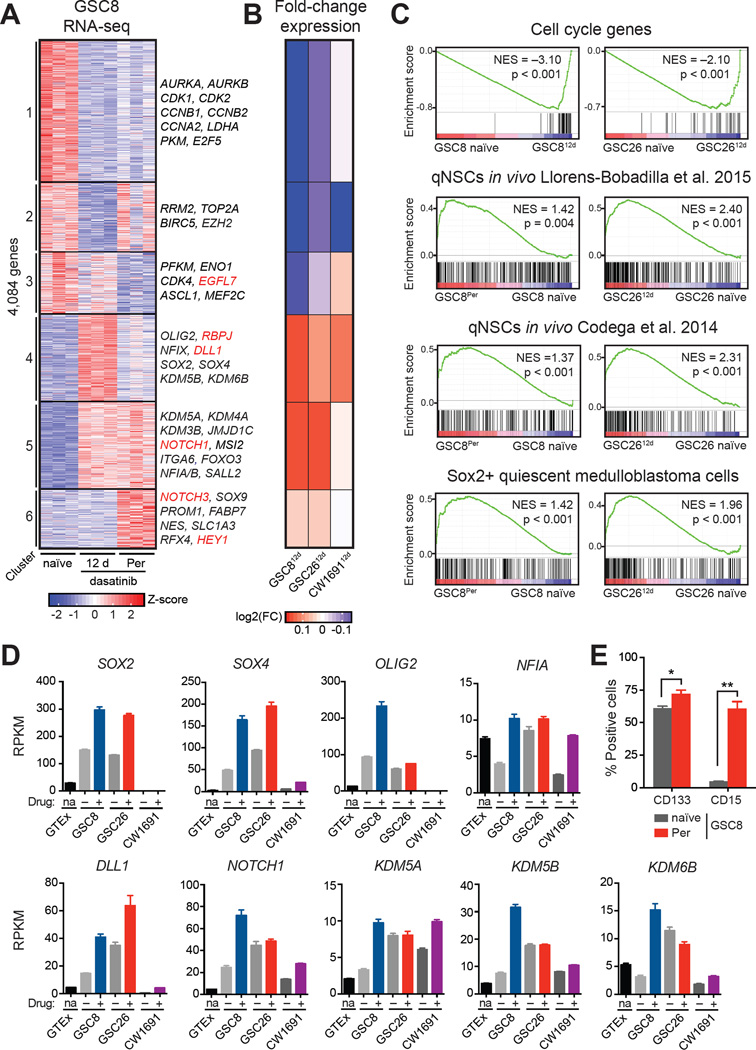
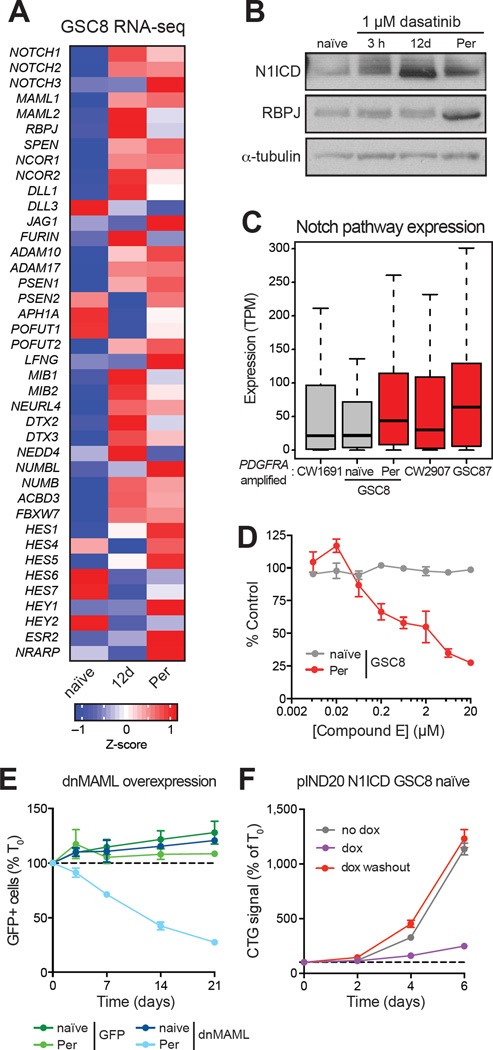
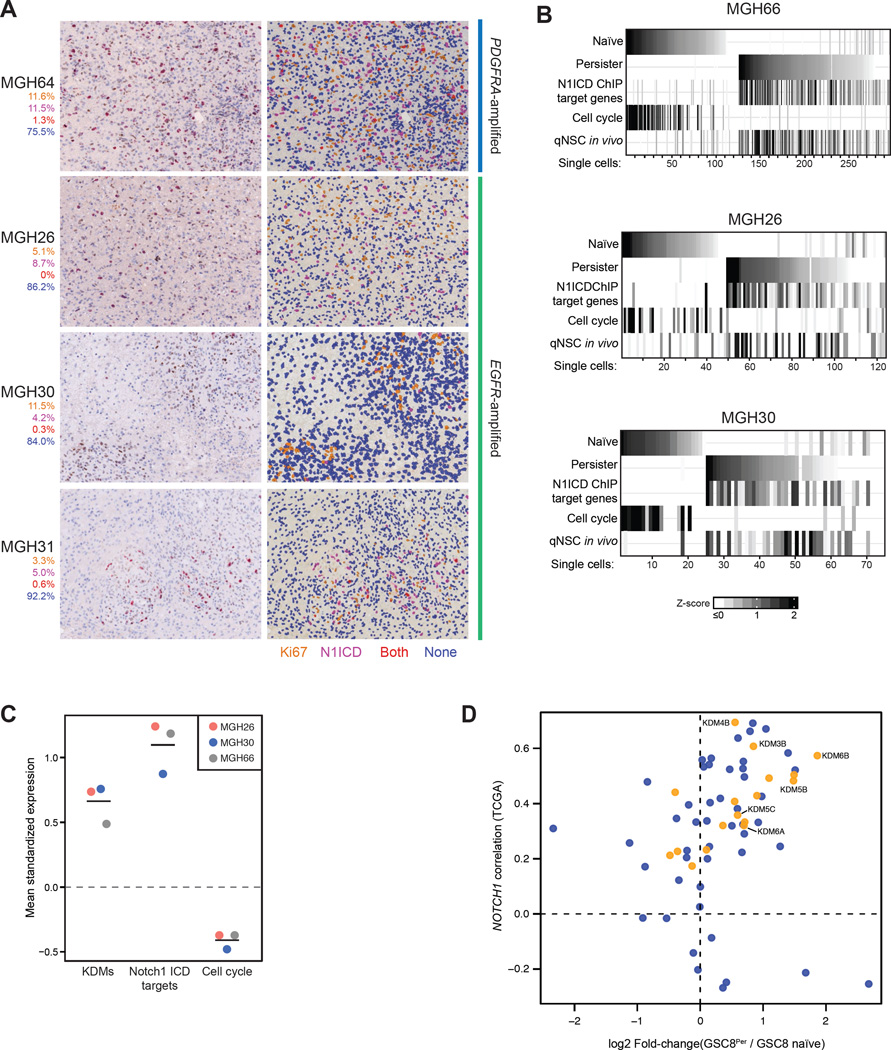
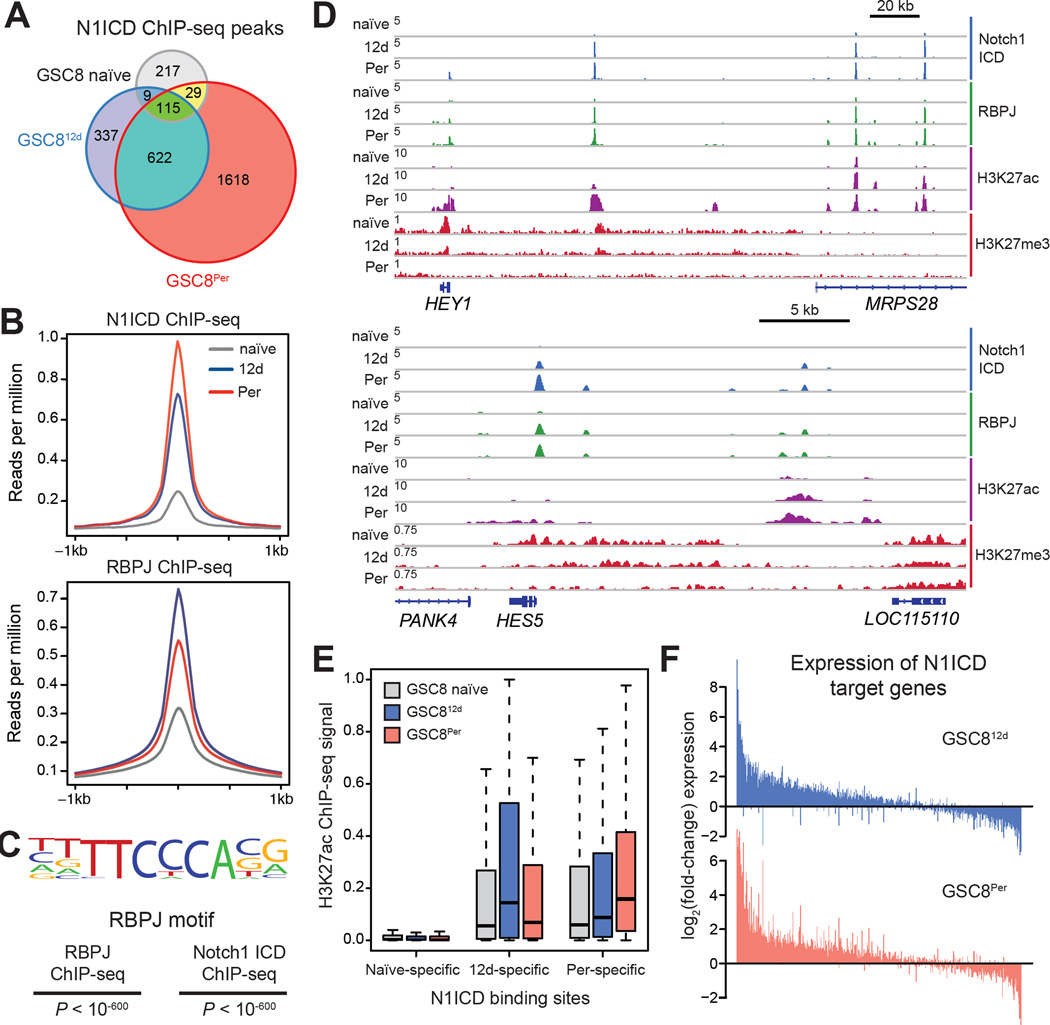
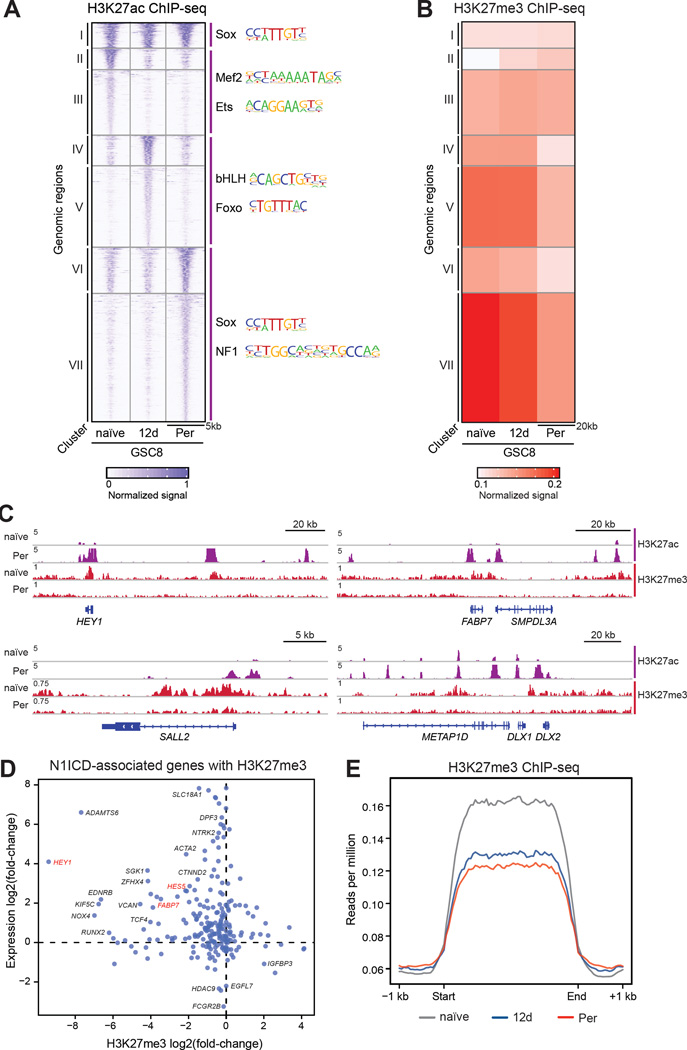
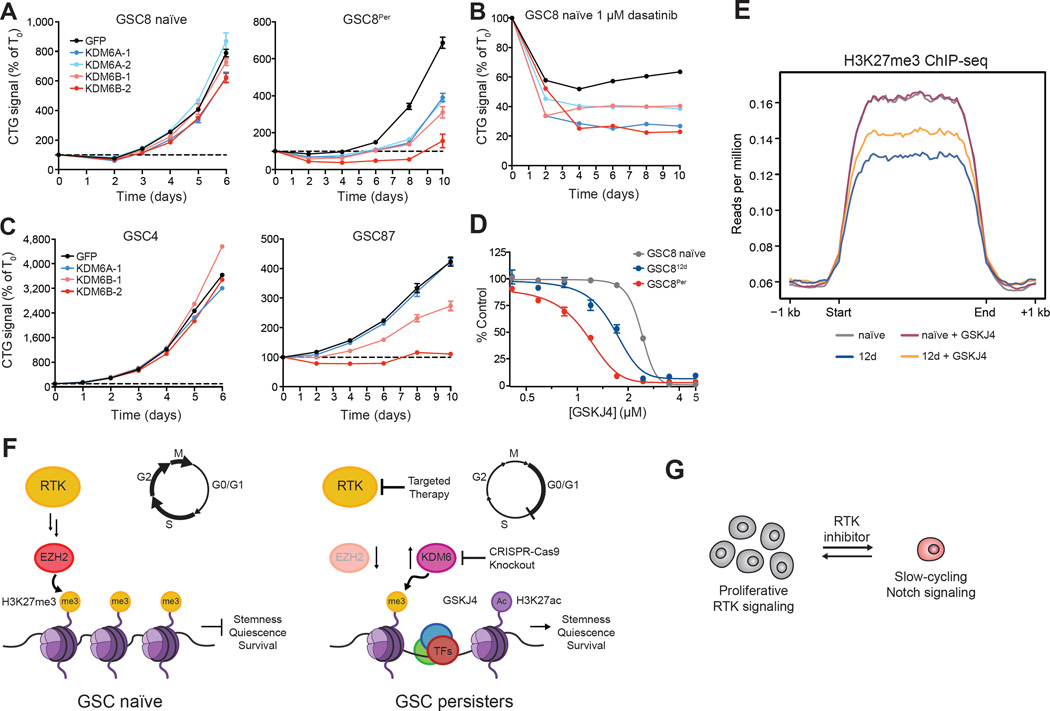
Glioblastoma, the most common and aggressive malignant brain tumor, is propagated by stem-like cancer cells refractory to existing therapies. Understanding the molecular mechanisms that control glioblastoma stem cell (GSC) proliferation and drug resistance may reveal opportunities for therapeutic interventions. Here we show that GSCs can reversibly transition to a slow-cycling, persistent state in response to targeted kinase inhibitors. In this state, GSCs upregulate primitive developmental programs and are dependent upon Notch signaling. This transition is accompanied by widespread redistribution of repressive histone methylation. Accordingly, persister GSCs upregulate, and are dependent on, the histone demethylases KDM6A/B. Slow-cycling cells with high Notch activity and histone demethylase expression are present in primary glioblastomas before treatment, potentially contributing to relapse. Our findings illustrate how cancer cells may hijack aspects of native developmental programs for deranged proliferation, adaptation, and tolerance. They also suggest strategies for eliminating refractory tumor cells by targeting epigenetic and developmental pathways.

Keywords: KDM6A/B; Notch; cancer; chromatin; drug resistance; epigenetics; glioblastoma; histone demethylases; stem cell.


Figures

Figure 1
Figure 1. RTK Inhibition Prompts Emergence of Slow-Cycling Drug-Tolerant Persisters
(A) Line graph shows cell cycle meta-signature z-scores (y-axis) for ordered individual cells (x-axis) for three primary tumors (MGH26, MGH28, MGH30) and two GSC lines (GSC6, GSC8). Lower panel: heatmap of cell cycle meta-signature z-scores. More cells in GSC lines display increased cell cycle expression in comparison to primary tumor specimens. (B) Dose-response curves for treatment. Models treated for 4 days with the exception of CW1691 (6 days). PDGFRA amplified GSC8 and CW1691 display selective sensitivity (IC50 ~10 nM) in comparison to other lines tested. Error bars represent s.e.m. across three replicates. One of two biological replicates shown. (C) Immunoblots show levels of phosphorylated PDGFRα, Akt, and Erk1/2 upon dasatinib treatment for 3 hours (3 h), 12 days (12 d), and >8 weeks (Per) in GSC8. Dasatinib treatment significantly reduced levels of phosphorylated proteins. One of two biological replicates shown. (D) Stacked barplot shows the fraction of cells viable, in G0/G1, and in S/G2/M (y-axis), respectively, for GSC8 treated with dasatinib (1 µM) at various timepoints (x-axis). Washout refers to removal of dasatinib for >8 weeks. Error bars represent s.d. across at least three biological replicates. (E) Stacked barplot summarizes flow cytometry data for Ki67 and EdU incorporation after EdU pulse (2 h) and subsequent treatments. Dasatinib treated cells maintained higher relative levels of EdU+ cells, which lose Ki67 positivity, compared to vehicle treated cells. Further 6-day washout of dasatinib depletes EdU+ cells. Error bars represent s.d. across three biological replicates. (F) Barplots show the relative amount of cells (%, y-axis) after 4 day drug treatments at various doses (x-axis) in comparison to DMSO controls. GSC8Per tolerate higher concentrations of PDGFR inhibitors (dasatinib, crenolanib) in comparison to GSC8 naïve. Error bars represent s.e.m. across six replicates. One of two biological replicates is shown. (G) Barplot shows dasatinib IC50 values (y-axis) for GSC8 naïve, GSC8Per, and at different time points following dasatinib removal. Washout of dasatinib from GSC8Per leads to resensitization to dasatinib-mediated growth arrest. Error bars represent s.d. of three biological replicates from separately derived GSC8Per lines. (H) Schematic illustrating formation of slow-cycling, drug-tolerant persisters. See also Table S1, Figure S1, and Figure S2.
Figure 2
Figure 2. Transcriptional Programs Related to Slow Proliferation and Stemness are Enriched in GSC8 Persisters
(A) Heatmap shows expression profiles of the 4,084 most variably expressed genes across GSC8 naïve, GSC812d, and GSC8Per. K-means clustering was performed to distinguish sets of genes with coherent patterns of expression across the time course of dasatinib treatment. Data was generated from three biological replicates of separately derived GSC812d and GSC8Per cultures. Color represents z-scores of gene expression across rows. (B) Heatmap shows average changes in gene expression of clusters 1–6 in GSC8, GSC26 and CW1691 after 12-day treatment with gefinitib and dasatinib, respectively, compared to corresponding untreated control. Similar trends of gene expression change are evident in GSC8, GSC26 and CW1691 persisters. Color represents log2(fold-change) gene expression, where the scale ranges from the minimum to maximum value observed in GSC2612d or CW169112d. (C) Gene set enrichment analysis (GSEA) shows enrichment of a cell cycle meta-signature (upper panel), gene sets related to qNSCs (middle panels), and Sox2+ medulloblastoma cells (lower panel) across naïve and persister states for GSC8 and GSC26. The cell cycle gene signature is negatively enriched, while the quiescence gene signatures are positively enriched upon drug treatment. (D) Barplots show the expression levels (reads per kilobase per million mapped reads (RPKM), y-axis) of SOX2, SOX4, OLIG2, NFIA, DLL1, NOTCH1, KDM5A, KDM5B and KDM6B in normal human brain (GTEx), GSC8 naïve, GSC812d, GSC26 naïve, GSC2612d, CW1691 naïve, and CW169112d. Most genes are upregulated in drug-treated cells. Error bars represent s.e.m. (E) Barplot shows the fraction of cells (y-axis) CD133+ or CD15+ by flow cytometry. GSC8Per display significantly increased positivity for CD133 and CD15 in comparison to GSC8 naïve (Student’s t-test; *P < 0.05; **P < 0.01). Error bars represent s.e.m. across three biological replicates. See also Table S2–S4 and Figure S3.
Figure 3
Figure 3. Notch Signaling is Activated in GSCPer
(A) Heatmap shows average expression of genes implicated in Notch signaling (Kopan and Ilagan, 2009) for GSC8 naïve, GSC812d, and GSC8Per. Gene expression was averaged over replicates within each condition; color represents z-scores. (B) Immunoblots show levels of N1ICD and RBPJ in GSC8 naïve and GSC8 treated with dasatinib for 3 h, 12 d, and >8 weeks (Per). One of two biological replicates is shown. (C) Boxplots show Notch pathway gene expression (transcripts per million (TPM), y-axis) in different PDGFRA-amplified GBM lines. Notch signaling is increased in GSC8Per and is significantly higher in insensitive cell lines compared to sensitive cell lines (P < 10−7; Friedman test). Color indicates relative sensitivity (gray) or insensitivity (red) to dasatinib. (D) Dose-response curves for 12-day Compound E treatment are shown. GSC8Per are preferentially sensitive in comparison to GSC8 naïve. Error bars represent s.e.m. across four replicates. One of three biological replicates is shown. (E) Line graph shows fraction of GFP+ cells normalized to day zero (T0) (y-axis) over a time course following induced overexpression of dnMAML-GFP or GFP control. dnMAML overexpression selectively depleted GFP+ cells in GSC8Per. Error bars represent s.e.m. across three replicates. One of two biological replicates is shown. (F) Line graphs show cell growth as relative Cell-titer Glo (CTG) values normalized to T0 (y-axis) over a time course (x-axis) following doxycycline (dox)-induced N1ICD overexpression. N1ICD overexpression in GSC8 naïve reduced proliferation, but is reversed upon dox washout. Error bars represent s.e.m. across three replicates. One of three biological replicates is shown. See also Figure S4.
Figure 4
Figure 4. Slow-cycling, Notch-high Cells are Present in Primary GBM Tumors
(A) Images show hematoxylin staining and immunohistochemistry for N1ICD and Ki67 in patient primary GBM tumors, demonstrating that a subpopulation of N1ICD+ cells are slow-cycling. Left hand panels: unenhanced images, right hand panels: enhanced pseudocolored images. Percentages represent the fraction of total cells that are Ki67+ only (orange), N1ICD+ only (magenta), double-positive (red), and double-negative (blue). (B) Heatmap shows mean expression of gene sets (rows) derived from GSC8 naïve (clusters 1–3, Figure 2A) and GSC8Per (clusters 4–6, Figure 2A) as well as N1ICD GSC8Per target genes, a cell cycle signature, and a qNSC in vivo signature (rows) across single tumor cells (columns) in three EGFR-amplified tumors (MGH66, MGH30, MGH26). K-means clustering of columns identified groups of cells with similar expression profiles. Clusters were order based on expression of GSC8 naïve or GSC8Per signatures, respectively. Colors correspond to z-scores calculated across individual cells; in this representation negative z-scores are mapped to 0. (C) Dotplot shows mean expression (y-axis) of KDM-, Notch-, and cell cycle signature gene sets within persister-like cells (top quintile) in MGH26, MGH30, and MGH66 (x-axis) (Figure 4B). Expression values were standardized (mean = 0; s.d. = 1) – observed deviations from zero reflect expression changes relative to all cells. Horizontal bars correspond to mean values for persister-like cells. (D) For each annotated chromatin enzyme gene, scatterplot shows the correlation between its expression and NOTCH1 expression across all TCGA samples (y-axis) versus its expression change in GSC8Per relative to GSC8 naïve (x-axis). KDMs are highlighted in yellow. See also Table S5.
Figure 5
Figure 5. N1ICD Binds to Neurodevelopmental Enhancers in GSC Persisters
(A) Venn diagram shows the number and overlap of N1ICD ChIP-seq peaks across GSC8 naïve, GSC812d, and GSC8Per states. N1ICD localizes to fewer regions in GSC8 naïve (368 peaks) and shows increased binding upon drug treatment (1,083 and 2,384 in GSC812d and GSC8Per, respectively). (B) ChIP-seq profile plots show ChIP-seq signal (y-axis, reads per million (rpm)) of N1ICD (upper panel) and RBPJ (lower panel) across peaks for each respective protein. The x-axis shows flanking regions of ±1 kb around the peak center. (C) Consensus RBPJ motif logo detected in N1ICD and RBPJ ChIP-seq peaks in GSC8Per and the corresponding p-values are shown. (D) ChIP-seq profiles show ChIP-seq signal (y-axis, rpm) of N1ICD, RBPJ, H3K27ac and H3K27me3 at the HEY1 (upper panel) and HES5 (bottom panel) locus. (E) Boxplots show H3K27ac levels of GSC8 naïve, GSC812d and GSC8Per within 1.5 kb windows centered at NICD peaks identified within GSC8 naïve (left), GSC812d (middle), and GSC8Per (right). For each condition, H3K27ac levels were significantly higher within the corresponding condition-specific N1ICD peaks (GSC812d-specific NICD peaks: GSC8 naïve vs GSC812dP < 10−15; GSC8Per-specific NICD peaks: GSC8 naïve vs GSC8PerP < 10−16; Wilcoxon test). (F) Barplots show log2(fold-change) in gene expression of N1ICD target genes specifically identified in GSC812d or GSC8Per for GSC812d (upper panel) and GSC8Per (lower panel). Genes were sorted decreasingly according to the added fold-change. See also Figure S5.
Figure 6
Figure 6. H3K27me3 Redistribution Accompanies Re-activation of Neurodevelopmental Genes
(A) Heatmap shows normalized H3K27ac ChIP-seq signal for GSC8 naïve, GSC812d, and GSC8Per across different genomic intervals (rows). K-means clustering of rows identified groups of H3K27ac regions that are shared (I), naïve-enriched (II-III), GSC812d-enriched (IV-V), and GSC8Per-enriched (VI-VII). Color corresponds to normalized ChIP signal. (B) Heatmap shows average normalized ChIP-seq signal for H3K27me3 for groups of genomic intervals derived from clustering analysis in Figure 6A. H3K27me3 levels are depleted in cluster VI and VII. H3K27me3 signals were calculated within 20 kb windows centered around H3K27ac peaks, respectively. Color corresponds to normalized ChIP signal. (C) ChIP-seq profiles show ChIP-seq signal (y-axis, rpm) for H3K27ac and H3K27me3 at genomic loci of HEY1, FABP7, DLX2, and SALL2. (D) Scatterplot shows changes in expression (y-axis) and intragenic H3K27me3 levels (x-axis) of genes associated with an N1ICD peak in GSC8Per that contain at least one H3K27me3 peak in GSC naïve, GSC812d or GSC8Per. The y-axis represents log2(fold-change) in gene expression comparing GSC8Per to GSC8 naïve. The x-axis represents log2(fold-change) of intragenic H3K27me3 levels comparing GSC8Per to GSC8 naïve. (E) ChIP-seq profile plots show H3K27me3 ChIP-seq signal (y-axis, rpm) across all H3K27me3 domains (>10 kb) in GSC8 naïve (grey), GSC812d (blue), and GSC8Per (red). The x-axis represents size scaled H3K27me3 domains, with ±1 kb flanking regions. See also Figure S6.
Figure 7
Figure 7. KDM6 is Essential in GSC Persisters
(A–C) Line graphs show cell growth as relative CTG values normalized to T0 (y-axis) over a time course (x-axis) following CRISPR-Cas9 mediated knockout of respective genes. Knockout of KDM6A and KDM6B modestly affected the proliferation of GSC8 naïve (A, left panel) but significantly impaired proliferation of GSC8Per (A, right panel) and (B) emergence of persisters. Knockout of KDM6B preferentially affected the proliferation of GSC87 (C, right panel), which displays ‘persister-like’ characteristics. Error bars represent s.e.m. across at least three replicates. One of two biological replicates is shown. (D) Dose-response curves for 4 day GSKJ4 treatment are shown. GSC812d and GSC8Per are preferentially sensitive to GSKJ4 in comparison to GSC8 naïve. Error bars represent s.e.m. across three replicates. One of three biological replicates is shown. (E) ChIP-seq profile plots show H3K27me3 ChIP-seq signal (y-axis, rpm) across all H3K27me3 domains (>10 kb) in GSC8 naïve (grey), GSC812d (blue), GSC8 treated with GSKJ4 (8 d, 1.5 µM, purple), and GSC812d treated with GSKJ4 (8 d, 1.5 µM, orange) starting after 4 days of initial dasatinib treatment. The x-axis represents size scaled H3K27me3 domains, with ±1 kb flanking regions. (F) Schematic illustrating a proposed model, whereby EZH2 loss and KDM6B upregulation may facilitate H3K27 remodeling and subsequent activation of stemness programs. (G) Cartoon depicting the switch between RTK- and Notch-dependent states that may parallel antagonism between these pathways in normal neurodevelopment. See also Table S4, Figure S6, and Figure S7.

Similar articles

Cited by

References

    1. Agger K, Cloos PAC, Rudkjaer L, Williams K, Andersen G, Christensen J, Helin K. The H3K27me3 demethylase JMJD3 contributes to the activation of the INK4A-ARF locus in response to oncogene- and stress-induced senescence. Genes Dev. 2009;23:1171–1176. - PMC - PubMed
    1. Aguirre A, Rubio ME, Gallo V. Notch and EGFR pathway interaction regulates neural stem cell number and self-renewal. Nature. 2010;467:323–327. - PMC - PubMed
    1. Anders S, Huber W. Differential expression analysis for sequence count data. Genome Biol. 2010;11:R106. - PMC - PubMed
    1. Bao S, Wu Q, McLendon RE, Hao Y, Shi Q, Hjelmeland AB, Dewhirst MW, Bigner DD, Rich JN. Glioma stem cells promote radioresistance by preferential activation of the DNA damage response. Nature. 2006;444:756–760. - PubMed
    1. Black BL, Ligon KL, Zhang Y, Olson EN. Cooperative transcriptional activation by the neurogenic basic helix-loop-helix protein MASH1 and members of the myocyte enhancer factor-2 (MEF2) family. Journal of Biological Chemistry. 1996;271:26659–26663. - PubMed

MeSH terms