. 2016 Dec 15;167(7):1803-1813.e12.
doi: 10.1016/j.cell.2016.11.035.

Mutant KRAS Enhances Tumor Cell Fitness by Upregulating Stress Granules

Affiliations

Mutant KRAS Enhances Tumor Cell Fitness by Upregulating Stress Granules

Elda Grabocka et al. Cell. .

Abstract

There is growing evidence that stress-coping mechanisms represent tumor cell vulnerabilities that may function as therapeutically beneficial targets. Recent work has delineated an integrated stress adaptation mechanism that is characterized by the formation of cytoplasmic mRNA and protein foci, termed stress granules (SGs). Here, we demonstrate that SGs are markedly elevated in mutant KRAS cells following exposure to stress-inducing stimuli. The upregulation of SGs by mutant KRAS is dependent on the production of the signaling lipid molecule 15-deoxy-delta 12,14 prostaglandin J2 (15-d-PGJ2) and confers cytoprotection against stress stimuli and chemotherapeutic agents. The secretion of 15-d-PGJ2 by mutant KRAS cells is sufficient to enhance SG formation and stress resistance in cancer cells that are wild-type for KRAS. Our findings identify a mutant KRAS-dependent cell non-autonomous mechanism that may afford the establishment of a stress-resistant niche that encompasses different tumor subclones. These results should inform the design of strategies to eradicate tumor cell communities.

Keywords: KRAS; cancer; prostaglandins; stress granules.


Conflict of interest statement

COMPETING FINANCIAL INTERESTS

The authors declare no competing financial interests.

Figures
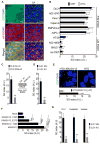
Figure 1
Figure 1. Upregulation of SGs in mutant KRAS cells
(A) DLD1 Mut cells were treated with sodium arsenate (SA, 100 μM) for 1hr. SGs were detected by G3BP and eIF4G immunofluorescence staining. Scale bar, 10 μm. (B) Colon (DLD1, NCI H747, HT29, NCI H508, SNUC1) and pancreatic (Panc-1, Capan-2, MiaPaCa 2, AsPC-1, HS 700T) cancer cells were treated as in (A). SGs were quantified by defining a SG index (SG area/cell area) based on G3BP and eIF4G immunofluorescence. Data are presented as arbitrary units (A.U.) Error bars indicate mean −/+ SEM for at least 3 independent experiments in which 4 fields of view with at least 50 cells/field of view/cell line were quantified. (C) PL45 cells expressing inducible scramble (Scr) or KRAS shRNA were treated with SA as in A. SG index based on G3BP immunofluorescence is shown. Inset-Whole cell lysates (WCL) expressing inducible scramble (Scr) or KRAS shRNA were subjected to immunoblotting with the indicated antibodies. ERK2 serves as a loading control. (D) DLD1 Mut and DLD1 KO cells were treated with SA as in A. SG index based on G3BP immunofluorescence is shown. (E) Hela Tet-ON cells (HTO) and HTO cells that conditionally express mutant KRAS (HTO-KRASV12) were treated with SA (100 μM, 1hr). SGs were visualized by G3BP immunofluorescence staining (top). SG index based on G3BP immunofluorescence is shown (bottom). (F) Hela cells expressing mCherry-KRASV12, mCherry-KRASV12T35S, mCherry-KRASV12E37G, mCherry-KRASV12Y40C were treated with SA (100 μM, 1hr). SG index based on G3BP immunofluorescence is shown. (G) DLD1 Mut and DLD1 KO cells were treated with UV-C irradiation (50 mJ/m2, 24hr), oxaliplatin (200 μM, 6 hr), or velcade (1 μM, 8hr). SG index based on G3BP immunofluorescence is shown. (C–G) Data are from a representative experiment out of least 3 independent experiments. For all graphs, error bars indicate mean −/+ SEM for at least 4 fields of view with at least 50 cells/field of view. **p<0.05, ***p<0.005, ****p<0.005. Scale bar, 10 μm.
Figure 2
Figure 2. Mutant KRAS upregulates SGs in vivo
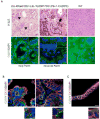
(A) Serial sections from a pancreas of LSL-KRasG12D/+;LSL-Trp53R172H/+;Pdx-1-Cre (KPC) animals and control wild-type (WT) littermates were stained with hematoxylin and eosin (H&E; scale bar 40 μm) and SGs were visualized by G3BP immunofluorescence (scale bar, 10 μm; inset, 4× zoom-in of boxed region). Arrowheads and arrows indicate early and advanced PanIN lesions, respectively. Images are representative of results obtained from 3 animals/cohort. (B) Sections from two independent human PDAC tissues were immunostained for G3BP and CK19 (epithelial marker). (C) A section from a normal region in human PDAC immunostained for G3BP and CK19. (B–C) Scale bar, 10 μm. Lower panels are 3× zoom-in of boxed regions.
Figure 3
Figure 3. Mutant KRAS upregulates SGs by modulating the cellular capacity to biosynthesize and catabolize prostaglandins
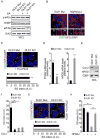
(A) DLD1 Mut and DLD1 KO cells were treated with SA (100 μM, 1hr). Whole cell lysates (WCL) were collected and subjected to immunoblotting with the indicated antibodies. ERK2 serves as a loading control. (B) DLD1 Mut and MiaPaCa-2 cells were treated with SA as in A and SGs were detected by immunofluorescence staining for G3BP and eIF2α. (C) DLD1 Mut and DLD1 KO cells were treated with 15-d-PGJ2 (50 μM, 1hr). SGs were detected by immunofluorescence staining for G3BP and eIF4G (top). SG index based on G3BP immunofluorescence (bottom) is shown. (D) PTGS2 and HPGD mRNA levels in DLD1 Mut and DLD1 KO cells were assessed by quantitative RT-PCR. Error bars indicate SEM (n=3). (E) COX-2 and HPGD protein levels in DLD1 Mut and DLD1 KO cells were assessed by immunoblotting of whole cell lysates (WCL) with the indicated antibodies. G3BP serves as a loading control. (F) DLD1 Mut cells were treated with diclofenac sodium (20 μM, COX-i) for 12 hrs followed by SA treatment (100 μM, 1hr). SG index based on G3BP immunofluorescence is shown. (G) DLD1 Mut and DLD1 KO cells were treated with diclofenac sodium (COX-i) as in Figure 3F and 15-d-PGJ2 as in Figure 3C. SGs were detected by immunofluorescence staining for G3BP and eIF4G (top). SG index based on G3BP immunofluorescence is shown (bottom). (H) DLD1 Mut and DLD1 KO cells were treated with a HPGD inhibitor (HPGD-i; 40 μM) for 6 hrs followed by SA (100 μM, 1hr). SG index based on G3BP immunofluorescence is shown. (A–C, E–H) Data are from a representative experiment out of at least 3 independent experiments. (C, F–H) Error bars indicate mean −/+ SEM for at least 4 fields of view with at least 50 cells/field of view. **p<0.005, ***p<0.0005. Scale bar, 10 μm.
Figure 4
Figure 4. Cell non-autonomous upregulation of SGs by mutant KRAS is mediated by 15-d-PGJ2
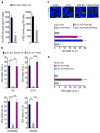
(A) The levels of 15-d-PGJ2 and PGD2 that were secreted by DLD1 Mut and DLD1 KO cells were determined by ELISA of the respective cell culture medium. Data are represented as mean −/+ SEM. (B) DLD1 Mut and DLD1 KO cells were incubated for 10 min in control medium or in conditioned medium from DLD1 Mut cells (KRAS conditioned media; KCM) and then treated with SA, UV-C irradiation, oxaliplatin, or velcade as in Figure 1G. SG index based on G3BP immunofluorescence is shown. (C) DLD1 KO cells were incubated as in Figure 4B in control medium, KCM, KCM immunodepleted with anti-IgG (KCM IgG), or KCM immunodepleted with anti-15-d-PGJ2 (KCM anti PGJ2) and then treated with SA (100 μM, 1hr). SGs were detected by G3BP immunofluorescence staining (top). SG index based on G3BP immunofluorescence is shown (bottom). (D) DLD1 KO cells were incubated as in Figure 4B in control medium, KCM, or KCM from cells treated with diclofenac sodium (COX-i), and then treated with SA (100 μM, 1hr). SG index based on G3BP immunofluorescence is shown. Data are from a representative experiment out of least 3 independent experiments. Error bars indicate mean −/+ SEM for at least 4 fields of view. *p<0.05, **p<0.005, ***p<0.0005. Scale bar, 10 μm.
Figure 5
Figure 5. KRAS cancer cells exert cell non-autonomous protection from chemotherapeutic agents via SG upregulation
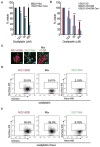
(A) Medium obtained from DLD1 Mut cells treated −/+ diclofenac sodium (COX-i) was utilized to dilute oxaliplatin at the indicated concentrations and added back to the respective conditions for 48 hrs. Cell viability was assessed using the MTT assay. (B) Medium from DLD1 KO cells (control medium), KCM, and KCM from diclofenac sodium (COX-i) treated cells was used to dilute oxaliplatin to the indicated concentrations and added to DLD1 KO cells. Cell viability was assessed using the MTT assay after 48 hrs. (C) Fluorescence images of mCherry-H2B-labeled NCI H508 cells (red), GFP-H2B-labeled DLD1 Mut cells (green), cultured individually or as a mixture. Scale bars represent 40 μm. (D) The indicated cells lines were labeled and cultured as in (C) and subjected to oxaliplatin (100 μM, 48 hrs). Cell death in each population was assessed by flow cytometry analysis of NucView Alexa 405 positive cells. (E) The indicated cells lines were cultured as in (C) and subjected to diclofenac sodium (20 μM, COX-i) as in Figure 4D followed by oxaliplatin (100 μM) for 48 hrs. Cell death in each population was assessed as in Figure 5D. (A–B) Data is expressed as percentage of viable cells. Error bars are mean +/− SEM from 3 independent conditions each performed in triplicate. **p<0.05, ***p<0.005, ****p<0.0005. (D–E) Data are from a representative experiment out of at least 3 independent experiments.
Figure 6
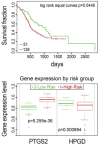
Figure 6. Expression levels of regulators of SGs correlate with poor survival in human pancreatic cancers
Kaplan-Meier survival curves of censored COX analysis showing overall survival for PACA-AU-ICGC human pancreatic carcinoma cohort (top) stratified by maximized PTGS2 and HPGD expression risk groups for the respective cohorts (bottom). (SurvExpress). Error bars indicate SD.

Comment in

Similar articles

Cited by

References

    1. Abramoff MD, Magalhaes PJ, Ram SJ. Image processing with ImageJ. Biophotonics international. 2004;11:36–42.
    1. Adjibade P, St-Sauveur VG, Quevillon Huberdeau M, Fournier MJ, Savard A, Coudert L, Khandjian EW, Mazroui R. Sorafenib, a multikinase inhibitor, induces formation of stress granules in hepatocarcinoma cells. Oncotarget. 2015;6:43927–43943. - PMC - PubMed
    1. Anderson P, Kedersha N, Ivanov P. Stress granules, P-bodies and cancer. Biochimica et biophysica acta. 2015;1849:861–870. - PMC - PubMed
    1. Aguirre-Gamboa R, Gomez-Rueda H, Martı´nez-Ledesma E, Martı´nez-Torteya A, Chacolla-Huaringa R, Rodriguez-Barrentos A, Tamez-Pen˜ AJG, Trevin˜ OV. SuryExpress: an online biomarker validation tool and database for cancer gene expression data using survival analysis. PloS One. 2013;8:e74250. - PMC - PubMed
    1. Arimoto K, Fukuda H, Imajoh-Ohmi S, Saito H, Takekawa M. Formation of stress granules inhibits apoptosis by suppressing stress-responsive MAPK pathways. Nature cell biology. 2008;10:1324–1332. - PubMed

MeSH terms

Substances