. 2016 Dec 8;12(12):e1006031.
doi: 10.1371/journal.ppat.1006031. eCollection 2016 Dec.

The Ebola Interferon Inhibiting Domains Attenuate and Dysregulate Cell-Mediated Immune Responses

Affiliations

The Ebola Interferon Inhibiting Domains Attenuate and Dysregulate Cell-Mediated Immune Responses

Ndongala Michel Lubaki et al. PLoS Pathog. .

Abstract

Ebola virus (EBOV) infections are characterized by deficient T-lymphocyte responses, T-lymphocyte apoptosis and lymphopenia. We previously showed that disabling of interferon-inhibiting domains (IIDs) in the VP24 and VP35 proteins effectively unblocks maturation of dendritic cells (DCs) and increases the secretion of cytokines and chemokines. Here, we investigated the role of IIDs in adaptive and innate cell-mediated responses using recombinant viruses carrying point mutations, which disabled IIDs in VP24 (EBOV/VP24m), VP35 (EBOV/VP35m) or both (EBOV/VP35m/VP24m). Peripheral blood mononuclear cells (PBMCs) from cytomegalovirus (CMV)-seropositive donors were inoculated with the panel of viruses and stimulated with CMV pp65 peptides. Disabling of the VP35 IID resulted in increased proliferation and higher percentages of CD4+ T cells secreting IFNγ and/or TNFα. To address the role of aberrant DC maturation in the IID-mediated suppression of T cell responses, CMV-stimulated DCs were infected with the panel of viruses and co-cultured with autologous T-lymphocytes. Infection with EBOV/VP35m infection resulted in a significant increase, as compared to wt EBOV, in proliferating CD4+ cells secreting IFNγ, TNFα and IL-2. Experiments with expanded CMV-specific T cells demonstrated their increased activation following co-cultivation with CMV-pulsed DCs pre-infected with EBOV/VP24m, EBOV/VP35m and EBOV/VP35m/VP24m, as compared to wt EBOV. Both IIDs were found to block phosphorylation of TCR complex-associated adaptors and downstream signaling molecules. Next, we examined the effects of IIDs on the function of B cells in infected PBMC. Infection with EBOV/VP35m and EBOV/VP35m/VP24m resulted in significant increases in the percentages of phenotypically distinct B-cell subsets and plasma cells, as compared to wt EBOV, suggesting inhibition of B cell function and differentiation by VP35 IID. Finally, infection with EBOV/VP35m increased activation of NK cells, as compared to wt EBOV. These results demonstrate a global suppression of cell-mediated responses by EBOV IIDs and identify the role of DCs in suppression of T-cell responses.


Conflict of interest statement

The authors have declared that no competing interests exist.

Figures

Fig 1
Fig 1. EBOV suppresses activation of T cells.
CMV-specific T-cell responders were isolated and expanded from CMV+-donors as described in the Materials and Methods section. In parallel, monocytes were isolated and differentiated into DCs from autologous donors. DCs were simultaneously pulsed with CMV-peptides and infected with wt EBOV. Following overnight stimulation, expanded CMV-responders were added at a 1:1 ratio with control (no peptide) or CMV-pulsed DCs. A. Representative flow cytometry histograms showing the levels of the proliferation marker Ki67, cytokines associated with T-cell activation, and the marker of degranulation CD107a. B. Percentage of markers associated with activation in one representative donor. Mean values with SE based on triplicate wells from a single donor. The asterisks indicate statistically significant differences of wt EBOV-infected samples (p<0.05) compared to mock. Testing of T cells from another donor resulted in essentially similar data.
Fig 2
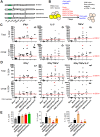
Fig 2. The VP35 IID reduces Th1 responses.
A. Schematic representation of the genomes of wt EBOV and mutant EBOVs used to infect cells; mutations R312A in VP35 and K142A in VP24 are indicated by arrows, and the inserted GFP gene is indicated by green rectangles. B. Schematic representation of the cultivation experiment: PBMCs from CMV-positive donors were labeled with CFSE, inoculated with the indicated viruses at MOI of 2 PFU/cell or SEB, and stimulated with CMV pp65 peptides for 4 hours. PBMCs were washed and cultured for 7 days. Thereafter, cells were re-stimulated for 6 hours in culture medium containing CMV pp65 peptides in presence of brefeldin A, monensin, anti-CD28 mab, anti-CD49d mab and DNase. As a positive control, cells were stimulated with SEB and treated with phorbol-12-myristate-13 acetate (PMA) and ionomycin. Cells were stained intracellularly for the indicated cytokines followed by multicolor flow cytometry. C. Percentages of total and proliferating (CFSE-) CD4+ T cells secreting total IFNγ, IL-2 or TNFα normalized to wt EBOV (100%, indicated by the red horizontal lines). Percentages of proliferating and total CD4+ T cells were individually normalized to wt EBOV values in the same donor (100%, indicated by the red horizontal lines). Cells from each individual donor are represented by the same symbol across the panels; mean values are indicated by horizontal bars. Red asterisks indicate significant differences to wt EBOV (p<0.05). D. Analysis of total and proliferating (CFSE-) CD4+ T cells secreting combinations of multiple cytokines using Boolean gating: percentages of CD4+ T cells positive for the indicated cytokines and negative for the other cytokines included in the analysis; otherwise the designations are same as in Panel C. E. Concentrations of IL-4, IL-5 and IL-13 in supernatants of infected DCs co-cultured with expanded CMV-specific responder T-lymphocytes for 24 hours. Mean values with SE based on three donors. Black asterisks indicate significant differences to mock, and red asterisks indicate significant differences to wt EBOV infection (p<0.05). The experiment was performed 3 times with different donors, with essentially same results.
Fig 3
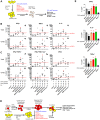
Fig 3. The VP35-mediated reduction of Th1 response results from the deficient maturation of DC.
A. Schematic representation of the cultivation experiment: immature DCs from CMV-positive donors were inoculated with the indicated viruses and stimulated with CMV pp65 peptides for 4 hours, washed and co-cultured with CFSE-labeled autologous purified CD4+ T cells for 7 days. Thereafter, cells were processed and analyzed as described in the legend for Fig 2B. B. Percentages of total and proliferating (CFSE-) CD4+ T cells secreting total IFNγ, IL-2 or TNFα individually normalized to wt EBOV in the same donor; see legend for Fig 2C for details. C. Analysis of total and proliferating (CFSE-) CD4+ T cells secreting combinations of multiple cytokines using Boolean gating; see legend for Fig 2D for details. D. Schematic of T-lymphocyte responders assay. PBMCs were stimulated with CMV peptides for 48-hours and used for positive selection of CD137+ T-lymphocyte. Isolated CMV responders were expanded using dynabeads human T-cell activator beads for 8 days. In parallel, positively selected CD14+ monocyte were differentiated into DC for 7 days, stimulated with CMV peptides and infected with the panel of viruses. After 24 hours, expanded CMV-responders were added to stimulated/infected DCs. Following a 24 hour co-culture, supernatants were collected and cells were analyzed by flow cytometry. E. Percentages of CD4+ T-cells staining positive for intracellular IFNγ, IL-2 and TNFα determined by flow cytometry following a 24 hour co-culture of expanded CMV-specific T-lymphocyte responders with CMV-stimulated DCs infected with the indicated viruses. Black asterisks indicate significant differences to mock, and red asterisks indicate significant differences to wt EBOV infection (p<0.05). The experiment was performed 3 times with different donors, with essentially same results.
Fig 4
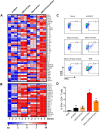
Fig 4. Disabling of IIDs changes cytokine and chemokine expression in co-cultures of CD4+ T cells with infected DCs.
A, B. CMV-pulsed, EBOV-infected DCs were co-cultured with expanded CMV-specific responder T-lymphocytes for 24 hours, and concentrations of cytokines (A) and chemokines (B) in supernatants were determined using a bead-based multiplex analysis. Heatmap showing the relative fold change following normalization to mock-infected samples. Results from 3 individual donors are shown. C, D. Flow cytometry analysis of IFNγ+ CD4+ T cells in DC-T cell co-cultures after transfer of conditioned media from DCs infected with the indicated viruses: representative primary data (C) and mean values with SE based on triplicate samples (D). Black asterisks indicate significant differences to mock, and red asterisks indicate significant differences to wt EBOV infection (p<0.05). The experiment was performed two times with different donors, with essentially same results.
Fig 5
Fig 5. Suppression of IFN-I signaling and the prevention of IFN-I release by EBOV play only a limited role in inhibition of DC maturation.
A. Effect of IFNAR2 blockade on expression of CD86. B. Effect of exogenously added IFNα and IFNβ on expression of CD86. Mean fluorescent intensity (MFI) for CD86+ mock-treated DC (black), or DC treated with IFNAR2 antibodies, IFNα, or IFNβ (colors) are indicated in the top left corners. The experiment was performed two times with different donors, with essentially similar results.
Fig 6
Fig 6. VP35 IID impairs the formation of immunological synapses.
CMV-pulsed DCs infected with wt EBOV or EBOV/VP35m incubated with autologous CD4+ T cells. A. Confocal microscopy data showing co-localization of DC-expressed HLA-DR (green) and CD4+ T cell-expressed CD3 (red). Scale bar = 1 μm. Immunological synapses are shown by white arrows. Representative images from one of three donors analyzed. Note, a representative image of CD4+ T-cells co-cultured with wt EBOV infected DCs demonstrates one of a very limited number of dimly fluorescent HLA-DR+ cells co-localized with CD3+ T cells. Since HLA-DR staining of DCs infected with wt EBOV is dim, an inlet with increased brightness to visualize HLA-DR is shown. B. Numbers of CD4+ T cell—DC immunological synapses counted in 13 mm diameter cover slips. Results are expressed as numbers of immunological synapses per 100 cells. C. Percentages of HLA-DR+ DCs in infected or mock-infected DCs determined by flow cytometry. Mean values with SE based on triplicate samples from one of two independent experiments performed with different donors, which resulted in essentially same results. B, C, black asterisks indicate significant differences to mock, and red asterisks indicate significant differences to wt EBOV infection (p<0.05).
Fig 7
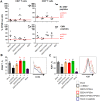
Fig 7. Effects of the VP35 and VP24 IID on proliferation of T cells.
A, Proliferated CD4+ and CD8+ T cells analyzed by CFSE dilution assay, percentages of CFSElow cells. Data for the mutated viruses are individually normalized to wt EBOV-infected cell levels in the same donor. Values for each of the 4 donors analyzed are indicated with individual symbols. Mean values for each treatment are indicated by horizontal bars. B, C. Expanded CD4+ T cell CMV-responders cultured with autologous CMV pulsed DCs: % of CD69Hi cells (B) and Ki67 Hi CD4+ T cells (C) with representative primary data. Mean values with SE based on 3 donors/experiments. A, No statistically significant differences, B, C, statistically significant differences (P<0.05) for wt EBOV as compared to mock are indicated with black asterisks, and for the mutated viruses as compared to wt EBOV with red asterisks.
Fig 8
Fig 8. VP35 and VP24 IID block phosphorylation of TCR complex-associated adapters and downstream signal molecules.
CD4+ T cells were co-cultured with DCs infected with wt EBOV or the mutated viruses for 4 days, and TCR signal transduction was analyzed by Western blotting of phosphorylated adapter molecules and downstream signaling molecules (A) and anti-apoptotic Bcl-2 family members and the SRC molecule (B). C. Map of signaling cascades associated with MHC-TCR engagement that promotes transduction of survival signals in the absence of antigen-dependent proliferation according reference [95]; the map itself is adapted from Cell Signaling Technology web site (http://www.cellsignal.com). As shown in panel A, basal phosphorylation of adapter molecules was observed following culture of autologous CD4+ T-cells with mock-DCs. The identified VP24 and VP35 IID-mediated blocks and stimulations of signal transduction are shown; note that block of signal transduction is associated with altered DCs function.
Fig 9
Fig 9. VP35 IID inhibits B-cell function and differentiation.
Percentages of CD19+CD27+IgD- memory B-cells (A), CD19+CD27-IgD-IgM-CD20-CD38++ class switched memory B-cells (B), CD19+CD27+/DimIgD-IgM-CD20-CD38- post class-switched memory B-cells (C), and CD19+CD38+CD138+ plasma cells (D) in PBMCs infected with wt EBOV or the mutant viruses. The subgating strategies are shown in S11B and S11C Fig. Average values based on 3 donors with SE shown. Statistically significant differences (P<0.05) for the mutated viruses as compared to wt EBOV are shown with red asterisks. Flow plots are representative primary data from one donor. Percentages of cell populations are indicated in each quadrant with that used for graphs at the left are bolded.
Fig 10
Fig 10. VP35 and VP24 IID suppress activation of NK cells.
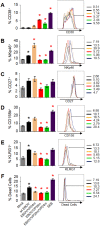
PBMCs were infected with wt EBOV or the mutated viruses, and gated CD56+CD3- NK cells were analyzed for the indicated markers of activation, inhibition or dead cell markers: A, CD38; B, NKp46; C, CD27; D, CD158b; E KLRG1; F, Live/Dead. Mean values based on 3 donors with SE are shown. Statistically significant differences (P<0.05) for wt EBOV as compared to mock are indicated with black asterisks, and for the mutated viruses as compared to wt EBOV are indicated with red asterisks. Percentages of cell populations are indicated next to each histogram.

Similar articles

Cited by

References

    1. CDC. 2014 Ebola Outbreak in West Africa—Case Counts 2016. http://www.cdc.gov/vhf/ebola/outbreaks/2014-west-africa/case-counts.html.
    1. Feldmann H, Sanchez A, Geisbert TW. Filoviridae: Marburg and Ebola Viruses. 6 ed Knipe DM, Howley PM, editors. Philadelphia: Lippincott Williams & Wilkins; 2013. 923–56 p.
    1. Geisbert TW, Hensley LE, Gibb TR, Steele KE, Jaax NK, Jahrling PB. Apoptosis induced in vitro and in vivo during infection by Ebola and Marburg viruses. Lab Invest. 2000;80(2):171–86. - PubMed
    1. Reed DS, Hensley LE, Geisbert JB, Jahrling PB, Geisbert TW. Depletion of peripheral blood T lymphocytes and NK cells during the course of ebola hemorrhagic Fever in cynomolgus macaques. Viral Immunol. 2004;17(3):390–400. 10.1089/vim.2004.17.390 - DOI - PubMed
    1. Ebihara H, Rockx B, Marzi A, Feldmann F, Haddock E, Brining D, et al. Host response dynamics following lethal infection of rhesus macaques with Zaire ebolavirus. J Infect Dis. 2011;204 Suppl 3:S991–9. - PMC - PubMed

MeSH terms

Substances