

National Performance Benchmarks for Modern Screening Digital Mammography: Update from the Breast Cancer Surveillance Consortium
- PMID: 27918707
- PMCID: PMC5375631
- DOI: 10.1148/radiol.2016161174
National Performance Benchmarks for Modern Screening Digital Mammography: Update from the Breast Cancer Surveillance Consortium
Abstract
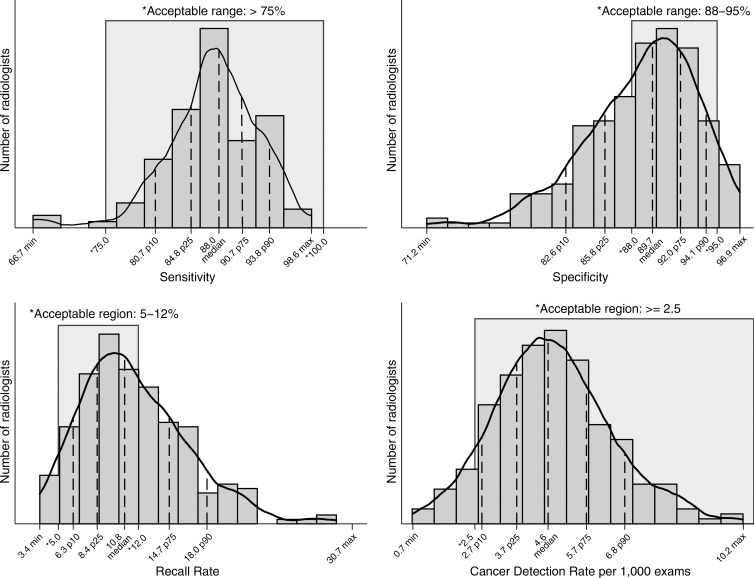
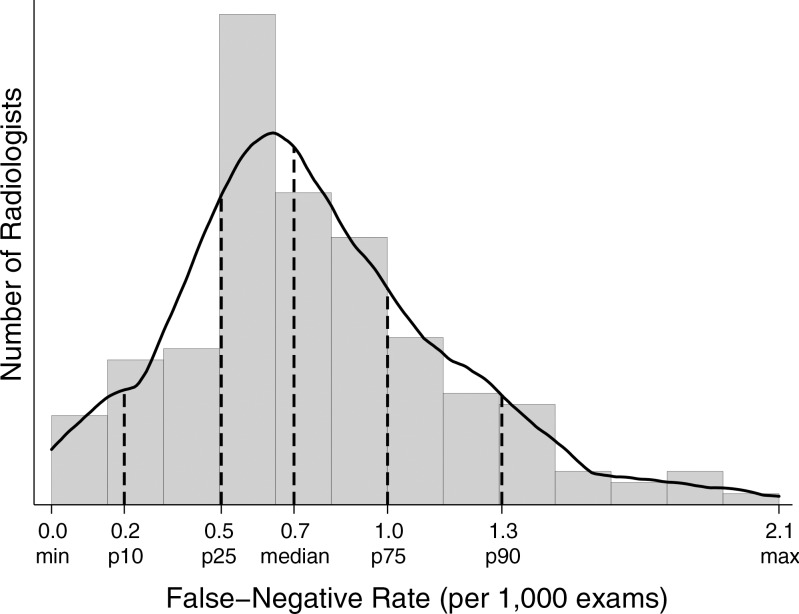
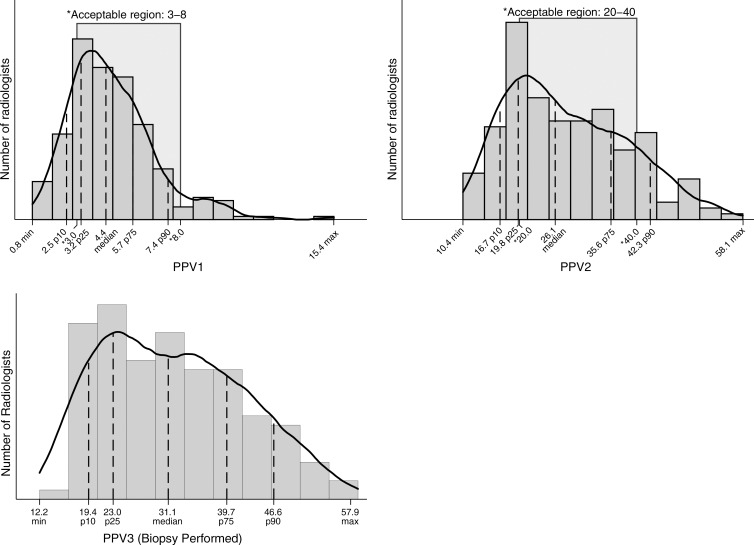
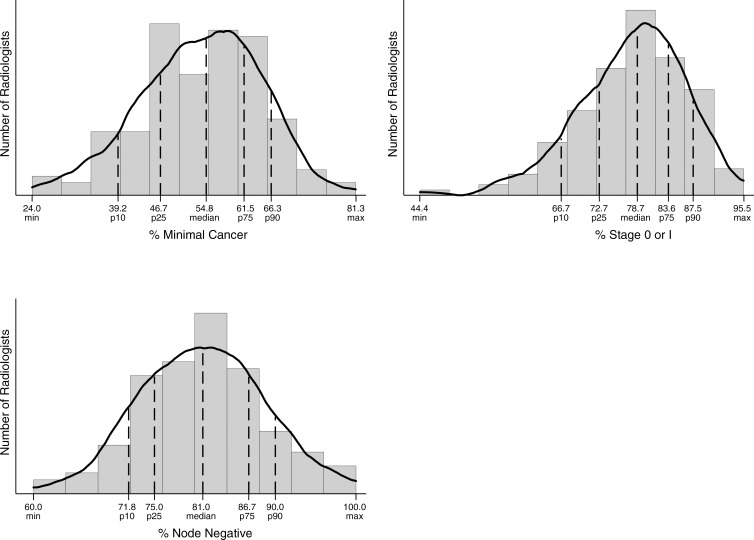
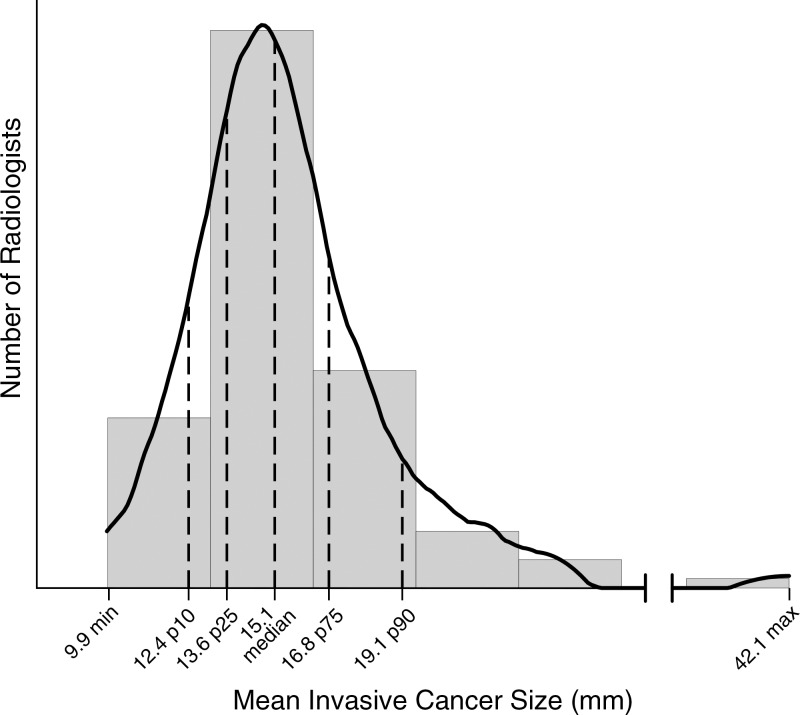
Purpose To establish performance benchmarks for modern screening digital mammography and assess performance trends over time in U.S. community practice. Materials and Methods This HIPAA-compliant, institutional review board-approved study measured the performance of digital screening mammography interpreted by 359 radiologists across 95 facilities in six Breast Cancer Surveillance Consortium (BCSC) registries. The study included 1 682 504 digital screening mammograms performed between 2007 and 2013 in 792 808 women. Performance measures were calculated according to the American College of Radiology Breast Imaging Reporting and Data System, 5th edition, and were compared with published benchmarks by the BCSC, the National Mammography Database, and performance recommendations by expert opinion. Benchmarks were derived from the distribution of performance metrics across radiologists and were presented as 50th (median), 10th, 25th, 75th, and 90th percentiles, with graphic presentations using smoothed curves. Results Mean screening performance measures were as follows: abnormal interpretation rate (AIR), 11.6 (95% confidence interval [CI]: 11.5, 11.6); cancers detected per 1000 screens, or cancer detection rate (CDR), 5.1 (95% CI: 5.0, 5.2); sensitivity, 86.9% (95% CI: 86.3%, 87.6%); specificity, 88.9% (95% CI: 88.8%, 88.9%); false-negative rate per 1000 screens, 0.8 (95% CI: 0.7, 0.8); positive predictive value (PPV) 1, 4.4% (95% CI: 4.3%, 4.5%); PPV2, 25.6% (95% CI: 25.1%, 26.1%); PPV3, 28.6% (95% CI: 28.0%, 29.3%); cancers stage 0 or 1, 76.9%; minimal cancers, 57.7%; and node-negative invasive cancers, 79.4%. Recommended CDRs were achieved by 92.1% of radiologists in community practice, and 97.1% achieved recommended ranges for sensitivity. Only 59.0% of radiologists achieved recommended AIRs, and only 63.0% achieved recommended levels of specificity. Conclusion The majority of radiologists in the BCSC surpass cancer detection recommendations for screening mammography; however, AIRs continue to be higher than the recommended rate for almost half of radiologists interpreting screening mammograms. © RSNA, 2016 Online supplemental material is available for this article.
Figures
Comment in
-
2017 Breast Cancer Surveillance Consortium Reports on Interpretive Performance at Screening and Diagnostic Mammography: Welcome New Data, But Not as Benchmarks for Practice.Radiology. 2017 Apr;283(1):7-9. doi: 10.1148/radiol.2017170181. Epub 2017 Feb 28. Radiology. 2017. PMID: 28244802 No abstract available.
-
Mammography Performance Benchmarks in an Era of Value-based Care.Radiology. 2017 Aug;284(2):605-607. doi: 10.1148/radiol.2017170638. Radiology. 2017. PMID: 28723290 Free PMC article. No abstract available.
Similar articles
-
National Performance Benchmarks for Modern Diagnostic Digital Mammography: Update from the Breast Cancer Surveillance Consortium.Radiology. 2017 Apr;283(1):59-69. doi: 10.1148/radiol.2017161519. Epub 2017 Feb 28. Radiology. 2017. PMID: 28244803 Free PMC article.
-
National Performance Benchmarks for Screening Digital Breast Tomosynthesis: Update from the Breast Cancer Surveillance Consortium.Radiology. 2023 May;307(4):e222499. doi: 10.1148/radiol.222499. Epub 2023 Apr 11. Radiology. 2023. PMID: 37039687 Free PMC article.
-
Performance benchmarks for screening mammography.Radiology. 2006 Oct;241(1):55-66. doi: 10.1148/radiol.2411051504. Radiology. 2006. PMID: 16990671
-
Harmonizing Breast Cancer Screening Recommendations: Metrics and Accountability.AJR Am J Roentgenol. 2018 Feb;210(2):241-245. doi: 10.2214/AJR.17.18704. Epub 2017 Oct 18. AJR Am J Roentgenol. 2018. PMID: 29045178 Review.
-
Supplemental Screening for Breast Cancer in Women With Dense Breasts: A Systematic Review for the U.S. Preventive Service Task Force [Internet].Rockville (MD): Agency for Healthcare Research and Quality (US); 2016 Jan. Report No.: 14-05201-EF-3. Rockville (MD): Agency for Healthcare Research and Quality (US); 2016 Jan. Report No.: 14-05201-EF-3. PMID: 26866210 Free Books & Documents. Review.
Cited by
-
Optimal Screening in Breast Cancer Survivors With Dense Breasts on Mammography.J Clin Oncol. 2020 Nov 20;38(33):3833-3840. doi: 10.1200/JCO.20.01641. Epub 2020 Jul 24. J Clin Oncol. 2020. PMID: 32706641 Free PMC article.
-
Integrating age, BMI, and serum N-glycans detected by MALDI mass spectrometry to classify suspicious mammogram findings as benign lesions or breast cancer.Sci Rep. 2022 Dec 2;12(1):20801. doi: 10.1038/s41598-022-25401-0. Sci Rep. 2022. PMID: 36460712 Free PMC article.
-
Nonhomogeneous Markov chain for estimating the cumulative risk of multiple false positive screening tests.Biometrics. 2022 Sep;78(3):1244-1256. doi: 10.1111/biom.13484. Epub 2021 May 18. Biometrics. 2022. PMID: 33939839 Free PMC article.
-
Ultrafast MR imaging findings of 2 different subtypes in a male patient with bilateral breast cancer.Radiol Case Rep. 2024 Jan 15;19(4):1366-1370. doi: 10.1016/j.radcr.2023.12.043. eCollection 2024 Apr. Radiol Case Rep. 2024. PMID: 38288048 Free PMC article.
-
Breast imaging, breast surgery, and cancer genetics in the age of COVID-19.Cancer. 2020 Oct 15;126(20):4466-4472. doi: 10.1002/cncr.33113. Epub 2020 Aug 4. Cancer. 2020. PMID: 32749697 Free PMC article.
References
-
- Wolfe JN. Mammography as a screening examination in breast cancer. Radiology 1965;84:703–708. - PubMed
-
- Independent UK Panel on Breast Cancer Screening . The benefits and harms of breast cancer screening: an independent review. Lancet 2012;380(9855):1778–1786. - PubMed
-
- Shapiro S, Venet W, Strax P, Venet L, Roeser R. Ten- to fourteen-year effect of screening on breast cancer mortality. J Natl Cancer Inst 1982;69(2):349–355. - PubMed
-
- Andersson I, Janzon L, Sigfússon BF. Mammographic breast cancer screening: a randomized trial in Malmö, Sweden. Maturitas 1985;7(1):21–29. - PubMed
-
- Tabár L, Fagerberg CJ, Gad A, et al. . Reduction in mortality from breast cancer after mass screening with mammography: randomised trial from the Breast Cancer Screening Working Group of the Swedish National Board of Health and Welfare. Lancet 1985;1(8433):829–832. - PubMed
Publication types
MeSH terms
Grants and funding
LinkOut - more resources
Full Text Sources
Other Literature Sources
Medical
