. 2016 Dec 13;113(50):E8178-E8186.
doi: 10.1073/pnas.1614347113. Epub 2016 Dec 1.

Distinct cortical and striatal actions of a β-arrestin-biased dopamine D2 receptor ligand reveal unique antipsychotic-like properties

Affiliations

Distinct cortical and striatal actions of a β-arrestin-biased dopamine D2 receptor ligand reveal unique antipsychotic-like properties

Nikhil M Urs et al. Proc Natl Acad Sci U S A. .

Abstract

The current dopamine (DA) hypothesis of schizophrenia postulates striatal hyperdopaminergia and cortical hypodopaminergia. Although partial agonists at DA D2 receptors (D2Rs), like aripiprazole, were developed to simultaneously target both phenomena, they do not effectively improve cortical dysfunction. In this study, we investigate the potential for newly developed β-arrestin2 (βarr2)-biased D2R partial agonists to simultaneously target hyper- and hypodopaminergia. Using neuron-specific βarr2-KO mice, we show that the antipsychotic-like effects of a βarr2-biased D2R ligand are driven through both striatal antagonism and cortical agonism of D2R-βarr2 signaling. Furthermore, βarr2-biased D2R agonism enhances firing of cortical fast-spiking interneurons. This enhanced cortical agonism of the biased ligand can be attributed to a lack of G-protein signaling and elevated expression of βarr2 and G protein-coupled receptor (GPCR) kinase 2 in the cortex versus the striatum. Therefore, we propose that βarr2-biased D2R ligands that exert region-selective actions could provide a path to develop more effective antipsychotic therapies.

Keywords: antipsychotics; arrestin; biased signaling; dopamine D2R; fast-spiking interneurons.


Conflict of interest statement

P.O. is an employee and shareholder at Pfizer, Inc. M.G.C. has received compensation from Lundbeck as a member of their Psychopharmacology Advisory Board and is a consultant for Omeros Corp. M.G.C. also owns equity in Acadia Pharmaceuticals.

Figures
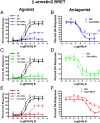
Fig. 1.
Fig. 1.
Effects of GRK2 overexpression on the agonist or antagonist profile of D2R ligands in HEK293 cells. (A) ARI, (C) UNC9975A (75A), and (E) UNC9994A (94A) were tested in agonist mode in a D2R-βarr2 interaction BRET assay with endogenous GRK2 (solid lines) or GRK2 overexpression (dashed lines) compared with DA (black lines) in HEK293 cells. D2R-βarr2 BRET antagonist assays for (B) ARI, (D) UNC99975A (75A), and (F) UNC9994A (94A) with endogenous GRK2 (solid lines) or overexpressed GRK2 (dashed lines) levels in HEK293 cells. Data are presented as inhibition of the total DA response (mean ± SEM).
Fig. S1.
Fig. S1.
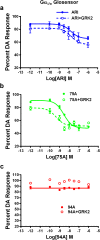
D2R-Gαi/o GloSensor antagonist assay. In vitro D2R-Gαi/o GloSensor antagonist assays for (A) ARI, (B) UNC99975A (75A), and (C) UNC9994A (94A) with endogenous GRK2 (solid lines) or overexpressed GRK2 (dashed lines) levels in HEK293 cells. Data are presented as inhibition of the total DA response (mean ± SEM).
Fig. 2.
Fig. 2.
Cortical and striatal expression patterns of βarr2 and GRK2 as well as D2R PFC agonism. (A) Western blot analysis from WT mice probed with antibodies to GRK2, βarr2, and βarr1 and GAPDH in cortex (CTX) compared with STR and (B) quantification of Western blot band intensities normalized to GAPDH (loading control; Ps < 0.05). IHC images of mouse brain sections (cortical-striatal) stained with antibodies to (C) βarr2 and (D) GRK2. Locomotor responses to (E) bilateral local PFC injection 1 μg per side quinpirole (QUIN), UNC9994A (94A), and aripiprazole (ARI) in WT mice followed by systemic PCP injection (6 mg/kg i.p.; n = 8–11) or (F) bilateral local PFC injection of 1 μg per side UNC9994A (94A) with or without cpd101 (0.5 μg per side) in WT mice followed by systemic PCP injection (6 mg/kg i.p.; n = 8–10). *P < 0.05, compared with VEH + PCP; **P < 0.01, compared with VEH + PCP; #P < 0.05, compared with 94A + PCP.
Fig. S2.
Fig. S2.
GRK2 and βarr2 expression in PFC compared with STR in human postmortem tissue and effect of GRK2 inhibition on D2R-βarr2 BRET agonist responses. (A) Human tissue samples from caudate and PFC (area 10) were lysed and analyzed by Western blot. Antibodies to GRK2, βarr1/2 (a2ct), and GAPDH (loading control) were used (n = 6). (B) Quantification of βarr1, βarr2, and GRK2 levels in PFC (blue bars) and caudate (red bars) normalized to GAPDH. Caudate levels were set to 100%. *P < 0.05, compare caudate with PFC using a two-way ANOVA (Bonferroni) test; **P < 0.01, compare caudate with PFC using a two-way ANOVA (Bonferroni) test. (C) DA and 94A were tested in agonist mode in a D2R-βarr2 BRET assay with endogenous GRK2 (solid lines) or GRK2 overexpression (dashed lines) in HEK293 cells with or without pretreatment of GRK2/3 inhibitor 10 μM cpd101 or VEH for 1 h. Cpd101 inhibits the D2-βarr2 interaction with endogenous GRK2 levels or inhibits the increased potency of D2-βarr2 interaction with GRK2 overexpression.
Fig. 3.
Fig. 3.
Distinct contribution of striatal and cortical D2Rs to the behavioral effects of PCP. (A) D2f/f mice were injected with a control GFP virus (GFP-AAV) or Cre-AAV in the PFC and 3 wk later, injected systemically with either saline (SAL) or PCP (4 mg/kg i.p.); their locomotor response was recorded (n = 8–9). **P < 0.01; ***P < 0.001 compare D2f/f pfcGFP-AAV with D2f/f pfcCre-AAV (PCP) using a three-way RMANOVA [genotype × treatment × time interaction, F(29, 720) = 1.947, P < 0.01] with post hoc Bonferroni tests. (B) D2f/f mice were crossed with A2aCre mice (D2f/f A2aCre) to delete D2Rs in the STR and injected systemically with either SAL or PCP (6 mg/kg i.p.); their locomotor response was recorded (n = 8–13). **P < 0.01; ***P < 0.001 compare D2f/f with D2f/f A2aCre (PCP) using a three-way RMANOVA [genotype × treatment × time interaction, F(29, 840) = 3.722, P < 0.001] with post hoc Bonferroni tests.
Fig. S3.
Fig. S3.
AAV injection in PFC of D2f/f mice. Representative image of coronal sections of (A) mCherry-Cre and (B) GFP AAV injection in the PFC of D2f/f mice. (C) Stereotaxic atlas image (Paxinos and Franklin Atlas) of coordinates for PFC injection of AAVs in D2f/f mice.
Fig. 4.
Fig. 4.
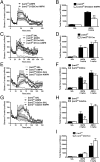
Deletion of βarr2 in D2R-expressing neurons inhibits the AMPH response. (A) βarr2f/f mice were crossed with both D1Cre and D2Cre mice to delete βarr2 in all striatal neurons simultaneously to generate βarr2f/f D1D2Cre and injected with 3 mg/kg AMPH; distance traveled was calculated for 120 min after 30 min of habituation compared with control βarr2f/f mice. Data were analyzed using a two-way RMANOVA test [genotype × time interaction, F(29, 145) = 1.956, P < 0.01] followed by Bonferroni comparisons. (B) Total cumulative distance after injection of saline (SAL) and 3 mg/kg AMPH was calculated for βarr2f/f D1D2Cre and βarr2f/f controls. **P < 0.01, using a two-way ANOVA (Bonferroni) test (n = 7 mice for each genotype). (C) βarr2f/f D1Cre, (E) βarr2f/f D2Cre, or (G) βarr2f/f A2aCre and their respective Cre-negative βarr2f/f controls were injected with SAL or 2 mg/kg AMPH after 30 min of habituation, and locomotor activity was measured for 120 min. Data were analyzed using a three-way RMANOVA for D1βarr2 [genotype × time interaction, F(29, 116) = 0.4045, P = 0.9967; genotype × treatment interaction, F(1, 480) = 3.463, P = 0.0634], A2aβarr2 [genotype × time interaction, F(87, 435) = 4.760; genotype × treatment interaction, F(1, 600) = 47.15, P < 0.001], and D2βarr2 [genotype × time interaction, F(87, 261) = 3.324, P < 0.001; genotype × treatment interaction, F(1, 360) = 66.37, P < 0.001] with post hoc Bonferroni tests. (D, F, and H) Total cumulative (120 min) postinjection distance after SAL or 2 or 3 mg/kg AMPH; n = 8 mice for each group. *P < 0.05, compared with βarr2f/f using a two-way ANOVA (Bonferroni) test; **P < 0.01, compared with βarr2f/f using a two-way ANOVA (Bonferroni) test. (I) ChAT-Cre mice were crossed with βarr2f/f mice to generate βarr2f/f ChATCre or βarr2f/f controls, and total cumulative distance after postinjection of SAL or 2 or 3 mg/kg AMPH was calculated; n = 8 mice for each group.
Fig. S4.
Fig. S4.
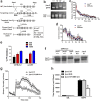
Generation and characterization of floxed βarr2 mice. (A) Schematic of targeting strategy to generate the βarr2f/f mice (SI Materials and Methods). (B) PCR confirmation of floxed alleles from βarr2+/+ (WT), βarr2+/f (floxed heterozygote), and βarr2f/f (floxed homozygote) mice crossed with CMV-Cre mice. IL-2 is used as an internal control. (C) Basal locomotor activity in βarr2f/f mice compared with C57BL/6J mice. (D) Time spent in the center of the open field (center time) as a measure of anxiety-like behavior in βarr2f/f mice compared with C57BL/6J mice. (E) Basal PPI in βarr2f/f mice (SI Materials and Methods); n = 7–9 mice. Mice were tested with 4-, 8-, or 12-dB noise above a 64-dB white noise background. (F) Western blot analysis of cortical tissue from βarr2f/f CMV-Cre but not βarr2+/+ CMV-Cre or βarr2+/f CMV-Cre mice shows deletion of βarr2. (G) Locomotor response of controls (βarr2f/f) and βarr2f/f CMV-Cre mice injected with 3 mg/kg AMPH after 30 min of habituation. Data were analyzed by two-way RMANOVA [genotype × time interaction, F(29, 232) = 3.393, P < 0.0001] with post hoc Bonferroni comparison. (H) Postinjection total distance traveled after 3 mg/kg AMPH injection in controls (n = 4) and βarr2f/f CMV-Cre mice (n = 7) or βarr1KO (n = 4) mice. $P < 0.0001, compared with βarr2f/f using a two-way ANOVA (Bonferroni) test.
Fig. S5.
Fig. S5.
IHC and TRAP analysis to confirm deletion of βarr2 in neuron-specific KO mice. (A) Representative images of IHC analyses for YFP used as a reporter for Cre recombinase activity (YFP; red) and D2 neuron marker enkephalin (ENK) (green) show no colocalization in D1Cre (Top) but show colocalization in D2Cre (Middle) and A2aCre mice (Bottom), confirming appropriate neuron-specific expression of Cre recombinase in all lines. (B) Representative image of IHC staining for βarr2 in the STR shows labeling of morphologically identified cholinergic interneurons (arrows) in D1 βarr2f/f and A2a βarr2f/f but not D2 βarr2f/f mice, consistent with presence of Cre recombinase expression in cholinergic interneurons in only D2Cre mice. (C) Representative image of IHC staining for βarr2 (green) and Cre recombinase (red) shows deletion of βarr2 (arrows) in all lines. (D) A2aCre+ βarr2f/f mice and A2Acre+ βarr2 wt/wt mice were crossed with a Cre-sensitive TRAP mouse line to isolate mRNA from D2R+ MSNs. Real-time quantitative PCR for D2 MSN markers (Drd2 and Penk) and D1 MSN markers (Drd1 and Tac1) confirmed respective enrichment and depletion of these markers from TRAP isolates. D2 MSNs from βarr2 wt/wt mice (red bars) and βarr2f/f mice (blue bars) have similar expression of D2R MSN genes. In contrast, D2R+ MSNs from βarr2f/f mice have a clear decrease in expression for βarr2 as measured via Taqman probes for exon 2 of the Arrb2 gene. These observations indicate that, as expected, recombination has occurred specifically in the D2R+ MSN population and resulted in loss of exon 2 of the Arrb2 transcript.
Fig. 5.
Fig. 5.
UNC9994A loses its antipsychotic-like activity in response to AMPH in D2R+ and A2aR+ neuron-specific βarr2KO mice. Control mice (βarr2f/f) and (A) βarr2f/f D1Cre, (C) βarr2f/f D2Cre, or (E) βarr2f/f A2aCre mice were injected with vehicle (VEH); the antipsychotics haloperidol (HAL; 0.5 mg/kg), ARI (0.5 mg/kg), or clozapine (CLOZ; 2 mg/kg); or βarr2-biased drugs UNC9994A (94A; 2 mg/kg) or UNC9975A (75A; 0.5 mg/kg) followed by 3 mg/kg AMPH injection. Total cumulative distance postinjection of AMPH for 120 min was calculated and shows that all APDs and drugs, except UNC9994A, are able to inhibit the AMPH response in the βarr2f/f D2Cre and βarr2f/f A2aCre mice. **P < 0.01, compared with respective VEH control; $P < 0.001, compared with respective VEH control; #P < 0.05 compare 94A between genotypes using a two-way ANOVA (Bonferroni) test; ##P < 0.01 compare 94A between genotypes using a two-way ANOVA (Bonferroni) test. Representative graphs of AMPH inhibition by 94A for (B) βarr2f/f D1Cre, (D) βarr2f/f D2Cre, or (F) βarr2f/f A2aCre mice compared with controls (βarr2f/f); n = 8 mice for each group. Data were analyzed by two-way RMANOVA [genotype × treatment interaction, F(1, 420) = 2.053, P = 0.1526, for βarr2f/f D1Cre; genotype × treatment interaction, F(29, 420) = 3.858, P < 0.05, for βarr2f/f A2aCre; and genotype × treatment interaction, F(29, 420) = 2.285, P < 0.01, for βarr2f/f D2Cre] with post hoc Bonferroni tests.
Fig. 6.
Fig. 6.
UNC9994A loses antipsychotic-like activity to PCP in D2R+ but not A2aR+ neuron-specific βarr2KO mice. Control mice (βarr2f/f) and (A) βarr2f/f D1Cre, (B) βarr2f/f D2Cre, or (C) βarr2f/f A2aCre mice were injected with VEH, ARI (0.5 mg/kg), or βarr-biased drugs UNC9994A (94A; 2 mg/kg) and UNC9975A (75A; 0.5 mg/kg) followed by 6 mg/kg PCP injection 10 min later. Total cumulative distance postinjection of PCP for 120 min was calculated; n = 8–10 mice for each group. One mouse each from the βarr2f/f A2aCre 94A- and 75A-treated groups was discarded based on criterion set in Statistical Analyses. *P < 0.05, compared with respective VEH controls using a two-way ANOVA (Bonferroni) test; $P < 0.001, compared with respective VEH controls using a two-way ANOVA (Bonferroni) test. (D) mCherry-Cre AAV8 was injected into the PFC of βarr2f/f A2aCre (PFC + STR βarr2KO) or βarr2f/f (PFC βarr2KO) mice followed by injection 3 wk later with 94A (2 mg/kg i.p.) and PCP (6 mg/kg i.p.). Total cumulative distance postinjection of PCP for 120 min was calculated; n = 8 mice for each group. *P < 0.05, compared with respective VEH controls using a two-way ANOVA (Bonferroni) test.
Fig. S6.
Fig. S6.
Representative coronal images of βarr2f/f A2aCre mice injected with mCherry-CRE AAV in PFC. (A) Coronal vibratome sections were taken from fixed brains of A2aβarr2 mice injected with virus, and images were taken using a Zeiss Axiozoom microscope (Left). Stereotaxic location (Paxinos and Franklin Atlas) of virus injection site in the PFC (Right). (B) IHC analysis showing deletion of βarr2 in PFC of A2aβarr2−/− mice injected with mCherry-Cre AAV. Upper shows lack of βarr2 in areas labeled for Cre in PFC, and Lower shows Cre (arrows) and βarr2 labeling at the cellular level.
Fig. 7.
Fig. 7.
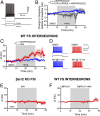
UNC9994A has βarr2- and GRK2-dependent, agonist-like effects in prefrontal GABAergic FSIs. (A) Sample recording from a prefrontal FSI showing responses to hyperpolarizing or depolarizing current injection. (B) ARI (10 μM) increases action potential firing in prefrontal FSIs [+6.2 ± 1.4 Hz (relative to a 10-min predrug baseline) after 20 min of exposure; n = 6]. Bath application of eticlopride (10 μM) prevented the increase in excitability elicited by ARI (−2.08 ± 2.2 Hz after 15 min of exposure of eticlopride + ARI; n = 4). **P < 0.01. (C) UNC9994A (94A; 10 μM) elicited a greater increase in FSI excitability (+25.86 ± 3.8 Hz after 20 min of exposure; n = 4) compared with ARI. Data were analyzed using a standard two-way ANOVA test. **P < 0.01. (D) Sample responses of FSIs to depolarizing current pulses in various pharmacologic conditions showing an increase in FSI excitability after bath application of 94A or ARI. (E) The 94A-mediated increase in FSI excitability is absent in βarr2KO mice (+1.32 ±1.68 Hz after 20 min of exposure; n = 4). (F) Bath application of the GRK2 inhibitor cpd101 (30 μM) prevented the increase in excitability elicited by 94A (−2.3 ± 3.2 Hz after 20 min of exposure of cpd101 + 94A; n = 5). FS, fast spiking.
Fig. S7.
Fig. S7.
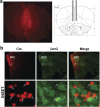
Elevated expression levels of GRK2 in PV+ neurons in the PFC. IHC images of mouse brain sections (PFC) stained with antibodies to GRK2 (red) and PV (green) and colocalization (merge).
Fig. 8.
Fig. 8.
UNC9994A lacks agonist-like effects in the STR. (A) Sample recording from striatal MSNs showing responses to hyperpolarizing or depolarizing current injection. (B) The D2R agonist quinpirole (10 μM) decreases action potential firing in striatal MSNs (−6.8 ± 2.2 Hz relative to a 10-min predrug baseline after 20 min of exposure; n = 8). UNC9994A (94A; 10 μM) elicits a significantly smaller decrease in MSN excitability compared with quinpirole (−2.6 ± 1.0 Hz after 20 min of exposure; n = 8). Data were analyzed using a standard two-way ANOVA test. *P = 0.0137. (C) Representative traces of striatal MSNs to depolarizing current pulses in control conditions and after quinpirole or 94A application.

Similar articles

Cited by

References

    1. Hopkins AL, Groom CR. The druggable genome. Nat Rev Drug Discov. 2002;1(9):727–730. - PubMed
    1. Allen JA, Roth BL. Strategies to discover unexpected targets for drugs active at G protein-coupled receptors. Annu Rev Pharmacol Toxicol. 2011;51:117–144. - PubMed
    1. Benovic JL, Strasser RH, Caron MG, Lefkowitz RJ. Beta-adrenergic receptor kinase: Identification of a novel protein kinase that phosphorylates the agonist-occupied form of the receptor. Proc Natl Acad Sci USA. 1986;83(9):2797–2801. - PMC - PubMed
    1. Lohse MJ, Benovic JL, Codina J, Caron MG, Lefkowitz RJ. beta-Arrestin: A protein that regulates beta-adrenergic receptor function. Science. 1990;248(4962):1547–1550. - PubMed
    1. Ferguson SS, et al. Role of beta-arrestin in mediating agonist-promoted G protein-coupled receptor internalization. Science. 1996;271(5247):363–366. - PubMed

Publication types

MeSH terms