. 2017 Feb 28;45(4):1714-1730.
doi: 10.1093/nar/gkw1114.

Different enhancer classes in Drosophila bind distinct architectural proteins and mediate unique chromatin interactions and 3D architecture

Affiliations

Different enhancer classes in Drosophila bind distinct architectural proteins and mediate unique chromatin interactions and 3D architecture

Caelin Cubeñas-Potts et al. Nucleic Acids Res. .

Abstract

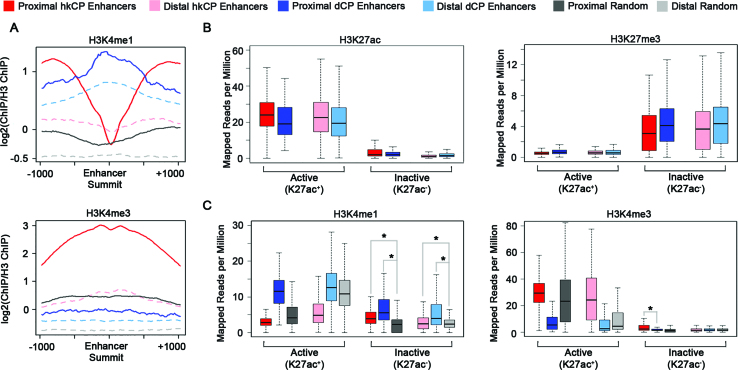
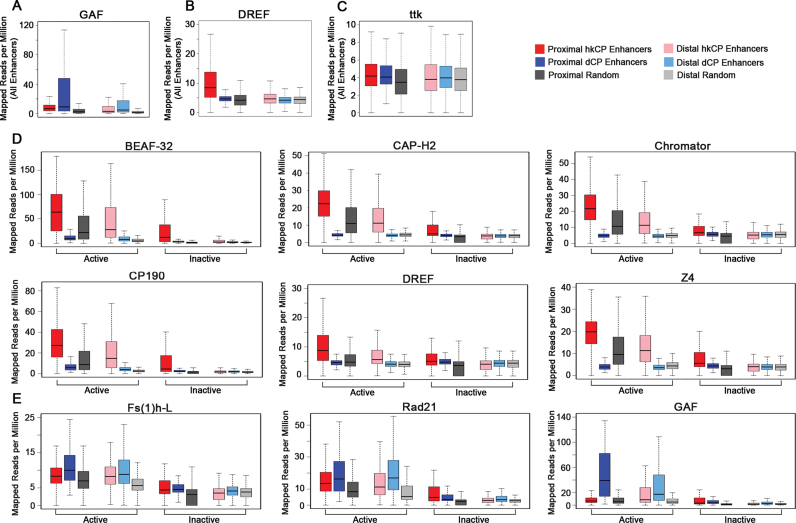
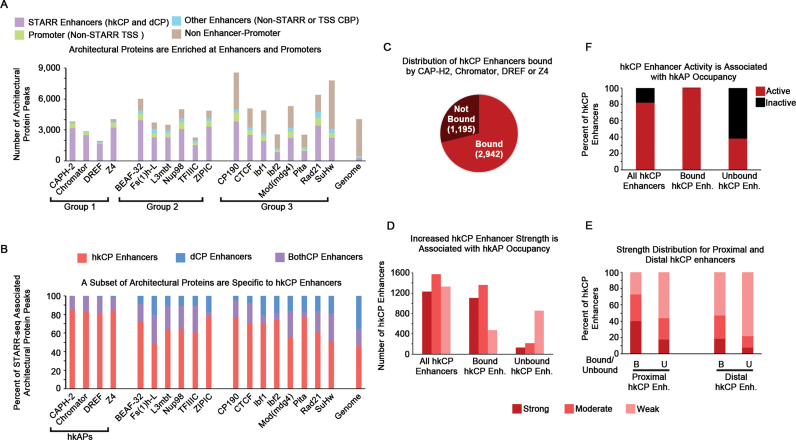
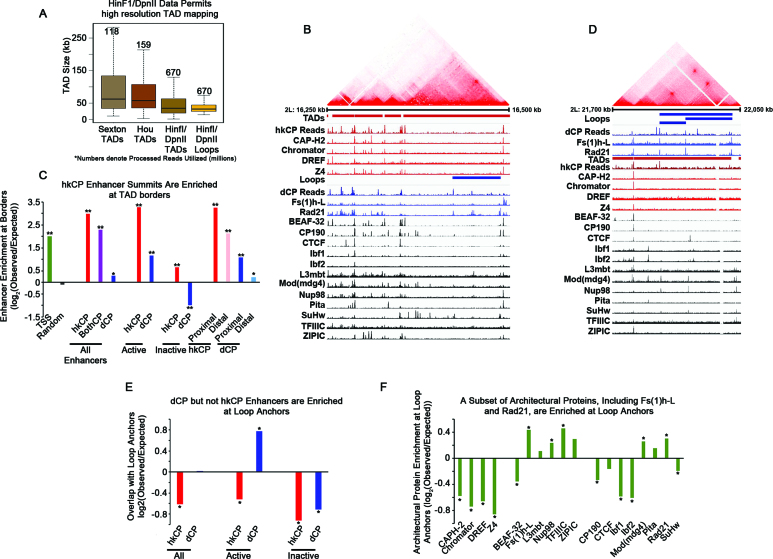
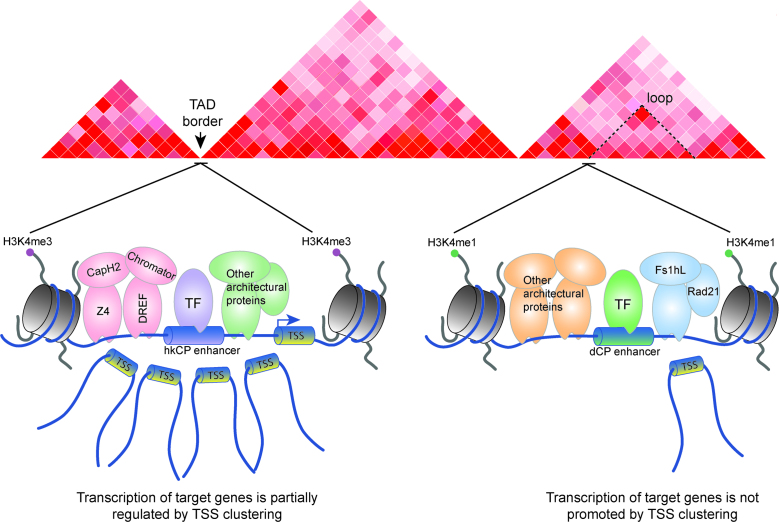
Eukaryotic gene expression is regulated by enhancer-promoter interactions but the molecular mechanisms that govern specificity have remained elusive. Genome-wide studies utilizing STARR-seq identified two enhancer classes in Drosophila that interact with different core promoters: housekeeping enhancers (hkCP) and developmental enhancers (dCP). We hypothesized that the two enhancer classes are occupied by distinct architectural proteins, affecting their enhancer-promoter contacts. By evaluating ChIP-seq occupancy of architectural proteins, typical enhancer-associated proteins, and histone modifications, we determine that both enhancer classes are enriched for RNA Polymerase II, CBP, and architectural proteins but there are also distinctions. hkCP enhancers contain H3K4me3 and exclusively bind Cap-H2, Chromator, DREF and Z4, whereas dCP enhancers contain H3K4me1 and are more enriched for Rad21 and Fs(1)h-L. Additionally, we map the interactions of each enhancer class utilizing a Hi-C dataset with <1 kb resolution. Results suggest that hkCP enhancers are more likely to form multi-TSS interaction networks and be associated with topologically associating domain (TAD) borders, while dCP enhancers are more often bound to one or two TSSs and are enriched at chromatin loop anchors. The data support a model suggesting that the unique architectural protein occupancy within enhancers is one contributor to enhancer-promoter interaction specificity.


Figures

Figure 1.
Figure 1.
dCP and hkCP Enhancers Have Distinct H3K4 Methylation. (A) Profile plots depicting ChIP-seq read density for H3K4me1 and H3K4me3 at enhancer summits ±1 kb. Y-axis depicts log2(ChIP Reads/H3 Reads). (B and C) Boxplots depicting the mapped reads per million for H3K27ac, H3K27me3, H3K4me1 and H3K4me3 within the 501 bp enhancer categories. Four separate randomized data categories are shown: TSS-proximal and overlapping an H3K27ac peak, TSS-proximal and not overlapping an H3K27ac peak, TSS-distal and overlapping an H3K27ac peak, and TSS-distal and not overlapping an H3K27ac peak. ChIP-seq data shown is from Kc167 cells. Asterisks denote a P value < 0.009 (Student's t-test).
Figure 2.
Figure 2.
dCP and hkCP Enhancers Contain Distinct Subcomplexes of Architectural Proteins. Boxplots depicting the mapped reads per million from Kc167 cells for (A) GAF, (B) DREF, (C) ttk within each 501 bp enhancer class. Boxplots depicting the mapped reads per million for the architectural proteins in active and inactive 501 bp enhancer classes including the architectural proteins (D) unique to hkCP enhancers (BEAF-32, Cap-H2, Chromator, CP190, DREF, Z4) or (E) enriched in dCP enhancers compared to hkCP enhancers (Fs(1)h-L and Rad21). GAF is shown as a control.
Figure 3.
Figure 3.
Architectural Proteins Predominantly Occupy Enhancers/Promoters, with Cap-H2, Chromator, DREF, and Z4 Distinguishing hkCP Enhancers. (A) 401 bp architectural protein peaks were overlapped with either 501 bp STARR-seq enhancers, single bp TSSs, or 401 bp CBP peaks to determine the enhancer–promoter association of each architectural protein. A single base pair overlap was considered a positive association. Groups 1 and 2 proteins are predominantly explained by enhancers and promoters, whereas Group 3 proteins have at least 25% of their sites unexplained by enhancers or promoters. (B) The fraction of STARR-seq enhancer classes that are bound by each architectural protein are shown. BothCP enhancers denote enhancer elements that activate both core promoter elements (hkCP and dCPs). Only Cap-H2, Chromator, DREF and Z4 are unique to hkCP enhancers and are denoted as housekeeping architectural proteins (hkAPs). (C) Pie chart depicting the number of hkCP enhancers bound or unbound by at least one of the hkAPs. (D) The enhancer strength distribution for all hkCP enhancers, hkCP enhancers bound by the hkAPs, and hkCP enhancers not bound by the hkAPs. (E) The distribution of enhancer strength as described in D, except TSS-proximal and –distal hkCP enhancers are analyzed separately. (F) The distribution of enhancer activity for all hkCP enhancers, hkCP enhancers bound by the hkAPs, and hkCP enhancers not bound by the hkAPs. ChIP-seq data shown is derived from Kc167 cells.
Figure 4.
Figure 4.
hkCP Enhancers Mediate More Multi-TSS Clustered Interactions than dCP Enhancers to Increase Transcriptional Output. (A) Bargraph representing the percent of enhancer interactions containing an enhancer in one anchor with a TSS on the opposite anchor. (B) Bargraph representing the percent of enhancer interactions containing an enhancer in one anchor with an enhancer on the opposite anchor. (C) Cytoscape force directed layout depicting the significant interactions on Chromosome 2L. Interaction anchors are represented as dots (anchors containing hkCP enhancers are in red, dCP enhancers are in blue, TSSs are in green and all other anchors are in gray). The distance between dots is representative of interaction frequency. (D) Boxplot representing the distance distribution of interactions between enhancers and TSSs. (E and F) Line graphs highlighting the percent of enhancers interacting with varying numbers of TSSs. (G) Boxplot demonstrating the distribution of TSSs bound per enhancer for all active and inactive enhancer classifications.(H) Boxplot depicting the contact strength (q value is determined by Fit-Hi-C) of active and inactive enhancer–TSS interactions. All chromatin interaction data shown is from Kc167 cells. (I and J) Boxplots depicting the transcriptional output (GRO-seq reads/kb) for the genes interacting with each enhancer class. P values calculated by the Student's t-test. The GRO-seq data shown is derived from S2 cells.
Figure 5.
Figure 5.
hkCP enhancers are associated with TAD borders, while dCP Enhancers are Enriched in Chromatin Loop Anchors. (A) Boxplot depicting the size distribution of TADs or chromatin loops from various publications. Numbers denote the millions of Hi-C reads obtained in each study (23,24). (B) Hi-C data, from Kc167 cells, visualized using Juicebox and aligned with ChIP-seq and STARR-seq reads visualized with the IGV genome browser. Architectural proteins associated with hkCP enhancers are shown in red, those enriched in dCP enhancers are shown in blue, and proteins associated with both enhancer classes are shown in black. (C) Barplot depicting the enrichment of the various classes of enhancers and TAD borders. Overlaps were conducted with enhancer summits and TAD borders ±500 bp (* denotes P-value < 0.05 and ** denotes P-value < 0.005). (D) Hi-C data visualized using Juicebox and aligned with ChIP-seq and STARR-seq reads visualized with the IGV genome browser. Architectural proteins associated with hkCP enhancers are shown in red, those enriched in dCP enhancers are shown in blue, and proteins associated with both enhancer classes are shown in black. (E) Barplot depicting the enrichment of the various classes of enhancers and the 2 kb anchors of chromatin loops. Overlaps were conducted with enhancer summits and the 2 kb anchors (* denotes P-value < 0.02). (F) Barplot depicting the enrichment of the individual architectural proteins and the 2 kb anchors of chromatin loops. Overlaps were conducted with architectural protein peak summits and the 2 kb anchors (* denotes P-value < 0.042).
Figure 6.
Figure 6.
hkCP and dCP enhancers bind unique architectural protein subcomplexes and mediate unique chromatin interactions. Cartoon summarizing the main findings presented in this study. hkCP enhancers are associated with H3K4me3, are bound by architectural proteins including CAP-H2, Chromator, DREF and Z4, are more likely to generate multi-TSS chromatin interactions to promote robust transcription, and are often found at TAD borders. In contrast, dCP enhancers are associated with H3K4me1, are bound by architectural proteins excluding CAP-H2, Chromator, DREF and Z4, are more likely to generate single TSS contacts, and are enriched at chromatin loop anchors.

Similar articles

Cited by

References

    1. Vernimmen D., Bickmore W.A.. The hierarchy of transcriptional activation: from enhancer to promoter. Trends Genet. 2015; 31:696–708. - PubMed
    1. Lagha M., Bothma J.P., Esposito E., Ng S., Stefanik L., Tsui C., Johnston J., Chen K., Gilmour D.S., Zeitlinger J. et al. . Paused Pol II coordinates tissue morphogenesis in the Drosophila embryo. Cell. 2013; 153:976–987. - PMC - PubMed
    1. Kim T.K., Shiekhattar R.. Architectural and functional commonalities between enhancers and promoters. Cell. 2015; 162:948–959. - PMC - PubMed
    1. Akbari O.S., Bae E., Johnsen H., Villaluz A., Wong D., Drewell R.A.. A novel promoter-tethering element regulates enhancer-driven gene expression at the bithorax complex in the Drosophila embryo. Development. 2008; 135:123–131. - PMC - PubMed
    1. Li G., Ruan X., Auerbach R.K., Sandhu K.S., Zheng M., Wang P., Poh H.M., Goh Y., Lim J., Zhang J. et al. . Extensive promoter-centered chromatin interactions provide a topological basis for transcription regulation. Cell. 2012; 148:84–98. - PMC - PubMed

Publication types