. 2016 Nov 28:7:13610.
doi: 10.1038/ncomms13610.

Selective suppression of antisense transcription by Set2-mediated H3K36 methylation

Affiliations

Selective suppression of antisense transcription by Set2-mediated H3K36 methylation

Swaminathan Venkatesh et al. Nat Commun. .

Abstract

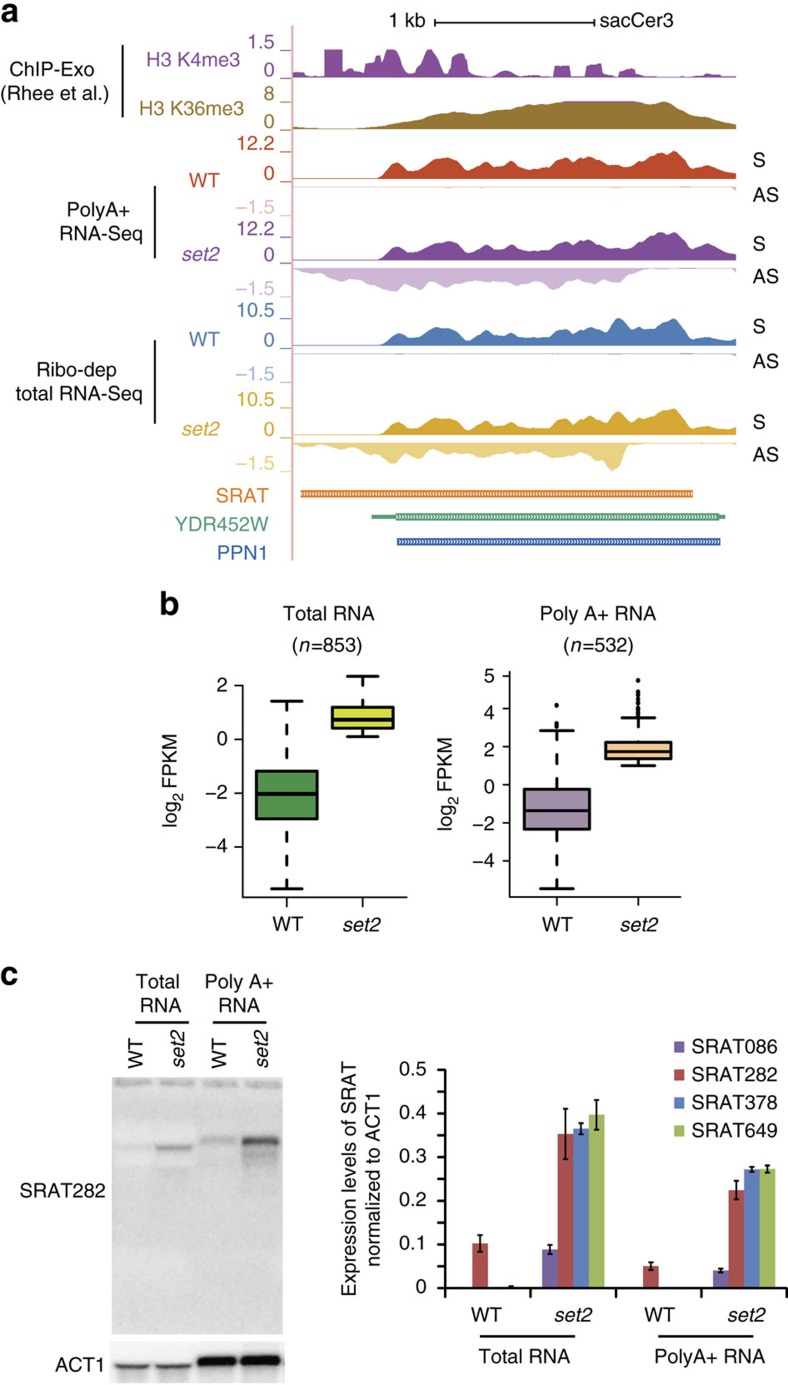
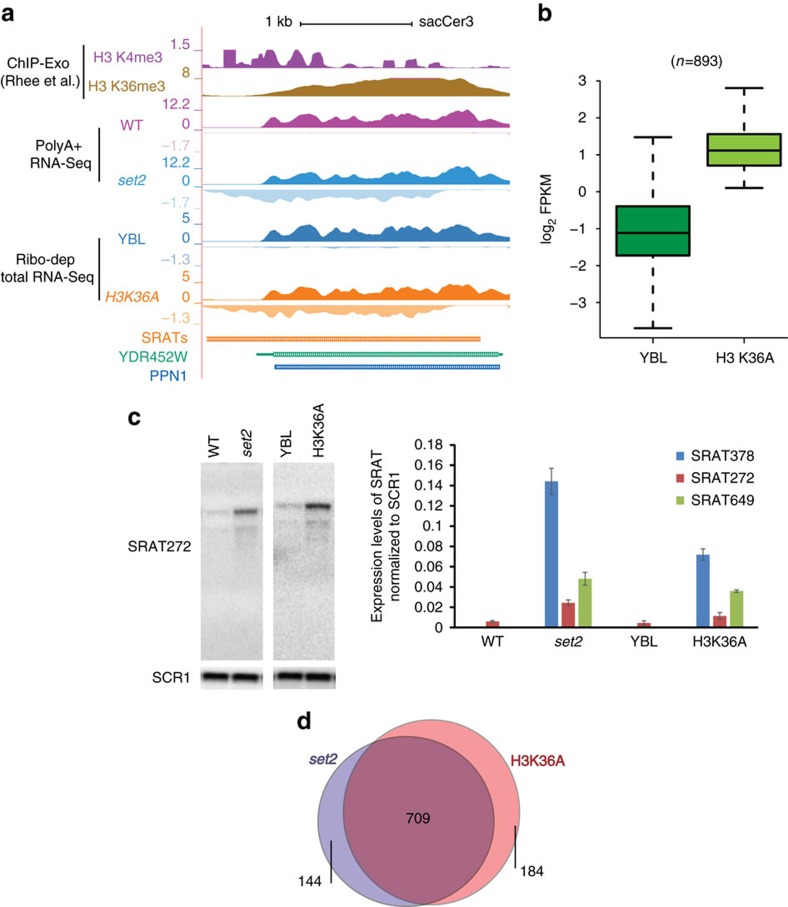
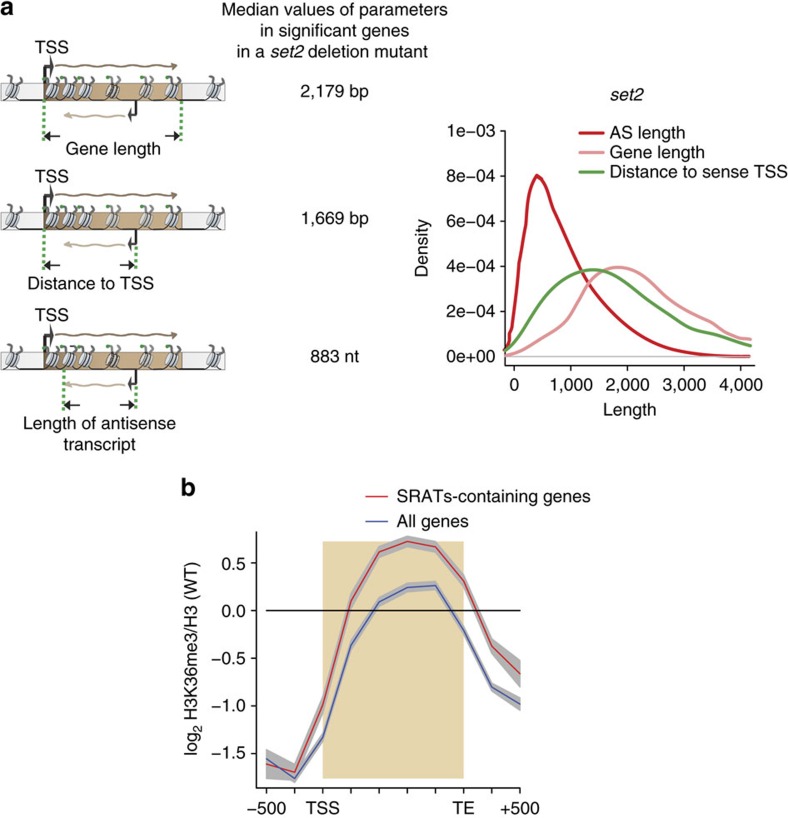
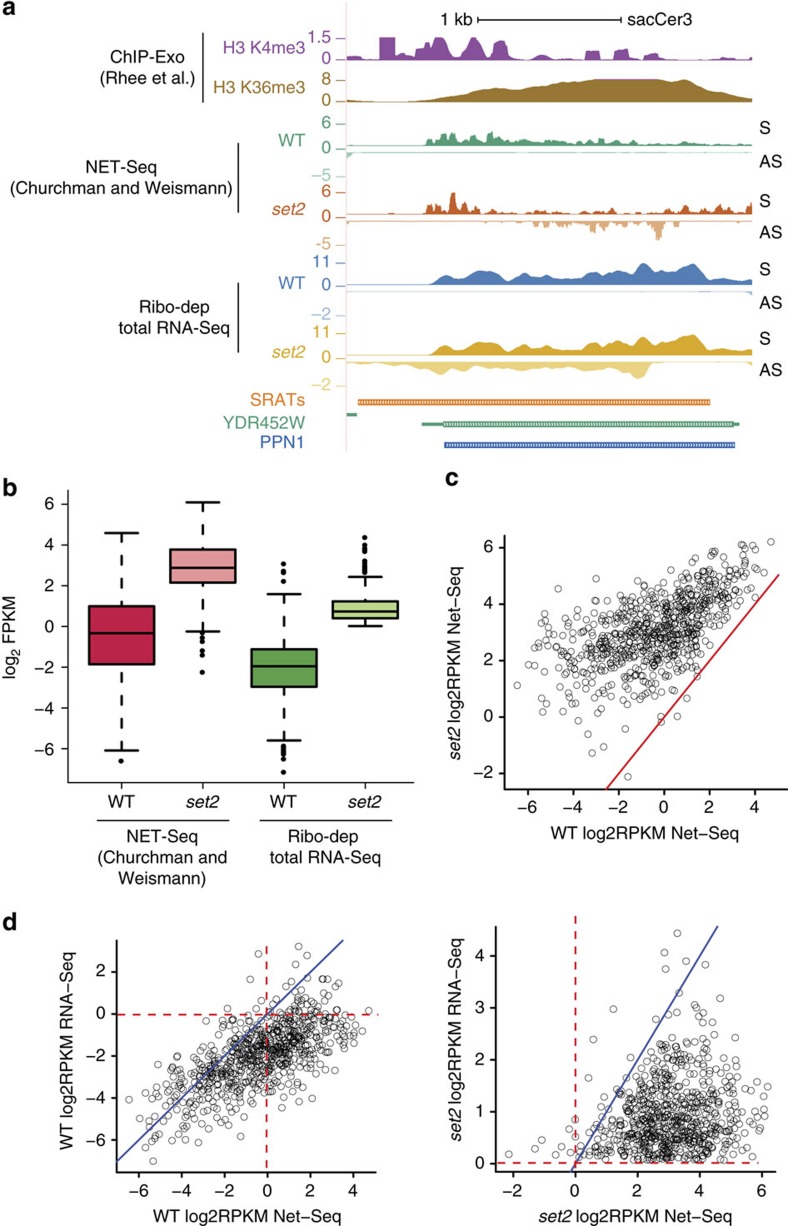
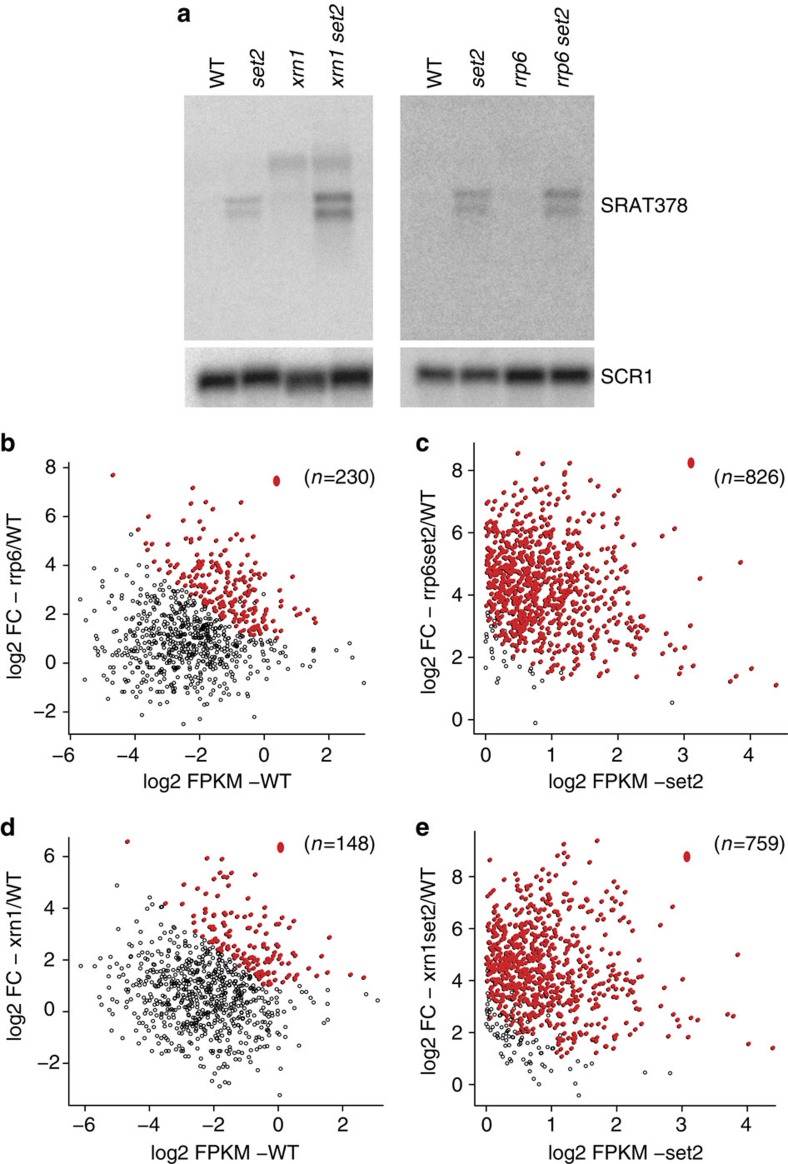
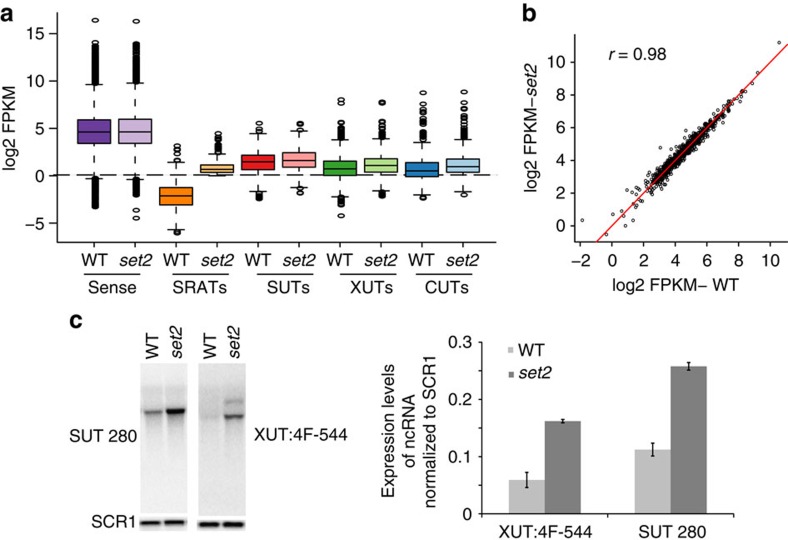
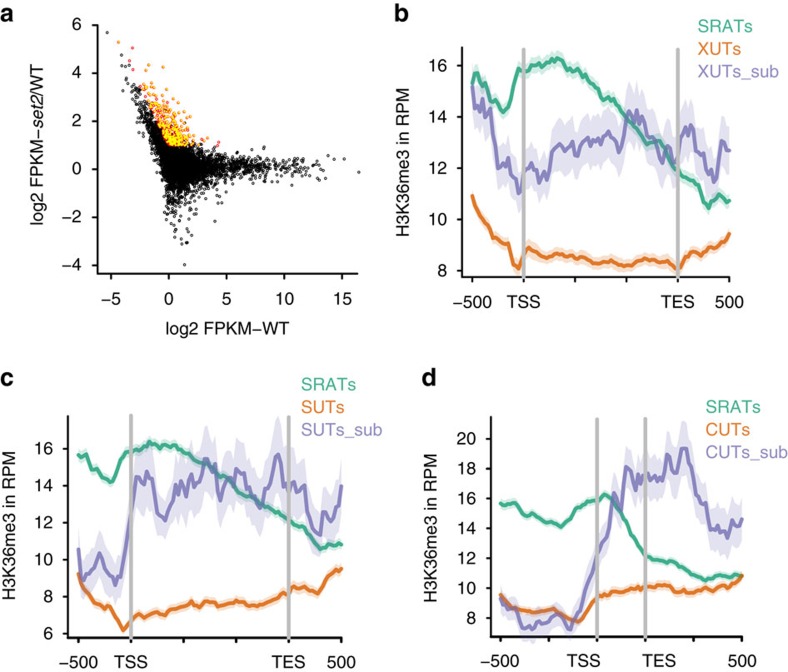
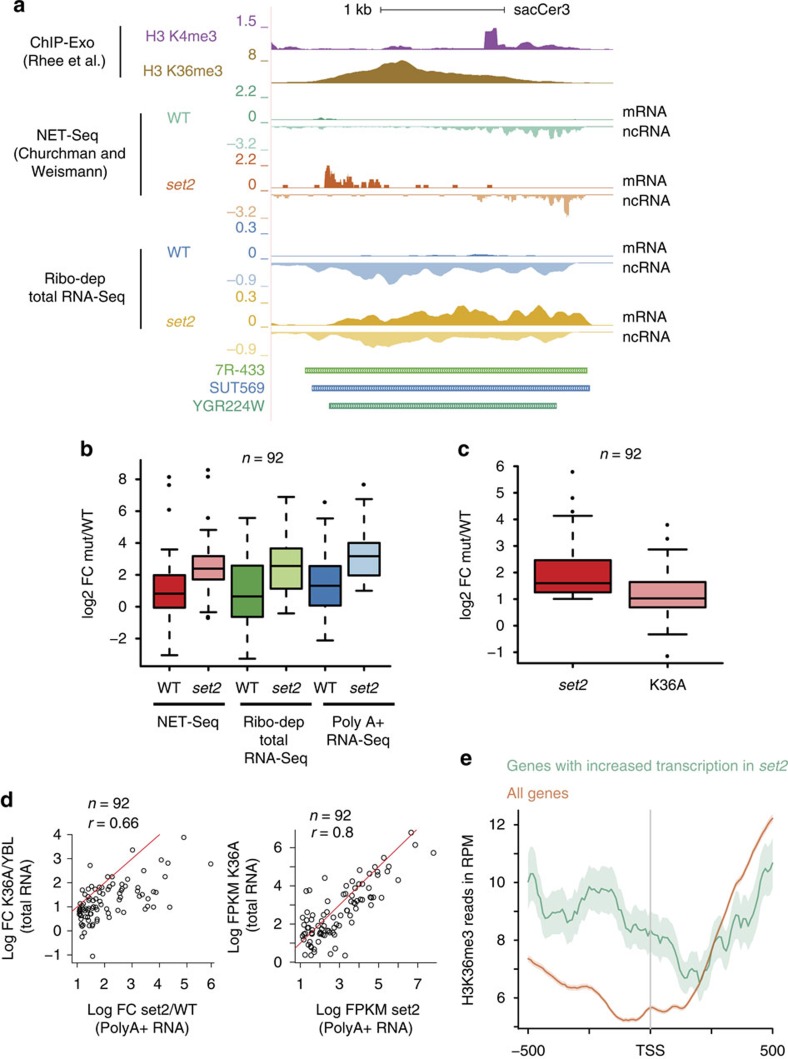
Maintenance of a regular chromatin structure over the coding regions of genes occurs co-transcriptionally via the 'chromatin resetting' pathway. One of the central players in this pathway is the histone methyltransferase Set2. Here we show that the loss of Set2 in yeast, Saccharomyces cerevisiae, results in transcription initiation of antisense RNAs embedded within body of protein-coding genes. These RNAs are distinct from the previously identified non-coding RNAs and cover 11% of the yeast genome. These RNA species have been named Set2-repressed antisense transcripts (SRATs) since the co-transcriptional addition of the H3K36 methyl mark by Set2 over their start sites results in their suppression. Interestingly, loss of chromatin resetting factor Set2 or the subsequent production of SRATs does not affect the abundance of the sense transcripts. This difference in transcriptional outcomes of overlapping transcripts due to a strand-independent addition of H3K36 methylation is a key regulatory feature of interleaved transcriptomes.


Figures

Figure 1
Figure 1. Identification of Set2-repressed antisense transcripts (SRATs).
(a) Genome browser profile showing the distribution of modifications and the transcripts (both ribodepleted and Poly A+ RNA) produced in wild-type strain (WT) and the SET2 deletion mutant (set2) over the gene YDR452W (in green including the untranslated regions and the standard name, PPN1 shown in blue denoting the protein-coding region). The modifications are reanalysed tracks from. One replicate for each ChIP-Exo track of H3K4me3 and H3K36me3 distributions are shown here. Each track, an amalgamation of two biological repeats, is separated into the sense strand (S) on top, running from left to right and the antisense strand (AS) in the bottom running from right to left. The SET2 deletion mutant produces enhanced levels of SRAT282 from within the gene body. (b) Boxplot showing the abundance of the SRATs (log2 FPKM) in the WT and SET2 deletion mutants from total RNA (left) and poly-A-enriched RNA (right). The total number of SRATs used in the analysis is denoted above each plot. (c). (Left) Strand-specific northern blot probing for SRAT282 using either total RNA or polyadenylated RNA in wild-type (WT) and SET2 deletion mutant (set2). ACT1 is used as a loading control. The aberrant mobility of the SRAT between the total RNA and polyA-enriched samples is due to large amounts of rRNAs in the total RNA samples. (Right) Quantitation of strand-specific northern blots indicating the expression level of selected SRATs, normalized to the level of ACT1 in total RNA and polyadenylated mRNA. Error bars denote the s.e.m. of three independent repeats.
Figure 2
Figure 2. Loss of H3K36 methylation de-represses SRAT production.
(a) Genome browser profile showing the histone modifications and transcripts (poly A+ and ribodepleted) produced in wild-type strain (WT, YBL) and the SET2 (set2) and H3K36A mutants (H3K36A) over the gene YDR452W (PPN1). Each track, an amalgamation of two biological repeats, is separated into the sense strand (S) on top, running from left to right and the antisense strand (AS) in the bottom running from right to left. The H3K36A mutant produces the antisense transcript, SRAT282, as observed in the set2 mutant. (b) Boxplot showing the abundance of significant SRATs (log2 FPKM) in the WT (YBL) and H3K36A mutant. The total number of SRATs used in the analysis is denoted above the plot. (c) (Left) Strand-specific northern blot probing for SRAT282 using total RNA in either the respective wild-type (WT-BY4741 or YBL), SET2 deletion mutant (set2) and the H3K36A mutant strain. SCR1 is used as a loading control. (Right) Quantitation of strand-specific northern blots indicating the expression level of selected SRATs, normalized to the level of SCR1 in total RNA in the indicated mutants. Error bars denote the s.e.m. of three to four independent repeats. (d) Venn diagram showing the overlap of statistically significant SRATs produced upon deletion of SET2 (set2) with those in an H3K36A point mutant.
Figure 3
Figure 3. SRATs initiate and terminate within the coding regions of genes.
(a) On the left, a schematic representation of the three parameters used to define the SRAT relative to the coding region of genes—Gene length, distance to transcription start site (TSS) and the antisense length, and the median values based on our analysis from two independent repeats (see Methods). On the right, the density plots of the three parameters for the SRATs and their associated genes in the SET2 deletion mutant. (b). Gene average plot of the distribution of H3K36me3 normalized to H3 occupancy levels over a metagene from three independent biological repeats. The blue line traces the distribution over all coding genes in yeast, while the red line traces the distribution of H3K36me3 over the protein-coding genes that produce SRATs in a SET2 deletion mutant (n=853). The grey shading around each line indicates the 95% confidence interval.
Figure 4
Figure 4. SRATs are actively transcribed by RNA Pol II in the wild-type strain and enhanced in the SET2 deletion strain.
(a) Genome browser profile showing the histone modifications and transcripts (NET-Seq and ribodepleted) produced in wild-type strain (WT) and the SET2 (set2) over the gene YDR452W (PPN1). Each track is separated into the sense strand (S) on top, running from left to right and the antisense strand (AS) in the bottom running from right to left. The set2 mutant produces the antisense transcript, SRAT282, which is also seen in the NET-Seq lanes. (b). Boxplot comparing the abundance of a common set of 763 SRATs (log2 FPKM) in the WT and Set2 deletion (set2) mutants for the NET-Seq and our ribodepleted RNA-Seq datasets (an amalgamation of two biological repeats). (c) Scatter plots denoting the NET-Seq transcript abundance of 763 SRATs in the WT versus the set2 mutant. The respective values from the SET2 deletion mutant are distributed on the y axis, while those from the WT are distributed on the x axis. The red line denotes the values where x=y. (d). Scatter plots comparing the NET-Seq transcript abundance with that of RNA-seq of 763 SRATs in the WT (left) and set2 mutant (right) strains. The respective values from the RNA seq are distributed on the y axis, while those from the NET-Seq data are distributed on the x axis. The blue line denotes the values where x=y. The red horizontal and vertical lines denote x or y=0, which corresponds to an RPKM of 1. Points lying to the right of the vertical lines denote enrichment in the NET-Seq sample, while points lying above the horizontal red line denote enrichment in the RNA-Seq samples.
Figure 5
Figure 5. SRAT stability enhanced upon loss of RNA-degradation machinery.
(a) (Left) Strand-specific northern blot probing for SRAT378 using total RNA in either the wild-type (WT-BY4741), SET2 deletion mutant (set2), RRP6 deletion mutant (rrp6) and the RRP6 SET2 double deletion mutant (rrp6set2). (Right) Strand-specific northern blot probing for SRAT378 using total RNA in either the wild-type (WT-BY4741), SET2 deletion mutant (set2), XRN1 deletion mutant (xrn1) and the XRN1 SET2 double deletion mutant (xrn1set2). SCR1 is used as a loading control. (be). Scatter plots comparing the strand-specific RNA-Seq transcript abundance of SRAT a strain compared with the fold change in SRAT expression in the indicated mutant strains. The fold change of RNA abundance in indicated mutants with respect to the wild-type are distributed on the y axis, while RNA abundance of the wild-type (WT) (b,d) or SET2 deletion (set2) (c,e) are distributed on the x axis. The red dots indicate the SRATs that are significantly upregulated in the mutant on the y axis. The total number of SRATs used in the analysis is denoted above each plot.
Figure 6
Figure 6. Effect of SET2 deletion on ncRNA production in yeast.
(a). Boxplots showing the abundance of the different RNA species as indicated, produced in either the wild-type or SET2 deletion yeast strain. (b) Scatter plot with the abundance of sense protein-coding genes (Log2 FPKM) of wild-type in the x axis and SET2 deletion mutant in the y axis. The red line denotes the values where x=y. The Spearman coefficient of correlation is provided. (c) (Left) Strand-specific northern blot probing for SUT280 and the XUT, 4F-544 using total RNA in either the respective wild-type or SET2 deletion mutant (set2). SCR1 is used as a loading control. (Right) Quantitation of strand-specific northern blots indicating the expression level of selected ncRNAs, normalized to the level of SCR1 in total RNA under the indicated conditions. Error bars denote the s.e.m. of three independent repeats.
Figure 7
Figure 7. Expression of overlapping sense genes suppresses antisense transcription by H3K36 methylation.
(a) Scatter plot denoting the wild-type transcript abundance of CUTs, SUTs and XUTs on the x axis, and the fold change of each of these transcripts in the SET2 deletion mutant on the y axis. Transcripts that are significantly upregulated using the defined cutoffs are marked as red circles (n=347). Transcripts that have an overlapping protein-coding gene overlapping the ncRNA are marked with filled yellow circles. (b). Metagene plots denoting the distribution of H3K36 me3 mark over the promoters and gene bodies of SRATs (green), XUTs (orange), and a subset of XUTs (XUT_sub, n=121) that are upregulated upon loss of Set2 (blue). (c) Metagene plots denoting the distribution of H3K36 me3 mark over the promoters and gene bodies of SRATs (green), SUTs (orange) and a subset of SUTs (SUT_sub, n=48) that are upregulated upon loss of Set2 (blue). (d) Metagene plots denoting the distribution of H3K36 me3 mark over the promoters and gene bodies of SRATs (green), CUTs (orange) and a subset of CUTs (CUT_sub, n=52) that are upregulated upon loss of Set2 (blue). The lighter areas surrounding the traces in all three figures denote the 95% confidence interval of the traces.
Figure 8
Figure 8. Interleaved transcription suppresses gene expression by adding H3 K36 methylation.
(a) Genome browser profile showing the histone modifications and transcripts (NET-Seq and ribodepleted) produced in wild-type strain (WT) and the SET2 (set2) over the gene AZR1. The modifications are reanalysed tracks from ref. . Each transcript track is separated into the sense strand (mRNA) on top, running from left to right and the antisense strand (ncRNA) in the bottom running from right to left. Both strain produce a SUT or XUT that encompasses the AZR1 gene. Loss of Set2-mediated H3K36me3 results in a de-repression of the protein-coding transcript. (b) Boxplot showing the abundance (RNA-Seq and PolyA-enriched RNA-Seq) or transcription levels (NET-Seq) in sense gene expression (log2 FC mut/WT) of 92 genes with overlapping transcripts in the SET2 deletion (set2) versus the wild-type for each data set as indicated. (c) Boxplot showing the fold-change in sense gene expression (log2 FC mut/WT) of 92 genes with overlapping transcripts in the SET2 deletion (set2) and H3K36A (K36A) mutants for each data set as indicated. (d) Scatter plots either denoting the fold change (Log FC) in gene expression (left) or the transcript abundance (Log FPKM, right) of the 92 protein-coding genes with overlapping transcripts. The respective values from the SET2 deletion mutant are distributed on the x axis, while those from the H3K36A mutant are distributed on the y axis. The red line denotes the values where x=y. The Spearman coefficient of correlation is provided. (e) Metagene plots denoting the distribution of H3K36me3 mark around the promoters (upto 500 bp on either side) of all protein-coding genes (orange) or a subset of genes that are upregulated upon loss of Set2 (green). The lighter areas surrounding the traces denote the 95% confidence interval of the traces.

Similar articles

Cited by

References

    1. Berretta J. & Morillon A. Pervasive transcription constitutes a new level of eukaryotic genome regulation. EMBO. Rep. 10, 973–982 (2009). - PMC - PubMed
    1. Djebali S. et al.. Landscape of transcription in human cells. Nature 489, 101–108 (2012). - PMC - PubMed
    1. David L. et al.. A high-resolution map of transcription in the yeast genome. Proc. Natl Acad Sci. USA 103, 5320–5325 (2006). - PMC - PubMed
    1. Xu Z. et al.. Bidirectional promoters generate pervasive transcription in yeast. Nature 457, 1033–1037 (2009). - PMC - PubMed
    1. Neil H. et al.. Widespread bidirectional promoters are the major source of cryptic transcripts in yeast. Nature 457, 1038–1042 (2009). - PubMed

Publication types