Social status alters immune regulation and response to infection in macaques
- PMID: 27885030
- PMCID: PMC5498102
- DOI: 10.1126/science.aah3580
Social status alters immune regulation and response to infection in macaques
Abstract
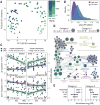
Social status is one of the strongest predictors of human disease risk and mortality, and it also influences Darwinian fitness in social mammals more generally. To understand the biological basis of these effects, we combined genomics with a social status manipulation in female rhesus macaques to investigate how status alters immune function. We demonstrate causal but largely plastic social status effects on immune cell proportions, cell type-specific gene expression levels, and the gene expression response to immune challenge. Further, we identify specific transcription factor signaling pathways that explain these differences, including low-status-associated polarization of the Toll-like receptor 4 signaling pathway toward a proinflammatory response. Our findings provide insight into the direct biological effects of social inequality on immune function, thus improving our understanding of social gradients in health.
Copyright © 2016, American Association for the Advancement of Science.
Figures


Comment in
-
Proinflammatory primates.Science. 2016 Nov 25;354(6315):967-968. doi: 10.1126/science.aal3170. Science. 2016. PMID: 27884990 No abstract available.
Similar articles
-
Social history and exposure to pathogen signals modulate social status effects on gene regulation in rhesus macaques.Proc Natl Acad Sci U S A. 2020 Sep 22;117(38):23317-23322. doi: 10.1073/pnas.1820846116. Epub 2019 Oct 14. Proc Natl Acad Sci U S A. 2020. PMID: 31611381 Free PMC article.
-
Innate immunity.Eur J Dermatol. 2002 May-Jun;12(3):224-7. Eur J Dermatol. 2002. PMID: 11978560
-
Social status alters chromatin accessibility and the gene regulatory response to glucocorticoid stimulation in rhesus macaques.Proc Natl Acad Sci U S A. 2019 Jan 22;116(4):1219-1228. doi: 10.1073/pnas.1811758115. Epub 2018 Dec 11. Proc Natl Acad Sci U S A. 2019. PMID: 30538209 Free PMC article.
-
The regulation of IL-10 production by immune cells.Nat Rev Immunol. 2010 Mar;10(3):170-81. doi: 10.1038/nri2711. Epub 2010 Feb 15. Nat Rev Immunol. 2010. PMID: 20154735 Review.
-
Toll and Toll-like proteins: an ancient family of receptors signaling infection.Rev Immunogenet. 2000;2(3):294-304. Rev Immunogenet. 2000. PMID: 11256741 Review.
Cited by
-
Social and environmental predictors of gut microbiome age in wild baboons.bioRxiv [Preprint]. 2024 Aug 4:2024.08.02.605707. doi: 10.1101/2024.08.02.605707. bioRxiv. 2024. PMID: 39131274 Free PMC article. Preprint.
-
Animal Models Relevant for Geroscience: Current Trends and Future Perspectives in Biomarkers, and Measures of Biological Aging.J Gerontol A Biol Sci Med Sci. 2024 Sep 1;79(9):glae135. doi: 10.1093/gerona/glae135. J Gerontol A Biol Sci Med Sci. 2024. PMID: 39126297 Review.
-
A female-biased gene expression signature of dominance in cooperatively breeding meerkats.Mol Ecol. 2024 Nov;33(21):e17467. doi: 10.1111/mec.17467. Epub 2024 Jul 17. Mol Ecol. 2024. PMID: 39021304
-
Structural Determinants of Health and Markers of Immune Activation and Systemic Inflammation in Sexual Minority Men With and Without HIV.J Urban Health. 2024 Aug;101(4):867-877. doi: 10.1007/s11524-024-00882-8. Epub 2024 Jun 3. J Urban Health. 2024. PMID: 38831153
-
Adolescent environmental enrichment induces social resilience and alters neural gene expression in a selectively bred rodent model with anxious phenotype.bioRxiv [Preprint]. 2024 Apr 11:2023.10.03.560702. doi: 10.1101/2023.10.03.560702. bioRxiv. 2024. Update in: Neurobiol Stress. 2024 May 30;31:100651. doi: 10.1016/j.ynstr.2024.100651. PMID: 38645129 Free PMC article. Updated. Preprint.
References
Publication types
MeSH terms
Substances
Grants and funding
LinkOut - more resources
Full Text Sources
Other Literature Sources
Medical

