. 2016 Dec 13;24(6):807-819.
doi: 10.1016/j.cmet.2016.10.008. Epub 2016 Nov 17.

Glutaminolysis and Fumarate Accumulation Integrate Immunometabolic and Epigenetic Programs in Trained Immunity

Affiliations

Glutaminolysis and Fumarate Accumulation Integrate Immunometabolic and Epigenetic Programs in Trained Immunity

Rob J W Arts et al. Cell Metab. .

Abstract

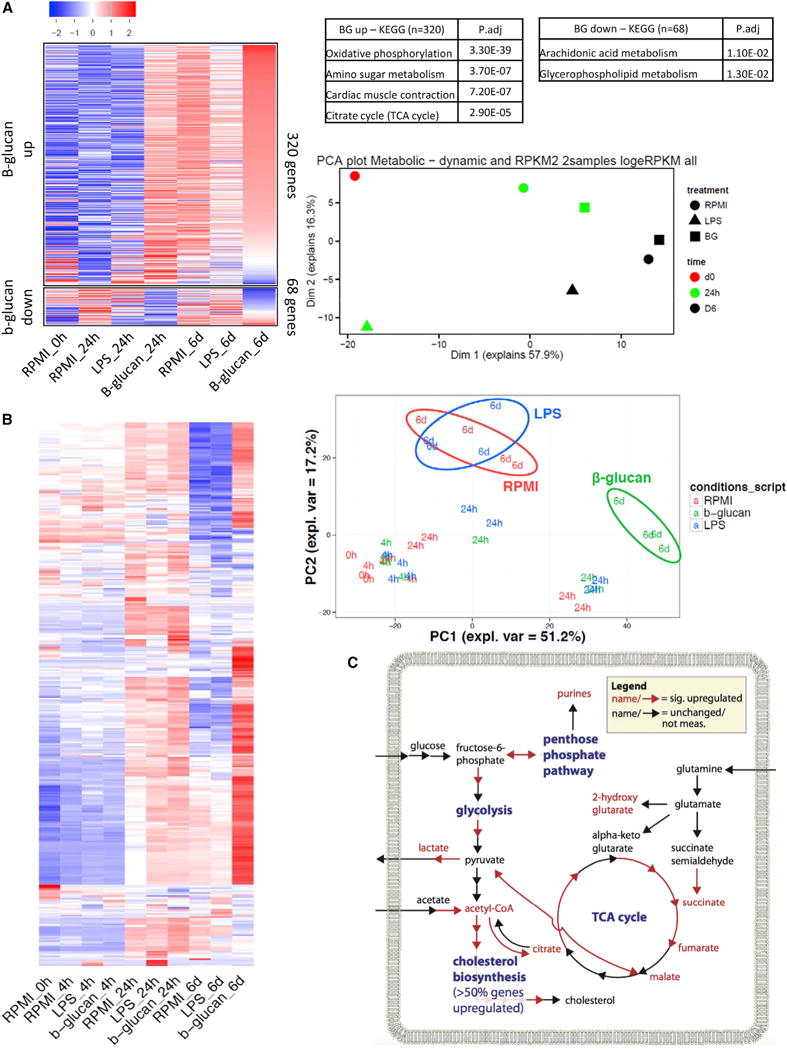
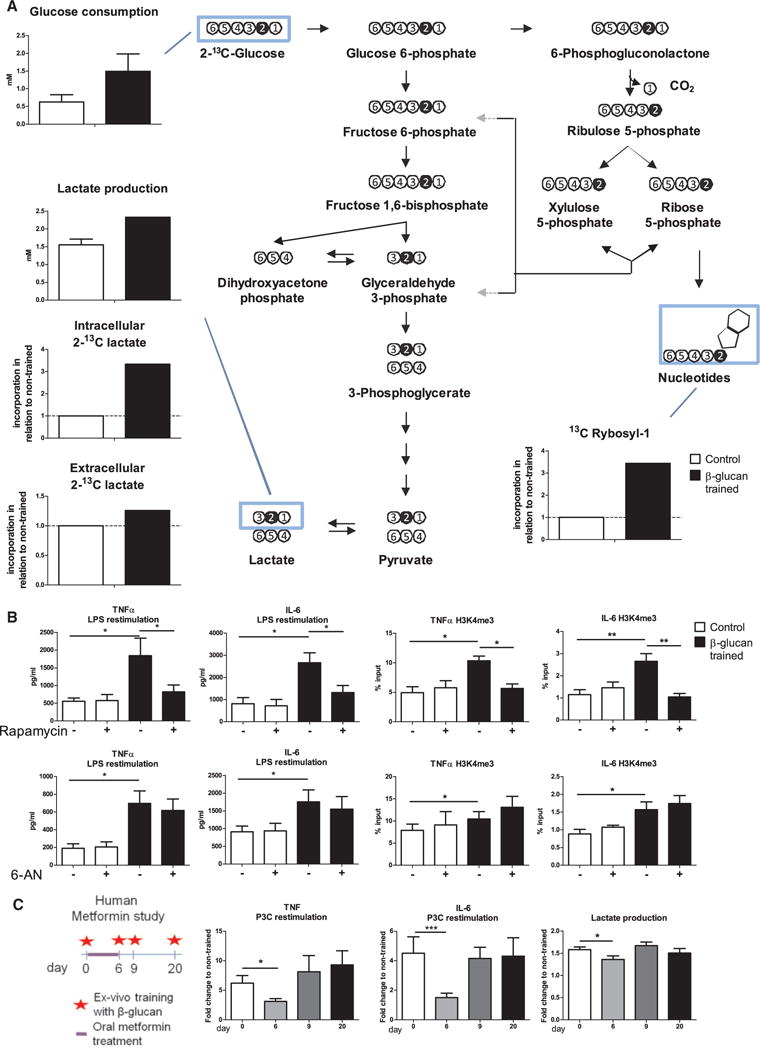
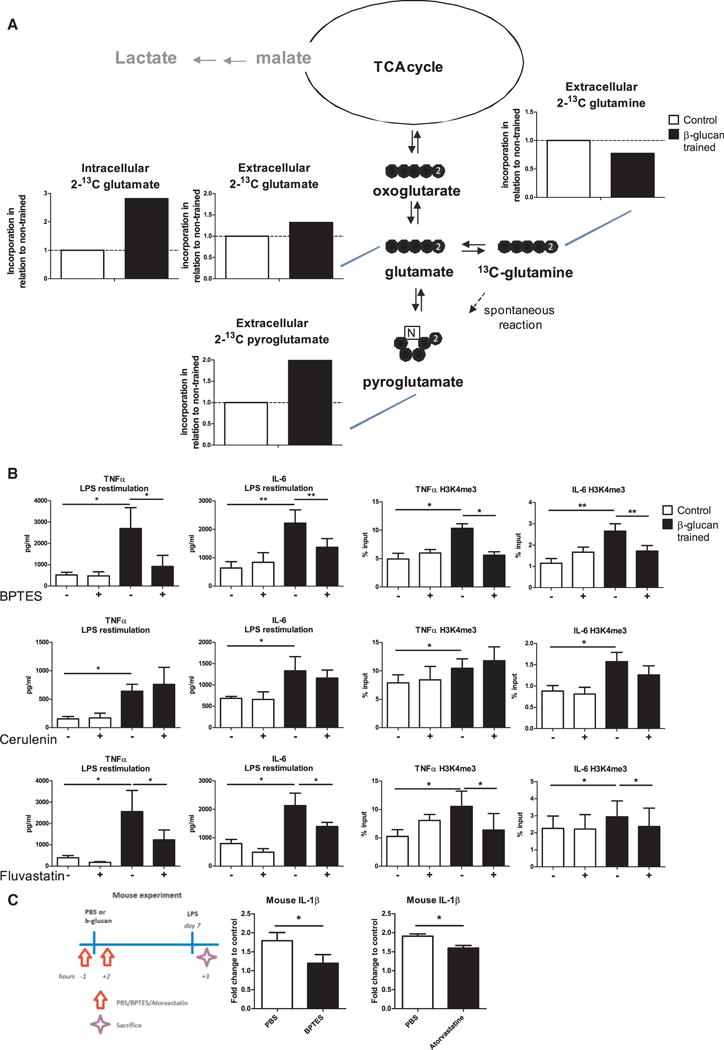
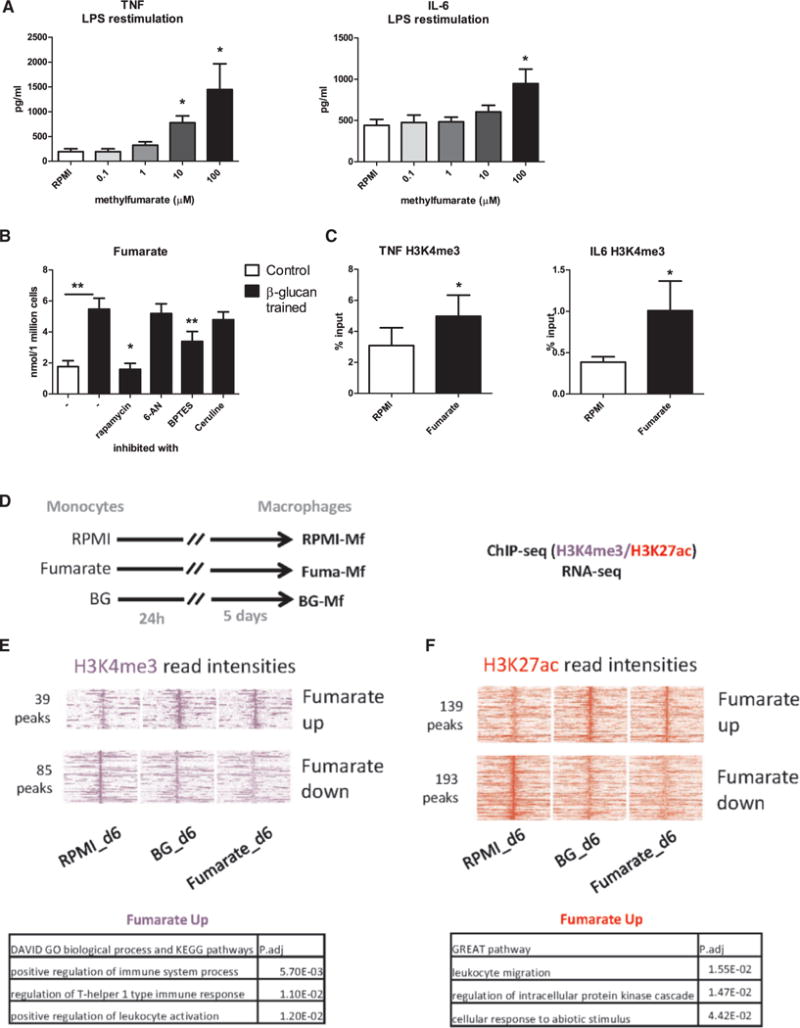
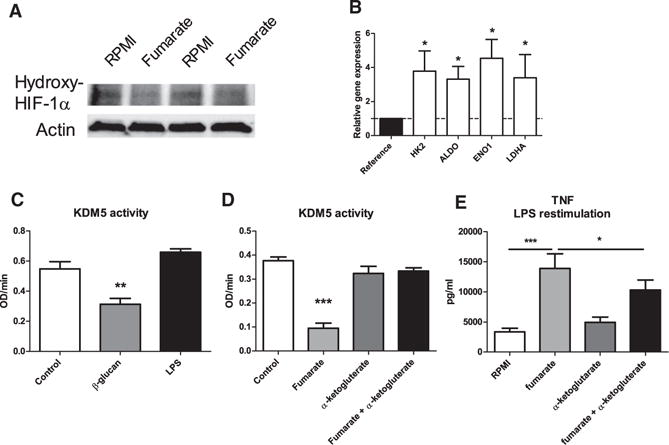
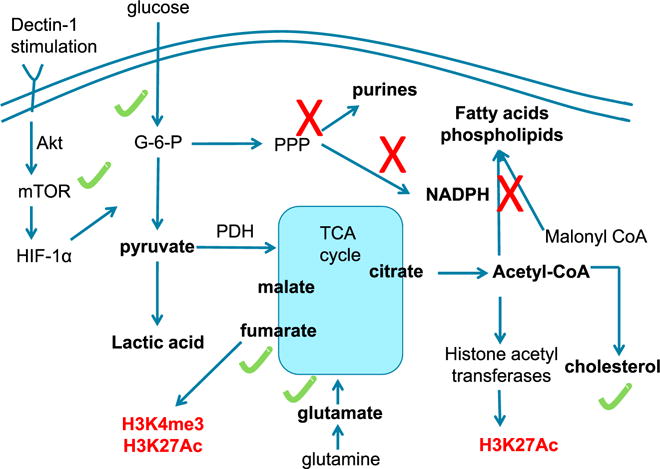
Induction of trained immunity (innate immune memory) is mediated by activation of immune and metabolic pathways that result in epigenetic rewiring of cellular functional programs. Through network-level integration of transcriptomics and metabolomics data, we identify glycolysis, glutaminolysis, and the cholesterol synthesis pathway as indispensable for the induction of trained immunity by β-glucan in monocytes. Accumulation of fumarate, due to glutamine replenishment of the TCA cycle, integrates immune and metabolic circuits to induce monocyte epigenetic reprogramming by inhibiting KDM5 histone demethylases. Furthermore, fumarate itself induced an epigenetic program similar to β-glucan-induced trained immunity. In line with this, inhibition of glutaminolysis and cholesterol synthesis in mice reduced the induction of trained immunity by β-glucan. Identification of the metabolic pathways leading to induction of trained immunity contributes to our understanding of innate immune memory and opens new therapeutic avenues.

Keywords: cholesterol metabolism; epigenetics; glutamine metabolism; glycolysis; trained immunity.


Figures

Figure 1
Figure 1. Metabolism in Trained and Tolerant Macrophages
(A) Heatmap depicting average mRNA expression of β-glucan-modulated metabolism-associated genes. The rows indicate different gene transcripts, and the columns indicate different conditions and time points. Log(e)RPKM values were Z scored and then plotted, with red indicating high RNA expression and blue indicating low RNA expression. The PCA plot shows the relationship between samples based on the expression of dynamic metabolic genes. RPMI (circles), LPS (triangles), and β-glucan (squares) samples are shown at 24 hr (green) and day 6 (black). See also Table S1. (B) Heatmap depicting the average metabolite intensities in the metabolomics data. The rows indicate different metabolites, and the columns indicate different conditions. The log transformed metabolite intensities were first Z scored/standardized and then averaged over all replicates. A PCA score plot of PC1 versus PC2 of the standardized metabolomics data is shown. The samples are color-coded according to the stimulus that was used, and the labels indicate time points after stimulation. See also Figure S1 and Tables S2 and S3. (C) Schematic pathway map depicting gene expression (arrows) and metabolic changes (filled circles) in cells treated with β-glucan versus LPS at day 6. The transcripts and metabolites marked in red were significantly upregulated in β-glucan versus LPS. The complete map as created by Escher is depicted in Figure S1.
Figure 2
Figure 2. Glucose Metabolism in Trained Immunity
(A) Accumulation of the 13C label that was incorporated in 2-13C labeled glucose was determined in lysates from β-glucan versus non-trained monocytes by NMR, therefore showing to which products glucose is metabolized. The arrows in gray are not active. HSQC-NMR spectra are shown in Figure S2. The data are shown as means ± SEM, n = 2. (B) Human monocytes were trained with β-glucan or left in culture medium for 24 hr in the presence or absence of mTOR inhibitor (rapamycin) or PPP inhibitor (6-AN). After 6 days, DNA was isolated for epigenetic analysis or cells were restimulated with LPS to determine cytokine production. See also Figure S3. The data are shown as means ± SEM, n = 5, *p < 0.05, **p < 0.01, and Wilcoxon signed-rank test. (C) Healthy human volunteers received a twice-daily increasing dose (1–2 g) of metformin for 6 days. At indicated time points, monocytes were trained ex vivo with β-glucan; after 5 days of rest, cells were restimulated with P3C and cytokine production was assessed. For the effect of metfomin on the AMPK-mTOR pathway and lactate production, see Figure S3. The data are shown as means ± SEM, n = 11, *p < 0.05, and Wilcoxon signed-rank test.
Figure 3
Figure 3. Other Metabolic Pathways in Trained Immunity
(A) Accumulation of the 13C label that was incorporated in 2-13C labeled glutamine was determined in supernatants and cell lysates from β-glucan versus non-trained monocytes by NMR, therefore showing to which products glutamine is metabolized. HSQC-NMR spectra can be found in Figure S2. (B) Human monocytes were trained with β-glucan or left in culture medium for 24 hr in the presence or absence of glutaminase inhibitor (BPTES), fatty acid synthesis inhibitor (cerulenin), or HMG-CoA reductase inhibitor (fluvastatin). After 6 days, DNA was isolated for epigenetic analysis or cells were restimulated with LPS to determine cytokine production. See also Figure S3. The data are shown as means ± SEM, n = 5, *p < 0.05, **p < 0.01, and Wilcoxon signed-rank test. (C) Mice were intraperitoneally trained with β-glucan or PBS in the presence or absence of glutamine (BPTES) or cholesterol (atorvastatin) metabolism inhibitors. After 7 days, an intraperitoneal LPS challenge was performed and IL-1β production was assessed 3 hr later. The fold of increase of IL-1β production of β-glucan trained mice to non-trained mice is shown. The data are shown as means ± SEM, n = 4, *p < 0.05, and paired t test.
Figure 4
Figure 4. Fumarate-Induced Trained Immunity
(A) Human monocytes were stimulated for 24 hr with different concentrations of methyl-fumarate. At day 6, cells were restimulated for 24 hr with LPS and cytokine production was assessed. The data are shown as means ± SEM, n = 8, *p < 0.05, one-way ANOVA, and Dunnett’s post test. (B) Human monocytes were trained with β-glucan in the presence or absence of metabolic inhibitors for 24 hr. On day 6, cells were lysed and intracellular fumarate concentrations were determined. The data are shown as means ± SEM, n = 9, *p < 0.05, **p < 0.01, and one-way ANOVA. (C) Human monocytes were stimulated for 24 hr with 50 μM methyl-fumarate. At day 6, cells were fixed, chromatin was isolated, and H3K4me3 at the promoters of TNFA and IL6 were determined. The data are shown as means ± SEM, n = 5, *p < 0.05, and Wilcoxon signed-rank test. (D) Experimental setup for the generation of fumarate-treated macrophages for epigenomic analysis. (E) Heatmap of H3K4me3 reads (purple) over fumarate-specific peaks. The intensity over the center of the peak ±12 kb is depicted for RPMI-Mf, BG-Mf, and fumarate-Mf, with each row (x axis) corresponding to a peak. (F) Heatmap of H3K27ac reads (red) over fumarate-specific peaks. The intensity over the center of the peak ±12 kb is depicted for RPMI-Mf, BG-Mf, and fumarate-Mf. The top GO pathways (from DAVID) associated with the nearest genes to dynamic H3K4me3 and H3K27ac are shown, with adjusted p values. See also Figure S5.
Figure 5
Figure 5. Fumarate Modulates HIF1α Degradation and Epigenetic Modulators
(A) Human monocytes were stimulated for 2 hr with 50 μM fumarate, after which cells were lysed and HIF1α hydroxylation was assessed by western blot. The representative example of five experiments is shown. (B) Human monocytes were stimulated for 24 hr with 50 μM fumarate, then mRNA was isolated and expression of Hif1α targets was determined. The data are shown as means ± SEM, n = 8, *p < 0.05, and Wilcoxon signed-rank test. (C) Human monocytes were trained with β-glucan or tolerized with LPS for 24 hr. At day 6, nuclear extracts were isolated and KDM5 activity was determined. The data are shown as means + SEM, n = 6, *p < 0.05, one-way ANOVA, and Dunnett’s post test. (D) Human monocytes were incubated for 24 hr with fumarate or/and α-ketoglutarate after which nuclear extracts were isolated and KDM5 activity was determined. The data are shown as means + SEM, n = 6, *p < 0.05, one-way ANOVA, and Dunnett’s post test. (E) Human monocytes were incubated for 24 hr with fumarate or/and α-ketoglutarate. At day 6, cells were restimulated for 24 hr with LPS and cytokine production was assessed. The data are shown as means + SEM, n = 6, *p < 0.05, one-way ANOVA, and Dunnett’s post test.
Figure 6
Figure 6. Overview Figure Showing the Metabolic and Epigenetic Pathways through which β-glucan Induces Trained Immunity
Training of monocytes by β-glucan induces complex metabolic pathways: while glycolysis, glutaminolysis, and cholesterol synthesis are important for induction of trained immunity, the PPP and fatty acid synthesis have no direct effect. Fumarate accumulation through glutaminolysis has a central role for induction of histone modifications and induction of trained immunity.

Similar articles

Cited by

References

    1. Caspi R, Altman T, Billington R, Dreher K, Foerster H, Fulcher CA, Holland TA, Keseler IM, Kothari A, Kubo A, et al. The MetaCyc database of metabolic pathways and enzymes and the BioCyc collection of Pathway/Genome Databases. Nucleic Acids Res. 2014;42:D459–D471. - PMC - PubMed
    1. Chen Q, Giedt M, Tang L, Harrison DA. Tools and methods for studying the Drosophila JAK/STAT pathway. Methods. 2014;68:160–172. - PubMed
    1. Cheng SC, Quintin J, Cramer RA, Shepardson KM, Saeed S, Kumar V, Giamarellos-Bourboulis EJ, Martens JH, Rao NA, Aghajanirefah A, et al. mTOR- and HIF-1α-mediated aerobic glycolysis as metabolic basis for trained immunity. Science. 2014;345:1250684. - PMC - PubMed
    1. Cheng SC, Scicluna BP, Arts RJ, Gresnigt MS, Lachmandas E, Giamarellos-Bourboulis EJ, Kox M, Manjeri GR, Wagenaars JA, Cremer OL, et al. Broad defects in the energy metabolism of leukocytes underlie immunoparalysis in sepsis. Nat Immunol. 2016;17:406–413. - PubMed
    1. Donohoe DR, Bultman SJ. Metaboloepigenetics: interrelationships between energy metabolism and epigenetic control of gene expression. J Cell Physiol. 2012;227:3169–3177. - PMC - PubMed

Publication types