Tumor-targeted delivery of sunitinib base enhances vaccine therapy for advanced melanoma by remodeling the tumor microenvironment
- PMID: 27863995
- PMCID: PMC5222779
- DOI: 10.1016/j.jconrel.2016.11.013
Tumor-targeted delivery of sunitinib base enhances vaccine therapy for advanced melanoma by remodeling the tumor microenvironment
Abstract
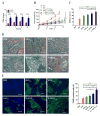
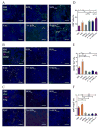
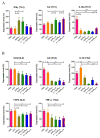
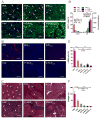
Development of an effective treatment against advanced tumors remains a major challenge for cancer immunotherapy. We have previously developed a potent mannose-modified lipid calcium phosphate (LCP) nanoparticle (NP)-based Trp2 vaccine for melanoma therapy, but because this vaccine can induce a potent anti-tumor immune response only during the early stages of melanoma, poor tumor growth inhibition has been observed in more advanced melanoma models, likely due to the development of an immune-suppressive tumor microenvironment (TME). To effectively treat this aggressive tumor, a multi-target receptor tyrosine kinase inhibitor, sunitinib base, was efficiently encapsulated into a targeted polymeric micelle nano-delivery system (SUNb-PM), working in a synergistic manner with vaccine therapy in an advanced mouse melanoma model. SUNb-PM not only increased cytotoxic T-cell infiltration and decreased the number and percentage of MDSCs and Tregs in the TME, but also induced a shift in cytokine expression from Th2 to Th1 type while remodeling the tumor-associated fibroblasts, collagen, and blood vessels in the tumor. Additionally, inhibition of the Stat3 and AKT signaling pathways by SUNb-PM may induce tumor cell apoptosis or decrease tumor immune evasion. Our findings indicated that targeted delivery of a tyrosine kinase inhibitor to tumors can be used in a novel synergistic way to enhance the therapeutic efficacy of existing immune-based therapies for advanced melanoma.
Keywords: Advanced melanoma; Peptide vaccine; Polymeric micelles; Sunitinib base; Tumor microenvironment.
Copyright © 2016 Elsevier B.V. All rights reserved.
Figures


Similar articles
-
Multifunctional nanoparticles co-delivering Trp2 peptide and CpG adjuvant induce potent cytotoxic T-lymphocyte response against melanoma and its lung metastasis.J Control Release. 2013 Nov 28;172(1):259-265. doi: 10.1016/j.jconrel.2013.08.021. Epub 2013 Sep 1. J Control Release. 2013. PMID: 24004885
-
Nanoparticle delivery of CDDO-Me remodels the tumor microenvironment and enhances vaccine therapy for melanoma.Biomaterials. 2015 Nov;68:54-66. doi: 10.1016/j.biomaterials.2015.07.053. Epub 2015 Aug 1. Biomaterials. 2015. PMID: 26264646 Free PMC article.
-
Cationic micelle delivery of Trp2 peptide for efficient lymphatic draining and enhanced cytotoxic T-lymphocyte responses.J Control Release. 2015 Feb 28;200:1-12. doi: 10.1016/j.jconrel.2014.12.024. Epub 2014 Dec 23. J Control Release. 2015. PMID: 25540903
-
Modification of the tumor microenvironment as a novel target of renal cell carcinoma therapeutics.Cancer J. 2013 Jul-Aug;19(4):353-64. doi: 10.1097/PPO.0b013e31829da0ae. Cancer J. 2013. PMID: 23867518 Free PMC article. Review.
-
Current evidence and the evolving role of sunitinib in the management of renal cell carcinoma.Indian J Cancer. 2016 Jan-Mar;53(1):102-8. doi: 10.4103/0019-509X.180824. Indian J Cancer. 2016. PMID: 27146754 Review.
Cited by
-
Nanomaterials Enhance the Immunomodulatory Effect of Molecular Targeted Therapy.Int J Nanomedicine. 2021 Mar 1;16:1631-1661. doi: 10.2147/IJN.S290346. eCollection 2021. Int J Nanomedicine. 2021. PMID: 33688183 Free PMC article. Review.
-
Exposure of Immunogenic Tumor Antigens in Surrendered Immunity and the Significance of Autologous Tumor Cell-Based Vaccination in Precision Medicine.Int J Mol Sci. 2022 Dec 21;24(1):147. doi: 10.3390/ijms24010147. Int J Mol Sci. 2022. PMID: 36613591 Free PMC article. Review.
-
Cancer Immunotherapy with "Vascular-Immune" Crosstalk as Entry Point: Associated Mechanisms, Therapeutic Drugs and Nano-Delivery Systems.Int J Nanomedicine. 2024 Jul 19;19:7383-7398. doi: 10.2147/IJN.S467222. eCollection 2024. Int J Nanomedicine. 2024. PMID: 39050878 Free PMC article. Review.
-
Cancer stem cells and strategies for targeted drug delivery.Drug Deliv Transl Res. 2021 Oct;11(5):1779-1805. doi: 10.1007/s13346-020-00863-9. Epub 2020 Oct 23. Drug Deliv Transl Res. 2021. PMID: 33095384 Free PMC article. Review.
-
Advances in Immunotherapy for Melanoma: A Comprehensive Review.Mediators Inflamm. 2017;2017:3264217. doi: 10.1155/2017/3264217. Epub 2017 Aug 1. Mediators Inflamm. 2017. PMID: 28848246 Free PMC article. Review.
References
MeSH terms
Substances
Grants and funding
LinkOut - more resources
Full Text Sources
Other Literature Sources
Medical
Miscellaneous

