. 2016 Dec 20;7(51):85437-85449.
doi: 10.18632/oncotarget.13387.

Cancer cell CCL5 mediates bone marrow independent angiogenesis in breast cancer

Affiliations

Cancer cell CCL5 mediates bone marrow independent angiogenesis in breast cancer

Michael John Sax et al. Oncotarget. .

Abstract

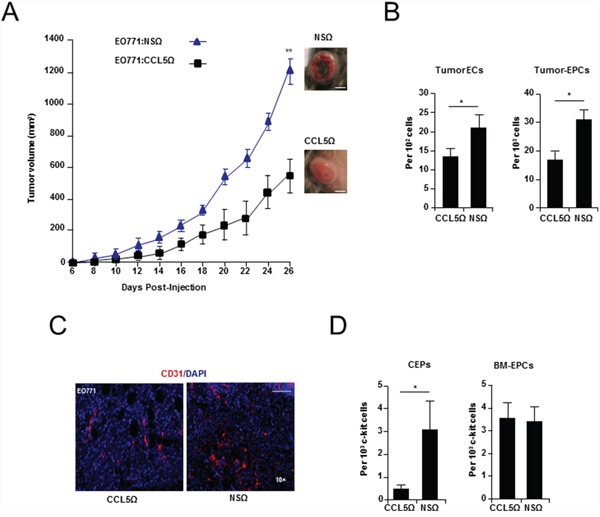
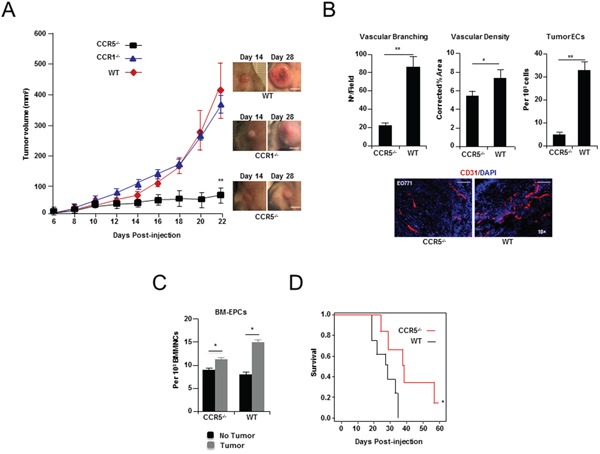
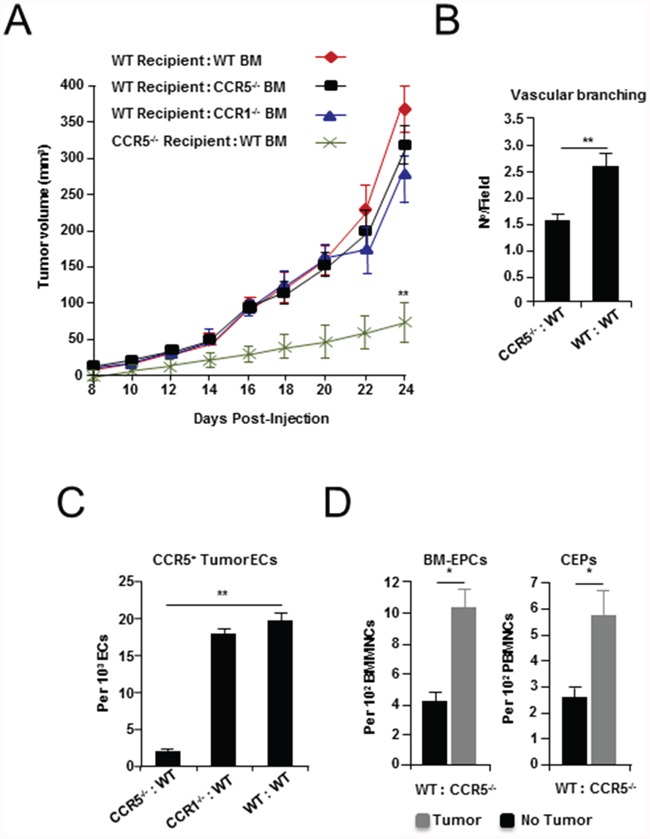
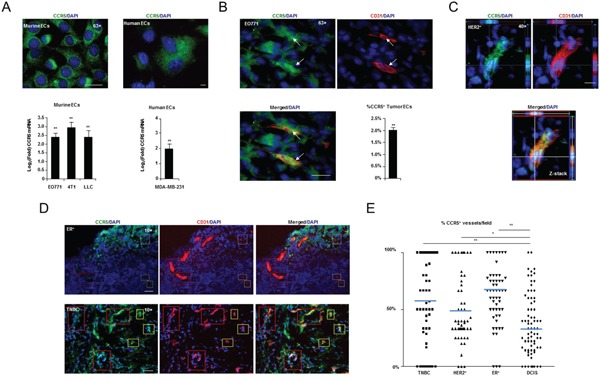
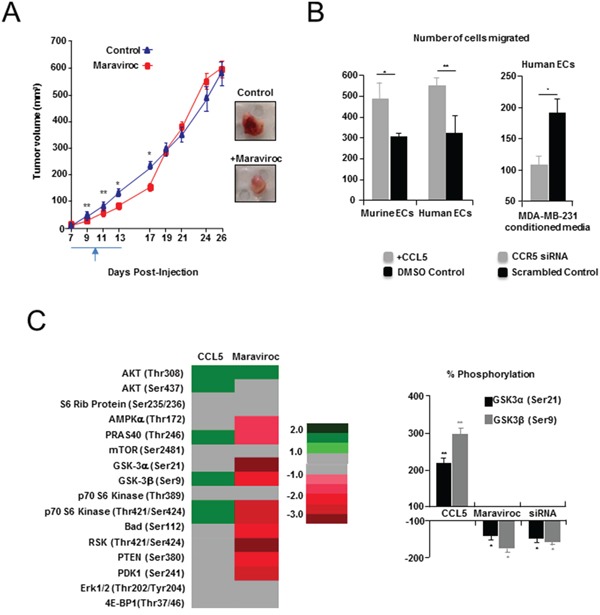
It has recently been suggested that the chemokine receptor (CCR5) is required for bone marrow (BM) derived endothelial progenitor cell (EPC) mediated angiogenesis. Here we show that suppression of either cancer cell produced CCL5, or host CCR5 leads to distinctive vascular and tumor growth defects in breast cancer. Surprisingly, CCR5 restoration in the BM alone was not sufficient to rescue the wild type phenotype, suggesting that impaired tumor growth associated with inhibiting CCL5/CCR5 is not due to defects in EPC biology. Instead, to promote angiogenesis cancer cell CCL5 may signal directly to endothelium in the tumor-stroma. In support of this hypothesis, we have also shown: (i) that endothelial cell CCR5 levels increases in response to tumor-conditioned media; (ii) that the amount of CCR5+ tumor vasculature correlates with invasive grade; and (iii) that inhibition of CCL5/CCR5 signaling impairs endothelial cell migration, associated with a decrease in activation of mTOR/AKT pathway members. Finally, we show that treatment with CCR5 antagonist results in less vasculature, impaired tumor growth, reduced metastases and improved survival. Taken as a whole, this work demonstrates that directly inhibiting CCR5 expressing vasculature constitutes a novel strategy for inhibiting angiogenesis and blocking metastatic progression in breast cancer.

Keywords: CCL5; CCR5; angiogenesis; breast cancer; shRNAi.


Conflict of interest statement

CONFLICTS OF INTEREST

The authors whose names are listed immediately above certify that they have NO affiliations with or involvement in any organization or entity with any financial interest, or non-financial interest in the subject matter or materials discussed in this manuscript.

Figures

Figure 1
Figure 1. Cancer cell produced CCL5 is required for breast tumor growth and vascularization
A. Growth curve of WT mice showing a significant reduction in the growth of EO771:EFlong-eGFP-CCL5Ω (seed sequence 2), compared with EO771:EFlong-eGFP-NSΩ tumors. Data was analyzed by MANOVA (α = 0.05, ‘**P < 0.01, n = 10 per group). Tumor morphology as inset. Scale Bar, 10 mm. B. FACS analysis showing a significant reduction of tumor CD31+ CD11b- endothelial cells (ECs) and tumor associated c-kit+ VEGFR2+ CD11b- EPCs in EO771:CCL5Ω, compared with nonspecific control (EO771:NSΩ) tumors. Data is represented as mean number cells ± S.E.M. per 102, or 103 total cells (n = 5 per group). C. Immunostaining of vasculature (CD31+) from EO771:CCL5Ω and control tumors. Scale bar, 200 μm. D. FACS analysis showing a significant reduction in circulating endothelial progenitors (CEPs) (Left) and no significant difference in BM EPCs isolated from mice transplanted with EO771:CCL5Ω tumors (Right). Data is represented as either mean number per 1 × 103 PB mononuclear cells (PBMNCs) or c-kit cells ± S.E.M. (n = 5 per group). For B & D, data was analyzed by Unpaired t test (‘*P < 0.05, ‘**P < 0.01; α = 0.05).
Figure 2
Figure 2. Breast tumor growth and angiogenesis in CCR5 null mice
A. Left, growth curve of EO771 breast cancer cells showing a significant decrease in tumor growth when grown in CCR5-/- null mice, compared with CCR1 null (CCR1-/-) or wild-type (WT) animals. Data is represented as mean volume ± S.E.M., and was analyzed by MANOVA (‘**P < 0.01; α = 0.05, n = 10 per group). Right, Representative tumors (Day 14 & Day 28). Scale bar, 15 mm. B. Upper Left, shown, a significant decrease in tumor vascular branching in CCR5-/- null mice, compared with control (WT) mice. Data is represented as mean number of branch points/field ± S.E.M. (n = 20 per group). Upper Middle, shown, a significant decrease in tumor vascular density in CCR5-/- mice. Data is represented as mean CD31+ vasculature area/field, corrected for tumor area ± S.E.M. (n = 20 per group). Upper Right, FACS analysis of tumors showing a significant reduction in the number of CD31+ CD11b-endothelial cells (ECs) in CCR5-/- mice, compared with WT mice. Data is represented as mean number of endothelial cells (ECs) per 103 total cells ± S.E.M. Lower, CD31 immunostaining of representative tumors, showing significantly less vascular branching and density in CCR5-/- mice compared with WT mice. Scale bar, 200μm. For B & C, data was analyzed by Unpaired t test (‘*P < 0.05, ‘**P < 0.01; α = 0.05). C. FACS analysis of bone marrow (BM) at day 14 from tumor challenged mice, showing expansion of VEGFR2+ c-kit+ CD11b- EPCs in both WT (P = 0.0125), and CCR5-/- animals (P = 0.0478). Data is represented as mean number of cells per 103 BM mononuclear cells (BMMNCs) ± S.E.M. (n = 5 per group). D. Survival data of CCR5-/- and WT mice after tail vein injection of 1 × 10⁵ EO771 cells (n = 7) showing significantly increased survival in CCR5-/-mice. Data was analyzed by Kaplan-Meier estimator (‘*P < 0.05, α = 0.05).
Figure 3
Figure 3. Tumor growth and angiogenesis in CCR5 null mice transplanted with wild-type (WT) bone marrow (BM)
A. Growth curves of EO771 tumor cells grown in WT mice transplanted with WT, CCR1 null (CCR1-/-) and CCR5 null (CCR5-/-) BM (recipient:donor), as well as CCR5-/- mice transplanted with wild-type (WT) BM (CCR5-/- :WT), showing a significant decrease in tumor growth in CCR5-/-:WT mice. Data is represented as mean tumor volume ± S.E.M. (n = 6), and analyzed by MANOVA (‘**P < 0.01; α = 0.05). B. Shown a significant decrease in vascular branching in CCR5-/-:WT mice, compared with WT:WT animals. Data is represented as number of branch points/field ± S.E.M. (n = 20 per group). C. The number of CCR5+ CD31+ CD11b- tumor endothelial cells (ECs) is significantly reduced in CCR5-/- transplanted with WT BM, compared with CCR1-/- transplanted with WT BM and control BMT mice. Data is represented as mean number of ECs per 103 total CD31+ CD11b- tumor ECs. D. FACS analysis of BM EPCs and peripheral blood (PB) CEPs from WT:CCR5-/- animals, showing expansion of VEGFR2+ c-kit+ CD11b- EPCs (Left), and CEPs (Right), after tumor challenge. Data is represented as mean number of EPCs (or CEPs) per 102 BMMNCs/PBMNCs ± S.E.M. For B-D, data was analyzed by Unpaired t test (‘*P < 0.05, ‘**P < 0.01; α = 0.05).
Figure 4
Figure 4. CCR5 expressing vasculature and pathology
A. Upper, High resolution (63×) fluorescent microscopy showing CCR5 expression in murine (MHEVC) and human (HUVEC) endothelial cells (ECs) in vitro. Scale bar, 20 μm. Lower, Q-PCR showing significant induction of CCR5 mRNA in murine and human ECs, in response to murine (EO771, 4T1 & LLC) and human (MDA-MB-231) tumor conditioned medium, respectively. Data is represented as mean Log2(Fold) ± S.E.M. (n = 5 per group). B. High resolution (63×) fluorescent microscopy showing that CD31+ endothelial cells (ECs) express CCR5+ in EO771 tumors in situ (arrows). Lower Right, Results of FACS analysis showing the percentage of CD31+ CD11b- ECs that are CCR5+ in EO771 tumors. Data is represented as a mean percentage of the total number of tumor ECs ± S.E.M. C. High resolution (40×) fluorescent microscopy Z-stack showing that CD31+ vasculature in human HER2+ breast cancers express CCR5. Scale bar, 10 μm. D. Fluorescent microscopy showing estrogen receptor (ER)+ (Upper) and triple negative (TNBC) (Lower) tumors, with CCR5 positive and negative vessels (red boxes) and ECs (yellow boxes). Scale bar, 50μm. E. Scoring analysis of CCR5 expression in CD31+ vasculature from TNBC, HER2+, ER+ and DCIS human breast cancers. Dot plot showing a significantly higher number of CCR5+ CD31+ tumor blood vessels in TNBC, HER2+ and ER+ tumors compared with DCIS. At least 10 fields were analyzed per section. For A, B & E, data was analyzed by Unpaired t test (‘*P < 0.05, ‘**P < 0.01; α = 0.05).
Figure 5
Figure 5. Pharmacologic inhibition of CCL5/CCR5 in a syngeneic model of breast cancer
A. Left, delayed tumor growth, following maraviroc administration, compared with controls. Treatment commenced on day seven, and was followed by twice daily oral administration (gavage) of 10 mg/kg (3 % DMSO) maraviroc. Controls received vehicle only. Right, Tumors resected from maraviroc-treated animals (Day 13) were also paler. Scale bar, 10 mm. B. Left, Transwell assays showing significant number of mouse (MHEVS) and human (HUVEC) endothelial cells (ECs) migrated towards CCL5, compared to BSA control. Also shown (Right), a significant decrease in migration of human ECs in response to conditioned media from MDA-MB-231 breast cancer cells following siRNA suppression of CCR5, compared with scrambled siRNA control. Data is represented as mean number of migrated cells ± S.E.M. C. Left, Heat map of Pathscan AKT pathway analysis showing fold change in phosphorylation status of several members of the pathway in murine ECs, following treatment with CCL5 or suppression of CCR5 with maraviroc. Fold is determined by mean difference in average pixel density, between treated and control spots, following normalization. Right, Change in phosphorylation of GSK-3α (Ser21) and GSK-3β (Ser9) following treatment with CCL5, CCR5 siRNA or maraviroc, was confirmed by western blot analysis, and determined following normalisation against total GSK-3 protein. Tubulin was used as a loading reference. Data represented as mean % change in phosphorylation ± S.E.M. For B & C, data was analyzed by Unpaired t test (‘*P < 0.05).

Similar articles

Cited by

References

    1. Folkman J. Role of angiogenesis in tumor growth and metastasis. Semin Oncol. 2002;29:15–8. - PubMed
    1. Nolan DJ, Ciarrocchi A, Mellick AS, Jaggi JS, Bambino K, Gupta S, Heikamp E, McDevitt MR, Scheinberg DA, Benezra R, Mittal V. Bone marrow-derived endothelial progenitor cells are a major determinant of nascent tumor neovascularization. Genes Dev. 2007;21:1546–58. - PMC - PubMed
    1. Gao D, Nolan DJ, Mellick AS, Bambino K, McDonnell K, Mittal V. EPCs control the angiogenic switch in mouse lung metastasis. Science. 2008;319:195–8. - PubMed
    1. Mellick AS, Plummer PN, Nolan DJ, Gao D, Bambino K, Hahn M, Catena R, Turner V, McDonnell K, Benezra R, Brink R, Swarbrick A, Mittal V. Using the transcription factor inhibitor of DNA binding 1 to selectively target endothelial progenitor cells offers novel strategies to inhibit tumor angiogenesis and growth. Cancer Res. 2010;70:7273–82. - PMC - PubMed
    1. Asahara T, Takahashi T, Masuda H, Kalka C, Chen D, Iwaguro H, Inai Y, Silver M, Isner JM. VEGF contributes to postnatal neovascularization by mobilizing bone marrow derived endothelial progenitor cells. EMBO J. 1999;18:3964–72. - PMC - PubMed

MeSH terms