

Rab22a controls MHC-I intracellular trafficking and antigen cross-presentation by dendritic cells
- PMID: 27861124
- PMCID: PMC5283579
- DOI: 10.15252/embr.201642358
Rab22a controls MHC-I intracellular trafficking and antigen cross-presentation by dendritic cells
Abstract
Cross-presentation by MHC class I molecules allows the detection of exogenous antigens by CD8+ T lymphocytes. This process is crucial to initiate cytotoxic immune responses against many pathogens (i.e., Toxoplasma gondii) and tumors. To achieve efficient cross-presentation, dendritic cells (DCs) have specialized endocytic pathways; however, the molecular effectors involved are poorly understood. In this work, we identify the small GTPase Rab22a as a key regulator of MHC-I trafficking and antigen cross-presentation by DCs. Our results demonstrate that Rab22a is recruited to DC endosomes and phagosomes, as well as to the vacuole containing T. gondii parasites. The silencing of Rab22a expression did not affect the uptake of exogenous antigens or parasite invasion, but it drastically reduced the intracellular pool and the recycling of MHC-I molecules. The knockdown of Rab22a also hampered the cross-presentation of soluble, particulate and T. gondii-associated antigens, but not the endogenous MHC-I antigen presentation through the classical secretory pathway. Our findings provide compelling evidence that Rab22a plays a central role in the MHC-I endocytic trafficking, which is crucial for efficient cross-presentation by DCs.
Keywords: Toxoplasma gondii; MHC‐I molecules; cross‐presentation; dendritic cells; small GTPase Rab22a.
© 2016 The Authors.
Figures
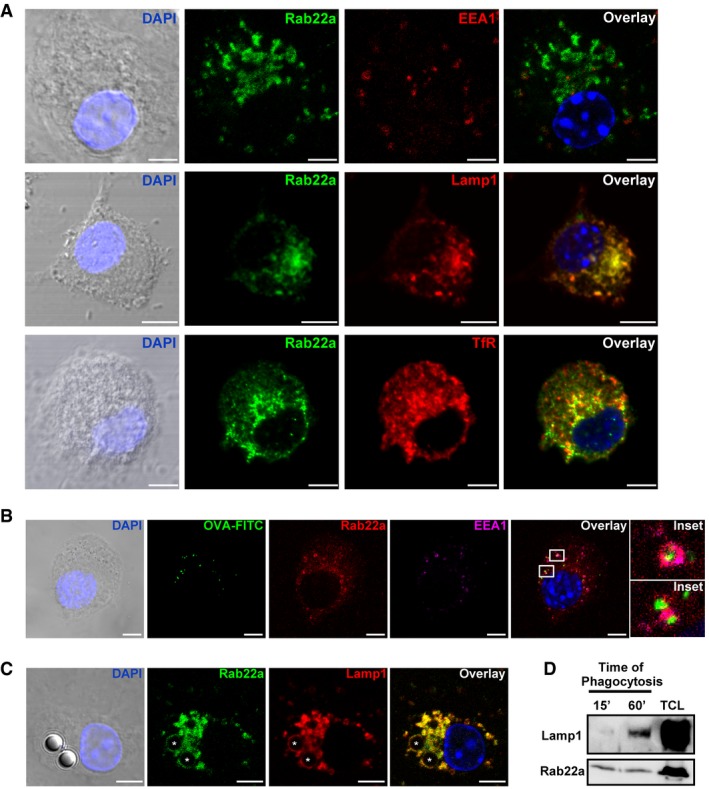
Confocal microscopy analysis showing the localization of endogenous Rab22a (green) and different endocytic markers (red): early endosomal marker EEA1, late endosome/lysosomal marker Lamp1, and the recycling compartment marker TfR in BMDCs at steady state. The means ± SEM of the Pearson correlation coefficients (Pcc) from Rab22a and EEA1 (0.4317 ± 0.05101), Lamp1 (0.8412 ± 0.03562), and TfR (0.6409 ± 0.02999) were estimated from 15 images analyzed for each marker. Scale bars: 5 μm.
Colocalization of endogenous Rab22a (red) and EEA1 (magenta) around endosomes containing fluorescent soluble OVA (OVA‐FITC, green) after 30 min of internalization by BMDCs. More than 60% of the endosomes were positive for Rab22a and EEA1. The indicated boxes are shown at higher magnification in the insets. Scale bars: 5 μm.
IF detection of endogenous Rab22a (green) and Lamp1 (red) after 1 h of phagocytosis of 3‐μm latex beads (LB) in BMDCs. Around 50% of the phagosomes were double positive for Rab22a and Lamp1. Asterisks indicate the LB. Scale bars: 5 μm.
BMDCs were incubated with 3‐μm magnetic beads for 15 min at 37°C and chased for 0 or 45 min. The panel shows immunoblotting of purified phagosomes, and the total cell lysates (TCL) analyzed for Lamp1 and Rab22a. A total protein amount of 10 μg and 50 μg was loaded for purified phagosomes and TCL, respectively. The blot is representative of three independent experiments.
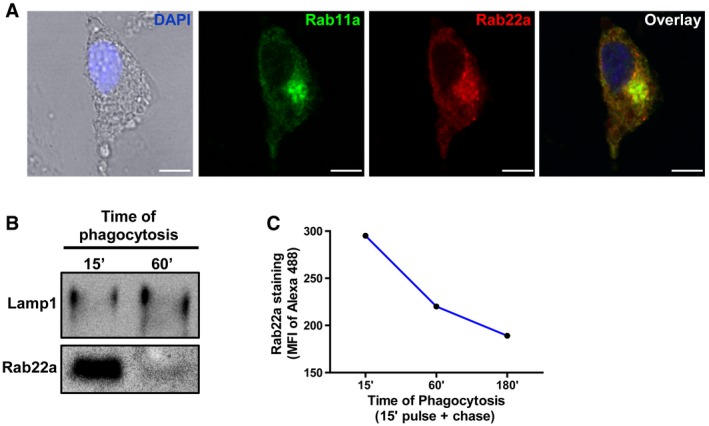
Confocal microscopy analysis showing endogenous Rab22a (red) co‐localizing with endogenous Rab11a (green) at the recycling center in BMDCs at steady state. The nuclear marker DAPI (blue) and DIC images are shown on the left panel. Scale bars: 5 μm.
JAWS‐II DC was incubated with 3‐μm magnetic beads for 15 min at 37°C and chased for 0 and 45 min. Immunoblotting of purified phagosomes was analyzed for Lamp1 and Rab22a. Ten micrograms of protein was loaded on each lane for purified phagosomes.
JAWS‐II DC was incubated with 3‐μm LB for 15 min at 37°C and chased for 0, 45, or 165 min. Rab22a staining on isolated phagosomes was measured by FACS at the indicated time periods. Data are representative of three independent experiments.
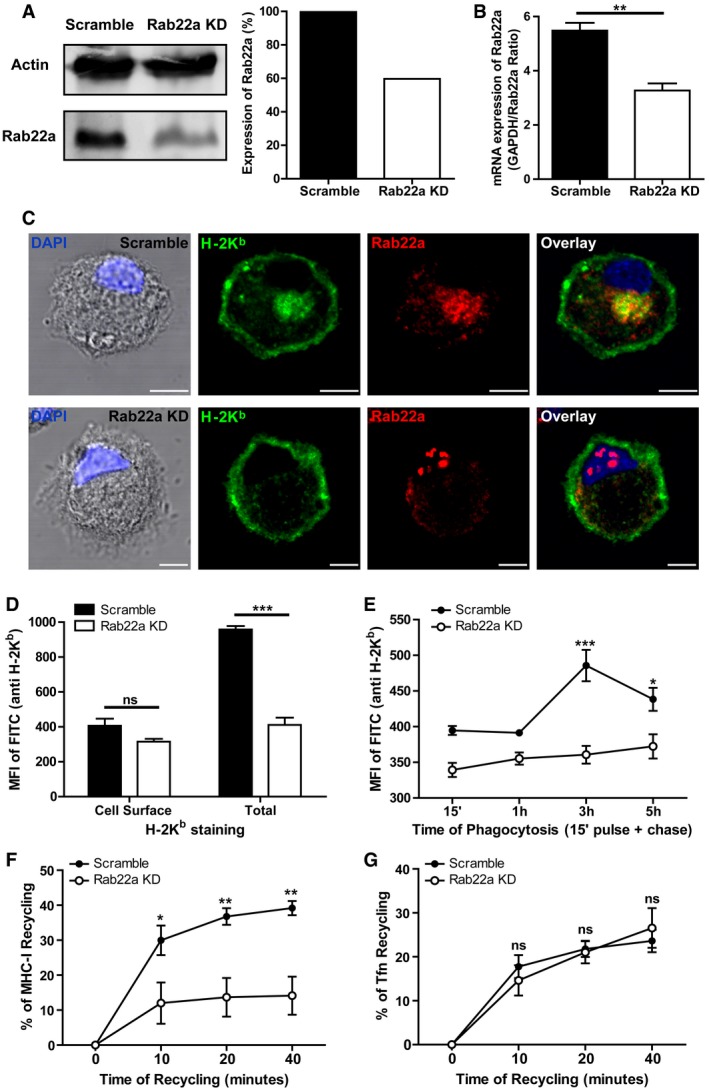
Immunoblotting and densitometry quantification of Rab22a in JAWS‐II DCs infected with lentiviruses encoding a random sequence (Scramble) and a shRNA specific for silencing Rab22a (Rab22a KD). Data are representative of at least three independent experiments.
RNA extraction and qPCR quantification of Rab22a in the same cells analyzed in (A). Data show mean ± SEM of triplicate values and are representative of two independent experiments. **P = 0.0047.
IF labeling and confocal microscopy analysis showing the distribution of MHC‐I molecules (H‐2Kb, green) and Rab22a (red) in Scramble and Rab22a KD JAWS‐II DCs. Nuclei stained with DAPI and DIC images are shown on the left. Overlay is shown in the right panels. Scale bars: 5 μm. Data are representative of at least 30 images analyzed for each experimental condition from three independent experiments.
FACS analysis of MHC‐I labeled in intact (cell surface) and permeabilized (total) Scramble and Rab22a KD JAWS‐II cells. Data represent mean ± SEM of triplicate values and are representative of three independent experiments. P = 0.1082 (ns) and ***P = 0.0003.
MHC‐I staining on isolated phagosomes was measured by FACS at the indicated time periods after 3‐μm LB internalization by Scramble and Rab22a KD JAWS‐II DCs. Data represent mean ± SEM of three independent experiments. ***P < 0.001 at 3 h and *P < 0.05 at 5 h between both DC types.
MHC‐I molecules recycling ability was measured by FACS at the indicated time periods by Scramble and Rab22a KD JAWS‐II DCs. Data represent mean ± SEM of three independent experiments. *P < 0.05 at 10 min and **P < 0.01 at 20 and 40 min.
The transferrin (Tfn) recycling ability was measured by FACS at the indicated time periods by Scramble and Rab22a KD JAWS‐II DCs. Data represent mean ± SEM of three independent experiments. P > 0.05 (ns) at 10, 20, and 40 min.
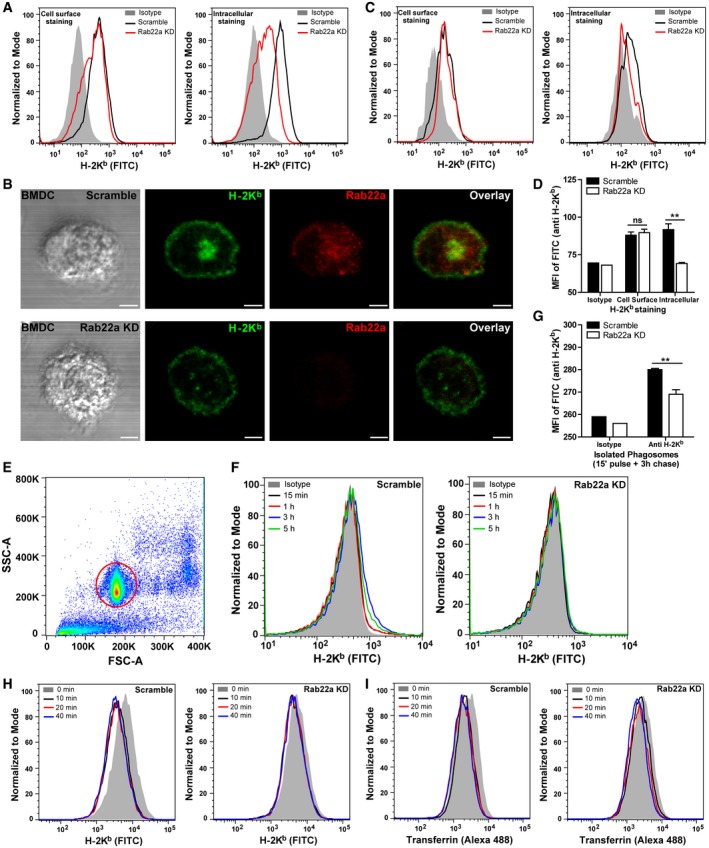
Representative FACS profile of intact (left panel) and saponin‐permeabilized (right panel) Scramble and Rab22a KD JAWS‐II DCs after H‐2Kb staining.
IF labeling and confocal microscopy analysis showing the distribution of MHC‐I molecules (H‐2Kb, green) and Rab22a (red) in Scramble and Rab22a KD BMDCs at steady state. DIC images are shown in the left panels. Overlay is shown in the right panels. Scale bars: 5 μm.
Representative FACS profiles of intact (left panel) and saponin‐permeabilized (right panel) Scramble and Rab22a KD BMDCs after H‐2Kb staining.
FACS analysis of MHC‐I labeled in intact (cell surface) and permeabilized (intracellular) Scramble and Rab22a KD BMDCs. Data represent mean ± SEM of triplicate values. P = 0.6283 (ns) and **P = 0.0046. The two‐tailed Student's unpaired t‐test was performed.
Representative dot plot obtained from flow cytometry analysis after the isolation of 3‐μm LB phagosomes. The population corresponding to individual phagosomes (red circle) is easily distinguished from the cellular debris generated after sample processing. More than ten thousand phagosomes from each condition were analyzed in each experiment.
Representative FACS profiles of H‐2Kb staining on isolated phagosomes at the indicated time periods after 3‐μm LB internalization by Scramble and Rab22a KD JAWS‐II DCs.
MHC‐I staining on isolated phagosomes was measured by FACS at 3 h post‐internalization of 3‐μm LB by Scramble and Rab22a KD BMDCs. Data represent mean ± SEM of triplicate values. **P = 0.0070. The two‐tailed Student's unpaired t‐test was performed.
Representative FACS profiles of MHC‐I molecules (H‐2Kb FITC) recycling at the indicated time periods by Scramble and Rab22a KD JAWS‐II DCs.
Representative FACS profiles of TfR (Alexa 488‐transferrin) recycling at the indicated time periods by Scramble and Rab22a KD JAWS‐II DCs.
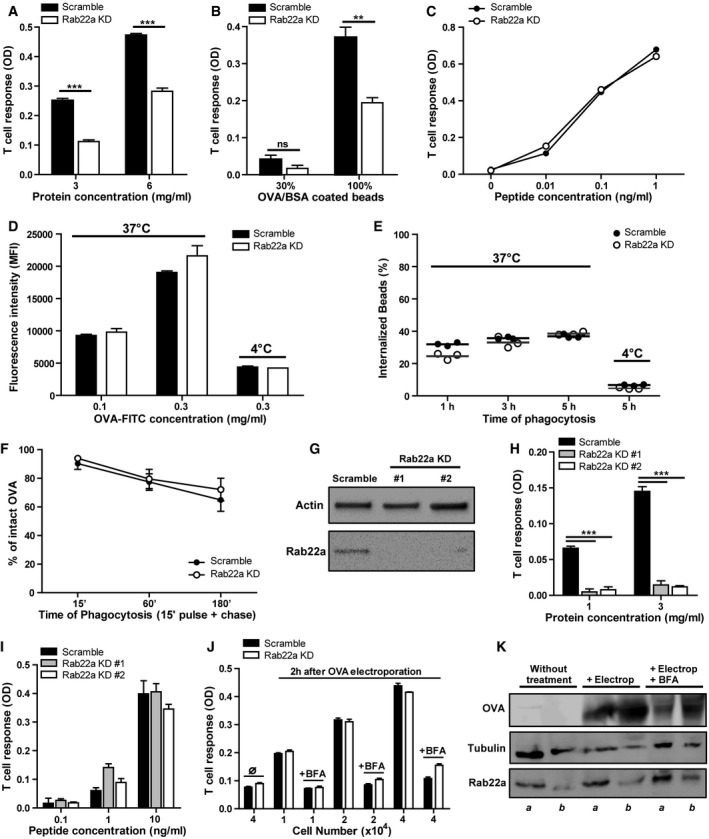
- A–C
The cross‐presentation ability after incubation with (A) soluble OVA, (B) OVA/BSA‐coated beads, and (C) the SIINFEKL control peptide at the indicated concentrations by Scramble and Rab22a KD JAWS‐II DCs was evaluated with the B3Z hybridoma. Data represent mean ± SEM of triplicate values and are representative of three independent experiments. (A) ***P = 0.0001 and (B) P = 0.1432 (ns); **P = 0.0044. The two‐tailed Student's unpaired t‐test was performed.
- D, E
Evaluation of endocytosis and phagocytosis in Scramble and Rab22a KD JAWS‐II DCs. (D) The endocytosis of fluorescent OVA after 1 h of internalization and (E) the phagocytosis of 3‐μm fluorescent LB at different times of internalization were assessed by FACS analysis. The antigen internalization was conducted at 37°C for effective uptake and at 4°C as negative control. In (D), data represent mean ± SEM of triplicate values and are representative of three independent experiments.
- F
The kinetics of OVA degradation, as percentage of proteases inhibitors, in isolated phagosomes at the indicated time periods post‐internalization from Scramble and Rab22a KD JAWS‐II DCs was assessed by FACS analysis. Data represent mean ± SEM of three independent experiments.
- G
Immunoblotting of Rab22a and Actin in BMDCs infected with lentiviruses encoding a random sequence (Scramble) and two shRNA specific for silencing Rab22a (Rab22a KD #1 and #2).
- H, I
The cross‐presentation capacity after the incubation with (H) soluble and (I) the SIINFEKL control peptide at the indicated concentrations by Scramble, Rab22a KD #1, and Rab22a KD #2 BMDCs was evaluated as described before for JAWS‐II DCs. Data represent mean ± SEM of triplicate values and are representative of two independent experiments. ***P = 0.0001. The two‐tailed Student's unpaired t‐test was performed.
- J
Soluble OVA was electroporated into the cytosol of Scramble and Rab22a KD JAWS‐II DCs, and T‐cell activation was determined 2 h later with the B3Z hybridoma. To control endogenous MHC‐I antigen presentation specificity, DCs were also treated with brefeldin A (BFA). The use of this drug markedly reduced CD8+ T‐cell response to similar levels obtained by DCs without any antigen (∅). Data represent mean ± SEM of triplicate values and are representative of three independent experiments.
- K
Immunoblotting showing the amount of OVA incorporated by Scramble (a) and Rab22a KD (b) JAWS‐II DCs after electroporation and BFA treatment.
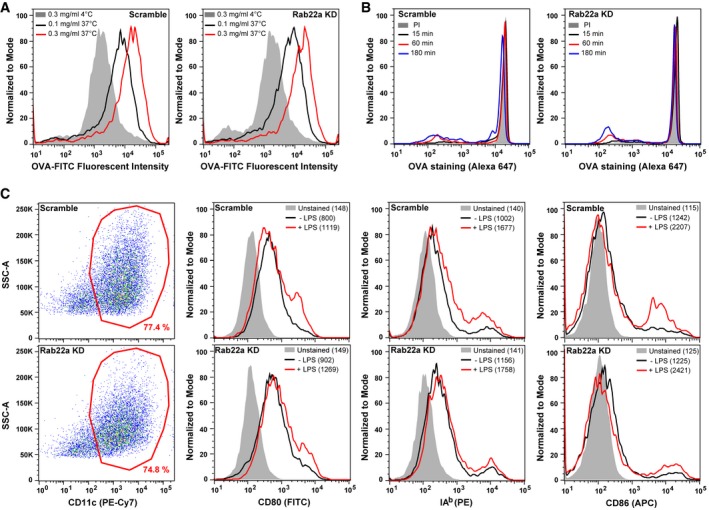
Scramble and Rab22a KD JAWS‐II DCs were incubated with soluble FITC‐OVA for 60 min. DCs were fixed and analyzed by FACS. Histograms represent the fluorescent intensities of two different concentrations of soluble OVA after internalization at 37°C or the highest concentration at 4°C. Data are representative of three independent experiments.
Representative FACS profiles showing the OVA staining on isolated phagosomes of 15 min, 1 h, and 3 h post‐internalization of 3‐μm LB from Scramble and Rab22a KD JAWS‐II DCs. The PI condition represents 3‐h phagosomes treated with proteases inhibitors. Data are representative of three independent experiments.
Scramble and Rab22a KD BMDCs ± LPS‐treated were labeled for CD11c, CD80, IAb, and CD86, and were analyzed by FACS. The gatings on CD11c‐positive cells (red) are depicted in the left panels. The MFI values are specified between parentheses in the FACS profiles. Data are representative of two independent experiments.
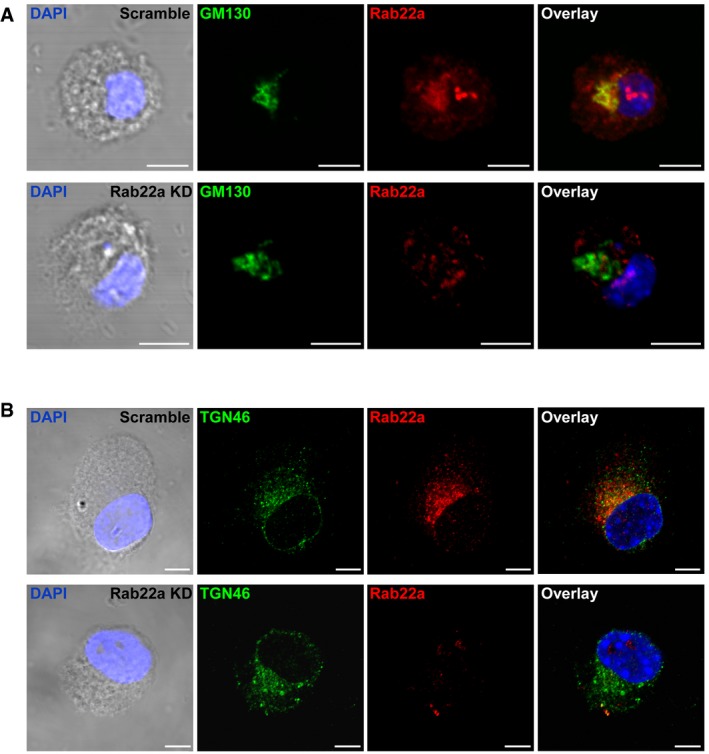
- A, B
IF labeling and confocal microscopy analysis showing the distribution of endogenous Rab22a (red) and (A) the cis‐Golgi marker GM130 (green) or (B) the trans‐Golgi marker TGN46 (green) in Scramble and Rab22a KD JAWS‐II DCs at steady state. The nuclear marker DAPI (blue) and DIC images are shown in the left panels. Overlays are shown in the right panels. Scale bars: 5 μm. Data are representative of at least 30 images analyzed from two independent experiments.
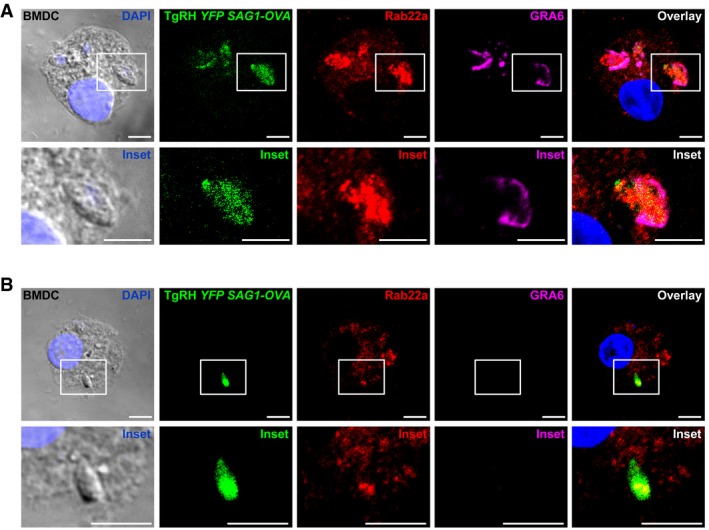
- A, B
BMDCs were infected with OVA‐YFP‐expressing T. gondii (TgRH YFP SAG1‐OVA) for 8 h and confocal images detecting the parasite (green), endogenous Rab22a (red), and GRA6 (magenta) were taken. White boxes are shown at higher magnification in the insets. The nuclear marker DAPI (blue) and DIC images and are shown in the left panels. Overlays are shown in the right panels. Scale bars: 5 μm. Data are representative of more than 50 PVs analyzed from two independent experiments.
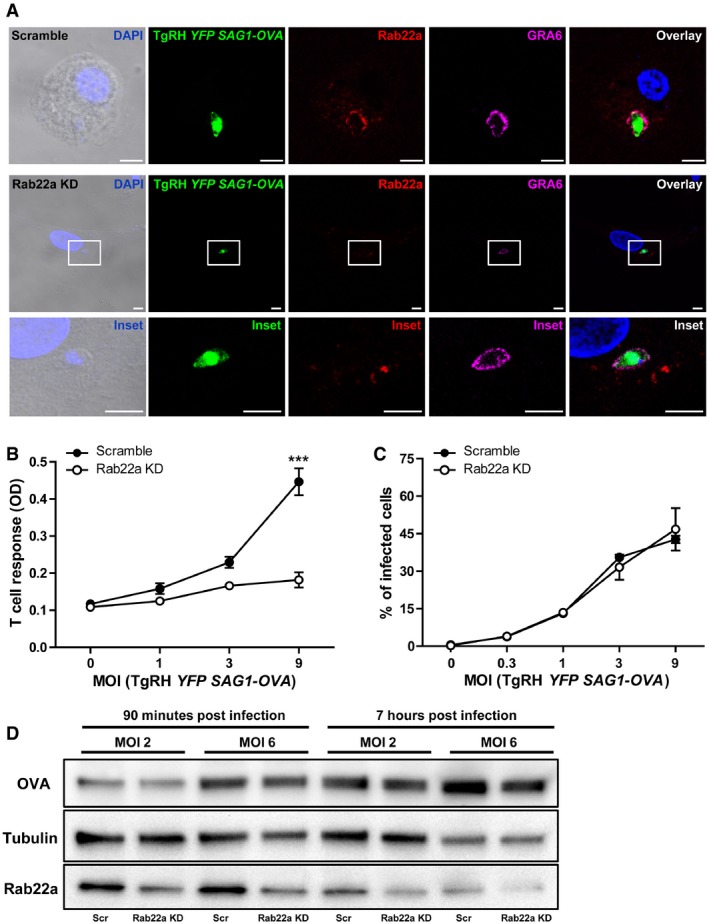
Scramble and Rab22a KD JAWS‐II DCs were infected with OVA‐YFP‐expressing T. gondii (TgRH YFP SAG1‐OVA) for 8 h and confocal images detecting the parasite (green), endogenous Rab22a (red), and GRA6 (magenta) were taken. Top panels: Scramble cells; bottom panels: Rab22a KD cells. White boxes are shown at higher magnification in the insets. The nuclear marker DAPI (blue) and DIC images are shown in the left panels. Overlays are shown in the right panels. Scale bars: 5 μm. Images are representative of at least 30 analyzed from three independent experiments.
The cross‐presentation of OVA secreted by T. gondii (TgRH YFP SAG1‐OVA) after 8 h of infection at the indicated MOI was evaluated by B3Z T‐cell activation. Data represent mean ± SEM of triplicate values and are representative of three independent experiments. ***P < 0.001. A two‐way ANOVA and the Bonferroni post‐test were performed.
The efficiency of infection (8 h) of TgRH YFP SAG1‐OVA in Scramble and Rab22a KD JAWS‐II DCs was measured by FACS analysis at the indicated MOI. Data represent mean ± SEM of duplicate values and are representative of three independent experiments.
Immunoblotting showing the total amount of OVA in Scramble and Rab22a KD JAWS‐II DCs after 90 min and 7 h of infection with TgRH YFP SAG1‐OVA parasite at MOI 2 and 6. Fifty micrograms of total cell lysates was loaded onto each lane. Data are representative of two independent experiments.
Similar articles
-
Chlamydia trachomatis Infection Impairs MHC-I Intracellular Trafficking and Antigen Cross-Presentation by Dendritic Cells.Front Immunol. 2021 Apr 15;12:662096. doi: 10.3389/fimmu.2021.662096. eCollection 2021. Front Immunol. 2021. PMID: 33936099 Free PMC article.
-
Endocytic Recycling of MHC Class I Molecules in Non-professional Antigen Presenting and Dendritic Cells.Front Immunol. 2019 Jan 7;9:3098. doi: 10.3389/fimmu.2018.03098. eCollection 2018. Front Immunol. 2019. PMID: 30666258 Free PMC article. Review.
-
Host ER-parasitophorous vacuole interaction provides a route of entry for antigen cross-presentation in Toxoplasma gondii-infected dendritic cells.J Exp Med. 2009 Feb 16;206(2):399-410. doi: 10.1084/jem.20082108. Epub 2009 Jan 19. J Exp Med. 2009. PMID: 19153244 Free PMC article.
-
Rab22a: A novel regulator of immune functions.Mol Immunol. 2019 Sep;113:87-92. doi: 10.1016/j.molimm.2018.03.028. Epub 2018 Apr 7. Mol Immunol. 2019. PMID: 29631761 Review.
-
Differential requirement of Rab22a for the recruitment of ER-derived proteins to phagosomes and endosomes in dendritic cells.Small GTPases. 2020 May;11(3):211-219. doi: 10.1080/21541248.2017.1384088. Epub 2018 Jan 24. Small GTPases. 2020. PMID: 28960134 Free PMC article.
Cited by
-
Cross-presentation of exogenous antigens on MHC I molecules.Curr Opin Immunol. 2020 Jun;64:1-8. doi: 10.1016/j.coi.2019.12.005. Epub 2020 Jan 9. Curr Opin Immunol. 2020. PMID: 31927332 Free PMC article. Review.
-
The ongoing saga of the mechanism(s) of MHC class I-restricted cross-presentation.Curr Opin Immunol. 2017 Jun;46:89-96. doi: 10.1016/j.coi.2017.03.015. Epub 2017 May 18. Curr Opin Immunol. 2017. PMID: 28528219 Free PMC article. Review.
-
Recent advances in conventional and unconventional vesicular secretion pathways in the tumor microenvironment.J Biomed Sci. 2022 Aug 5;29(1):56. doi: 10.1186/s12929-022-00837-8. J Biomed Sci. 2022. PMID: 35927755 Free PMC article. Review.
-
The ras-related protein RAB22A interacts with hypoxia-inducible factor 1-alpha (HIF-1α) in MDA-MB-231 breast cancer cells in hypoxia.Mol Biol Rep. 2024 Apr 22;51(1):564. doi: 10.1007/s11033-024-09516-3. Mol Biol Rep. 2024. PMID: 38647725
-
The parasite Toxoplasma sequesters diverse Rab host vesicles within an intravacuolar network.J Cell Biol. 2017 Dec 4;216(12):4235-4254. doi: 10.1083/jcb.201701108. Epub 2017 Oct 25. J Cell Biol. 2017. PMID: 29070609 Free PMC article.
References
-
- Joffre OP, Segura E, Savina A, Amigorena S (2012) Cross‐presentation by dendritic cells. Nat Rev Immunol 12: 557–569 - PubMed
-
- Savina A, Jancic C, Hugues S, Guermonprez P, Vargas P, Moura IC, Lennon‐Dumenil AM, Seabra MC, Raposo G, Amigorena S (2006) NOX2 controls phagosomal pH to regulate antigen processing during crosspresentation by dendritic cells. Cell 126: 205–218 - PubMed
-
- Trombetta ES, Ebersold M, Garrett W, Pypaert M, Mellman I (2003) Activation of lysosomal function during dendritic cell maturation. Science 299: 1400–1403 - PubMed
-
- Savina A, Amigorena S (2007) Phagocytosis and antigen presentation in dendritic cells. Immunol Rev 219: 143–156 - PubMed
MeSH terms
Substances
LinkOut - more resources
Full Text Sources
Other Literature Sources
Molecular Biology Databases
Research Materials
