. 2017 Jan 2;13(1):133-148.
doi: 10.1080/15548627.2016.1248018. Epub 2016 Nov 15.

HSF1 stress response pathway regulates autophagy receptor SQSTM1/p62-associated proteostasis

Affiliations

HSF1 stress response pathway regulates autophagy receptor SQSTM1/p62-associated proteostasis

Yoshihisa Watanabe et al. Autophagy. .

Abstract

Proteostasis is important for protecting cells from harmful proteins and is mainly controlled by the HSF1 (heat shock transcription factor 1) stress response pathway. This pathway facilitates protein refolding by molecular chaperones; however, it is unclear whether it functions in autophagy or inclusion formation. The autophagy receptor SQSTM1/p62 is involved in selective autophagic clearance and inclusion formation by harmful proteins, and its phosphorylation at S349, S403, and S407 is required for binding to substrates. Here, we demonstrate that casein kinase 1 phosphorylates the SQSTM1 S349 residue when harmful proteins accumulate. Investigation of upstream factors showed that both SQSTM1 S349 and SQSTM1 S403 residues were phosphorylated in an HSF1 dependent manner. Inhibition of SQSTM1 phosphorylation suppressed inclusion formation by ubiquitinated proteins and prevented colocalization of SQSTM1 with aggregation-prone proteins. Moreover, HSF1 inhibition impaired aggregate-induced autophagosome formation and elimination of protein aggregates. Our findings indicate that HSF1 triggers SQSTM1-mediated proteostasis.

Keywords: HSF1; SQSTM1/p62; aggrephagy; casein kinase; phosphorylation; proteostasis.


Figures
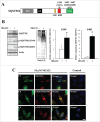
Figure 1.
Figure 1.
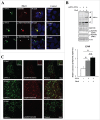
Phosphorylation of SQSTM1 at S349 and S403 in MG132-treated HeLa cells. (A) Schematic of the SQSTM1 domain structure. SQSTM1 contains a PB1 (Phox and Bem1) domain, a ZZ zinc finger (ZZ) domain, an LC3-interaction region (LIR) motif, a Kelch-like ECH-associated protein 1 (KEAP1)-interaction region (KIR) motif, and a ubiquitin associated (UBA) domain. SQSTM1 is phosphorylated at S349, S403, and S407 (S351, S405, and S409 in mice). (B) HeLa cells were cultured without (−) or with (+) 10 µM MG132 for 12 h, followed by immunoblot analysis of cell lysates. Band intensities were measured, and phosphorylated SQSTM1 values were normalized to total SQSTM1. The data are reported as means ± SD (n = 4). P values were calculated using the Student t test. *P < 0.01. (C) HeLa cells were cultured with or without 10 µM MG132 for 12 h. Colocalization of SQSTM1 (upper), S349-phosphorylated SQSTM1 (middle, p-SQSTM1 [S349]), and S403-phosphorylated SQSTM1 (lower, p-SQSTM1 [S403]) with ubiquitinated inclusions (Ub) were examined immunohistochemically. Cell nuclei were counterstained blue with DAPI. Scale bar: 10 μm.
Figure 2.
Figure 2.
Generation of SNCA aggregates induces the phosphorylation of SQSTM1 on S349 but not on S403. (A) SNCA fibrils (+Fibril) or PBS-mock (Control) were introduced using a transfection reagent into HEK293 cells exogenously expressing human SNCA. After 24 h, the cells were subjected to immunocytochemical analysis using anti-phosphorylated SNCA (p-SNCA), anti-SQSTM1 (SQSTM1), and anti-phosphorylated SQSTM1 (p-SQSTM1 [S349] and p-SQSTM1 [S403]) antibodies. Cell nuclei were counterstained blue with DAPI. Scale bar: 10 μm. Lewy body-like SNCA aggregates are indicated by arrowheads. (B) Lysates of HEK293 (lane 1), HEK293 exogenously expressing human SNCA (lane 2), and HEK293 introduced with SNCA fibrils (lane 3) were analyzed by immunoblotting with anti-SNCA, anti-SQSTM1, anti-phosphorylated SQSTM1, and anti-actin antibodies. Arrowheads indicate molecular species of SNCA including SDS-soluble forms (open arrowhead), SDS-insoluble dimer (closed black arrowhead), and SDS-insoluble aggregates (closed gray arrowhead). Band intensities were measured, and phosphorylated-SQSTM1 values were normalized to total SQSTM1. The data are reported as means ± SD (n = 4). Statistical analyses were performed using one-way ANOVA, followed by the Tukey post-hoc test. *P < 0.01, **P < 0.05. (C) SNCA fibrils were microinjected into the striatum of mice. After 6 mo, the striatum was immunohistochemically examined using anti-phosphorylated SNCA (p-SNCA), anti-SQSTM1 (SQSTM1), and anti-phosphorylated SQSTM1 (p-SQSTM1 [S351] and p-SQSTM1 [S405]) antibodies. The insets show colocalization images of p-SNCA and SQSTM1. Scales are indicated on the images. Middle panels are high-magnification images of upper panels.
Figure 3.
Figure 3.
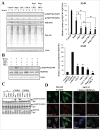
Identification of a novel kinase that phosphorylates SQSTM1 (S349). (A) HeLa cells were treated with rapamycin (MTORC1 inhibitor, 1 µM), CKI-7 (CSNK1 and SGK inhibitor, 100 µM), TBCA (CSNK2 inhibitor, 25 µM), rapamycin and CKI-7, or rapamycin and TBCA, together with MG132 (10 µM). Cell lysates were subjected to immunoblot analysis after 12 h. Band intensities were measured, and phosphorylated-SQSTM1 values were normalized to total SQSTM1. The data are reported as means ± SD (n = 4). Statistical analyses were performed using one-way ANOVA, followed by the Tukey post-hoc test. *P < 0.01. (B) The dual and triple combination treatments of kinase inhibitors were further examined as described in A. Band intensities of S349-phosphorylated SQSTM1 were measured, and the data are reported as means ± SD (n = 4). Statistical analyses were performed using one-way ANOVA, followed by the Tukey post-hoc test. *P < 0.01. (C) Immunoprecipitates of SQSTM1-mycHis (WT, S349A, and S403A) were incubated with CSNK1 or CSNK2 for 1 h, followed by immunoblot analysis using anti-phosphorylated SQSTM1 (p-SQSTM1 [S349] and p-SQSTM1 [S403]) and anti-SQSTM1 antibodies. (D) Colocalization of SQSTM1 with ubiquitinated inclusions was examined when SQSTM1 (S349)-phosphorylation was inhibited by the treatment with kinase inhibitors (1 µM rapamycin, 100 µM CKI-7, and 25 µM TBCA). Immunocytochemical analysis was performed 12 h after treatment. Cell nuclei were counterstained blue with DAPI. Scale bar: 10 μm.
Figure 4.
Figure 4.
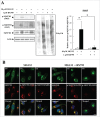
Colocalization of SQSTM1 with ubiquitinated inclusions is not affected by inhibition of SQSTM1 (S403)-phosphorylation. (A) HeLa cells were treated with a BX795 TBK1 inhibitor (1 μM) and MG132 (10 μM) for 12 h. Cell lysates were analyzed by immunoblot analysis. Band intensities were measured, and phosphorylated-SQSTM1 values were normalized to total SQSTM1. The data are reported as means ± SD (n = 4). Statistical analyses were performed using one-way ANOVA, followed by the Tukey post-hoc test. *P < 0.01. (B) Colocalization of SQSTM1 with ubiquitinated inclusions were immunocytochemically assessed in cells treated with MG132 alone (left) or MG132 and BX795 (right). Cell nuclei counterstained blue with DAPI. Scale bar: 10 μm.
Figure 5.
Figure 5.
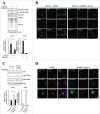
Phosphorylation of S349 and S403 on SQSTM1 is suppressed by a KRIBB11 HSF1 inhibitor. (A) HeLa cells were treated with 10 µM MG132 and 50 µM KRIBB11 for 12 h. Cell lysates were subjected to immunoblot analysis. Band intensities were measured, and phosphorylated SQSTM1 values were normalized to total SQSTM1. The data are reported as means ± SD (n = 4). Statistical analyses were performed using one-way ANOVA, followed by the Tukey post-hoc test. *P < 0.01. (B) Colocalization of SQSTM1 with ubiquitinated inclusions were immunocytochemically assessed in cells treated with MG132 alone (left) or MG132 and KRIBB11 (right). Cell nuclei were counterstained blue with DAPI. Scale bar: 10 μm. (C) HeLa cells were transiently transfected with mock control or pEGFP-STAT5A(E18Δ) (STAT5A[E18Δ]), and then treated (+) with or without (−) 50 µM KRIBB11. After 12 h, cell lysates were examined by immunoblot analysis. Band intensities of S349- and S403-phosphorylated SQSTM1 were measured, and the data are reported as means ± SD (n = 4). Statistical analyses were performed using one-way ANOVA, followed by the Tukey post-hoc test. *P < 0.01, **P < 0.05. (D) Colocalization of SQSTM1 with EGFP-STAT5A(E18Δ) were immunocytochemically assessed in cells treated with DMSO control (left) or KRIBB11 (right). Cell nuclei were counterstained blue with DAPI. Scale bar: 10 μm.
Figure 6.
Figure 6.
Suppression of SQSTM1 S349-phosphorylation in HSF1 KO cells. (A) HSF1 was targeted using the CRISPR/Cas9 system. Cell lysates of HSF1-WT and individual HSF1-targeted clones (#6 and #12) were subjected to immunoblot analysis with anti-HSF1, anti-SQSTM1, anti-HSPA1, and anti-actin. (B) HeLa WT, HeLa HSF1 KO, and HSF1 KO exogenously expressing HSF1 (HeLa HSF1 KO + pEF1-HSF1) were treated with 10 µM MG132 for 12 h. Cell lysates were examined by immunoblot analysis. Band intensities were measured, and phosphorylated-SQSTM1 values were normalized to total SQSTM1. The data are reported as means ± SD (n = 4). Statistical analyses were performed using one-way ANOVA, followed by the Tukey post-hoc test. *P < 0.01, **P < 0.05. (C) Colocalization of SQSTM1 with ubiquitinated inclusions were immunocytochemically assessed in cells treated with MG132. Cell nuclei were counterstained blue with DAPI. Scale bar: 10 μm.
Figure 7.
Figure 7.
Reduction of EGFP-STAT5A(E18Δ) clearance by inhibition of SQSTM1 phosphorylation. (A) For formation of EGFP-STAT5A(E18Δ) aggregates, HeLa TREx-EGFP-STAT5A(E18Δ) cells were cultured in medium containing tetracycline and 2.5 µM MG132 plus mock, or kinase inhibitors (rapamycin, CKI-7, and TBCA), or KRIBB11. The medium was replaced with normal medium containing mock, or kinase inhibitors, or KRIBB11 and cells were fixed after 0, 12, or 24 h, followed by DAPI staining. The images were obtained by fluorescence microscopy. Scale bar: 100 μm. (B) EGFP-STAT5A(E18Δ) intensities were measured by an IN Cell Analyzer 2200. Values of EGFP intensity in individual cells were plotted on graphs (right), which show means ± SD. Statistical analyses were performed using one-way ANOVA, followed by the Tukey post-hoc test. *P< 0.01. Cell count (%) was plotted against EGFP-STAT5A(E18Δ) intensity (right). Upper, middle, and lower graphs show 0 h, 12 h, and 24 h, respectively. (C) Expression levels of ATG5 and ATG7 in HeLa_WT (open boxes), KRIBB11-treated HeLa (gray boxes), and HeLa HSF1 KO (closed boxes) cells were measured by real-time PCR. Relative expression values of target genes were normalized against the housekeeping gene GPD/G3PDH (glycerol-3-phosphate dehydrogenase) and are reported as means ± SD (n = 4). Statistical analyses were performed using one-way ANOVA, followed by the Tukey post-hoc test. (D) Autophagosome formation in HeLa_WT, kinase inhibitors (rapamycin, CKI-7, and TBCA) treated HeLa, KRIBB11-treated HeLa, and HeLa HSF1 KO cells was immunocytochemically examined using an anti-LC3 antibody. Cells were cultured in normal conditions (left panels), starvation conditions (middle panels), and with MG132 (right panels) for 5 h. Cell nuclei were counterstained blue with DAPI. Scale bar: 10 μm. a.u., arbitrary units.
Figure 8.
Figure 8.
Schematic model of the proteostasis network via the HSF1-SQSTM1 axis. HSF1 is activated by the accumulation of harmful proteins, resulting in the induction of cytoprotective genes including HSPs. Moreover, phosphorylation of SQSTM1 by MTORC1, CSNK1, and TBK1 is also induced via activation of HSF1. Phosphorylated SQSTM1 accelerates inclusion formation and autophagic clearance of harmful proteins.

Similar articles

Cited by

References

    1. Labbadia J, Morimoto RI. The biology of proteostasis in aging and disease. Annu Rev Biochem 2015; 84:435-64; PMID:25784053; http://dx.doi.org/10.1146/annurev-biochem-060614-033955 - DOI - PMC - PubMed
    1. Morimoto RI. Regulation of the heat shock transcriptional response: cross talk between a family of heat shock factors, molecular chaperones, and negative regulators. Genes Dev 1998; 12:3788-96; PMID:9869631; http://dx.doi.org/10.1101/gad.12.24.3788 - DOI - PubMed
    1. Rubinsztein DC. The roles of intracellular protein-degradation pathways in neurodegeneration. Nature 2006; 443:780-6; PMID:17051204; http://dx.doi.org/10.1038/nature05291 - DOI - PubMed
    1. Johansen T, Lamark T. Selective autophagy mediated by autophagic adapter proteins. Autophagy 2011; 7:279-96; PMID:21189453; http://dx.doi.org/10.4161/auto.7.3.14487 - DOI - PMC - PubMed
    1. Knaevelsrud H, Simonsen A. Fighting disease by selective autophagy of aggregate-prone proteins. FEBS Lett 2010; 584:2635-45; PMID:20412801; http://dx.doi.org/10.1016/j.febslet.2010.04.041 - DOI - PubMed

MeSH terms