. 2016 Nov 22;17(9):2445-2459.
doi: 10.1016/j.celrep.2016.10.052. Epub 2016 Nov 10.

Macrophage Ontogeny Underlies Differences in Tumor-Specific Education in Brain Malignancies

Affiliations

Macrophage Ontogeny Underlies Differences in Tumor-Specific Education in Brain Malignancies

Robert L Bowman et al. Cell Rep. .

Abstract

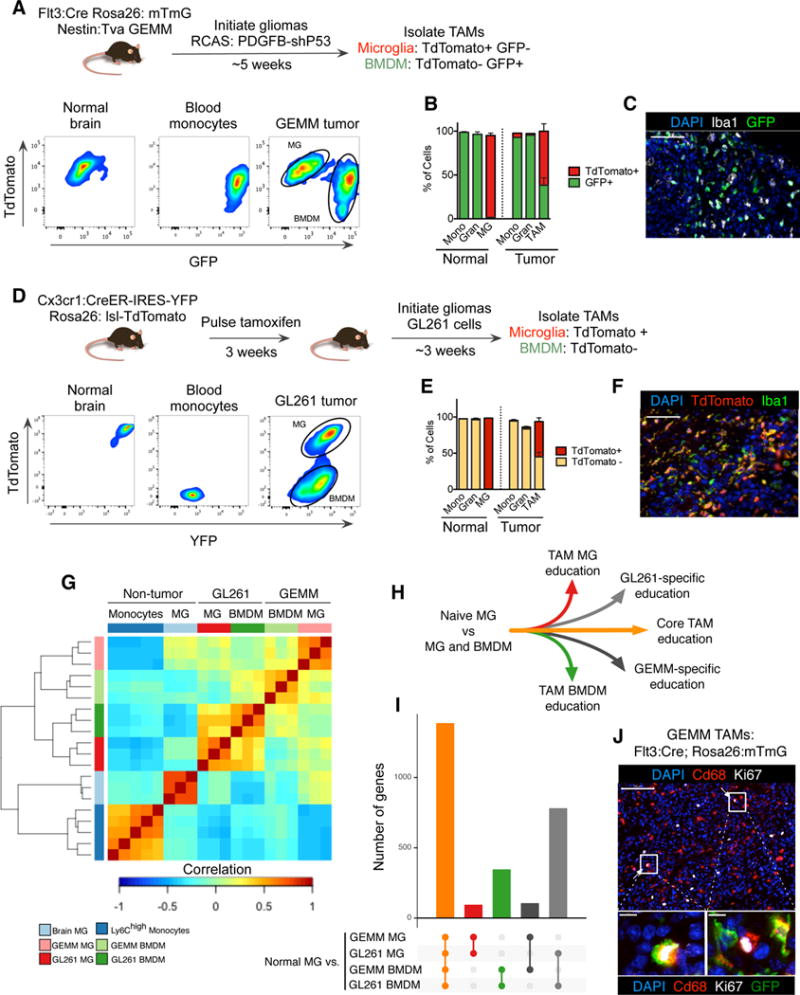
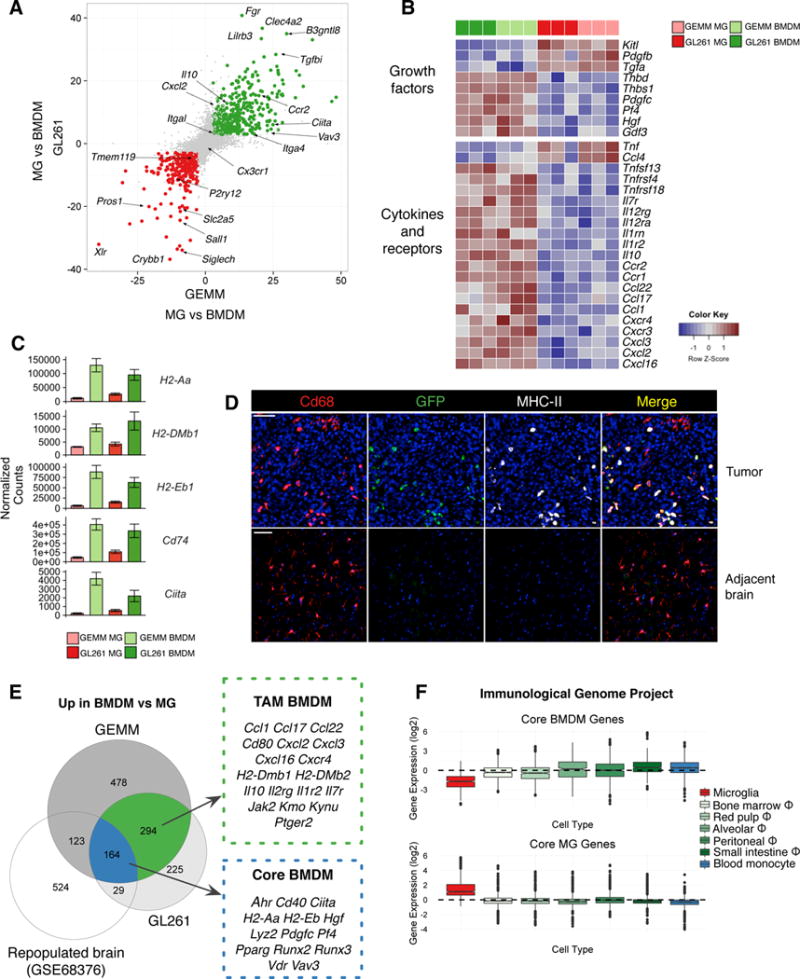
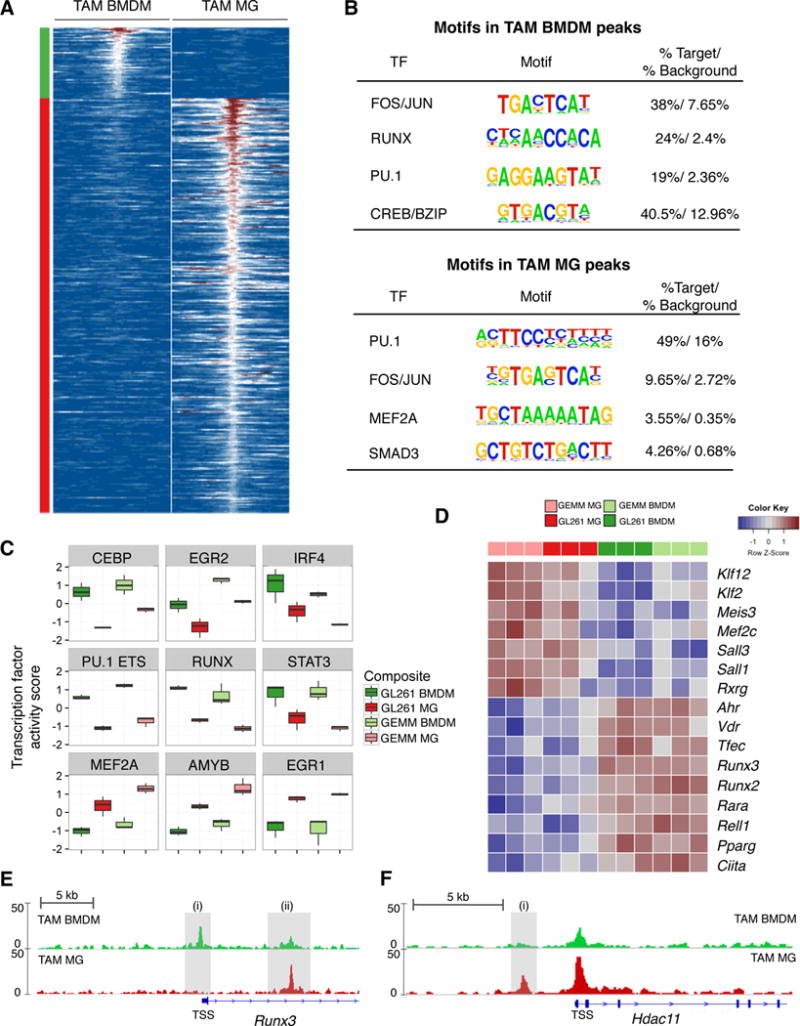
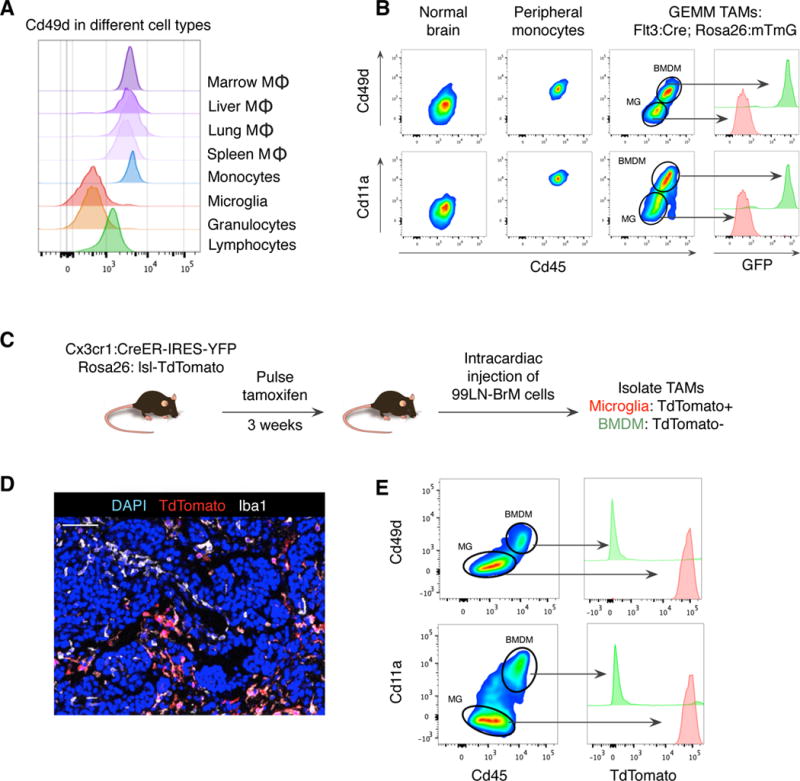
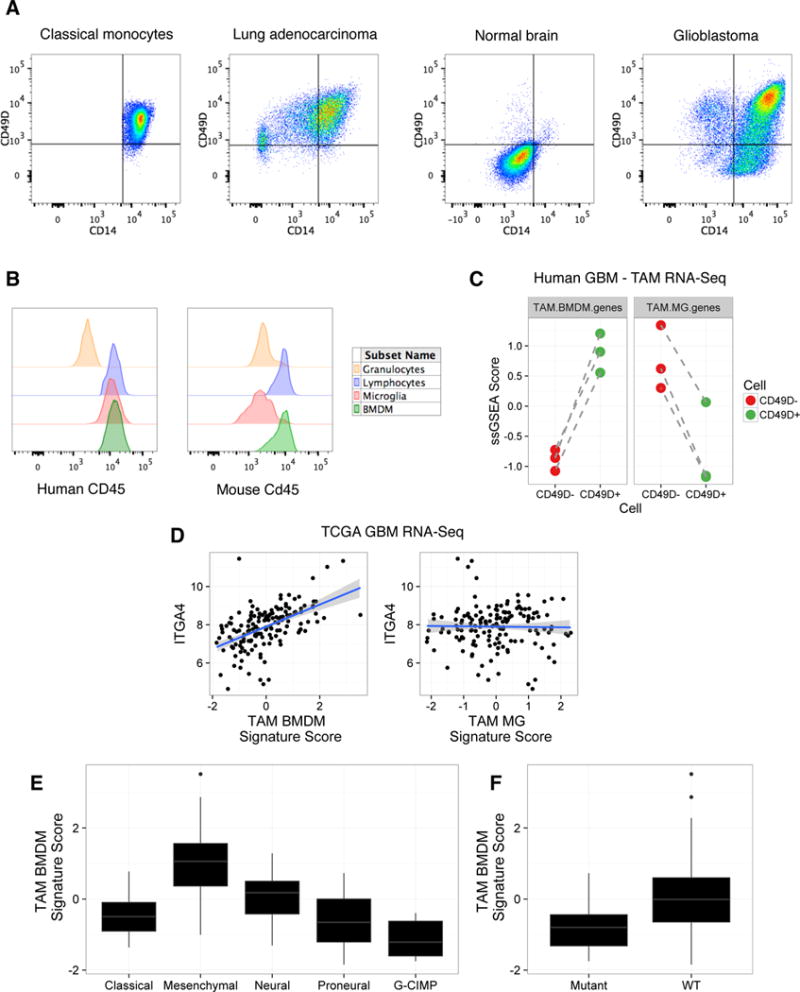
Extensive transcriptional and ontogenetic diversity exists among normal tissue-resident macrophages, with unique transcriptional profiles endowing the cells with tissue-specific functions. However, it is unknown whether the origins of different macrophage populations affect their roles in malignancy. Given potential artifacts associated with irradiation-based lineage tracing, it remains unclear if bone-marrow-derived macrophages (BMDMs) are present in tumors of the brain, a tissue with no homeostatic involvement of BMDMs. Here, we employed multiple models of murine brain malignancy and genetic lineage tracing to demonstrate that BMDMs are abundant in primary and metastatic brain tumors. Our data indicate that distinct transcriptional networks in brain-resident microglia and recruited BMDMs are associated with tumor-mediated education yet are also influenced by chromatin landscapes established before tumor initiation. Furthermore, we demonstrate that microglia specifically repress Itga4 (CD49D), enabling its utility as a discriminatory marker between microglia and BMDMs in primary and metastatic disease in mouse and human.

Keywords: CD49D; Macrophage; brain metastasis; glioma; microglia; tumor-associated macrophages.


Figures

Figure 1
Figure 1. Lineage tracing systems demonstrate heterogeneity in TAM ontogeny in multiple models of glioma
(A) Experimental scheme for the GEMM-shP53 model, see Supplemental Experimental Procedures for details. Representative flow cytometry panels for TdTomato and GFP are shown for Cd45+Cd11b+Ly6GLy6C microglia (MG), Cd45+Cd11b+Ly6GLy6C+ monocytes, and Cd45+Cd11b+Ly6GLy6CTAMs from GEMM-shP53 gliomas. (B) Quantitation of TdTomato+ and GFP+ monocytes (Mono) and granulocytes (Gran) in peripheral blood, MG in non-tumor bearing brain, and monocytes, granulocytes and TAMs in GEMM-shP53 gliomas as depicted in (A). Bars represent mean and s.e.m. n=3–5 for each group. (C) Representative immunofluorescence (IF) staining of Iba1 (white), GFP (green) and DAPI (blue) in a GEMM-shP53 tumor as depicted in (A). Scale bar: 50μm. Representative of n=5 tumors. (D) Experimental design for Cx3cr1 lineage tracing model, see methods for details. Monocytes, MG and TAMs were isolated as described in (A), and evaluated for TdTomato and YFP reporter expression. Representative of n=3 mice. (E) Flow cytometry quantitation of TdTomato+ and TdTomato monocytes and granulocytes in peripheral blood, MG in non-tumor bearing brain, and monocytes, granulocytes and TAMs in GL261 gliomas as depicted in (D). Bars represent mean and s.e.m. n=3 for each group. (F) Representative IF staining for Iba1 (green), TdTomato (red) and DAPI (blue) in a GL261 tumor. Scale bar: 50μm. (G) Pairwise correlation matrix of normalized RNA-seq counts from monocytes (n=5), normal MG (n=3), and the four TAM populations from the different models: GEMM-shP53 TAM MG, GEMM-shP53 TAM BMDM, GL261 TAM MG, and GL261 TAM BMDM (n=3 for each group). (H) Diagram depicting different modules of TAM education compared to normal MG. (I) Differentially expressed genes between normal MG and the four TAM populations were tabulated. Barchart depicts the number of differentially expressed genes shared between the different groups, (J) Representative IF staining of Ki67+ TAM BMDM and TAM MG in the GEMM-shP53 model as depicted in (A). Ki67 (white), CD68 (red), DAPI (blue), GFP (green) (omitted from top panel). Scale bars: 100μm on upper panel, 10μm on lower panels. Representative of n=5 tumors.
Figure 2
Figure 2. TAM BMDM and TAM MG possess distinct gene expression patterns
(A) Scatterplot depicting −log10(pvalue)*sign(fold change) between TAM BMDM and TAM MG in GEMM-shP53 gliomas (x-axis) and GL261 gliomas (y-axis). Significantly upregulated genes (log2 fold change > ±1 and FDR<1%) are in green for BMDM and red for MG. (B) Heatmap depicting row-normalized log2 gene expression values for indicated genes in GL261 TAM BMDM (dark green), GEMM-shP53 TAM BMDM (light green), GL261 TAM MG (dark red), and GEMM-shP53 TAM MG (light red). (C) Barplots depicting normalized gene expression values for indicated genes in these four different TAM populations. Bars represent mean ± s.e.m. (D) Representative IF staining in GEMM-shP53 Flt3:Cre Rosa26:mTmG gliomas and adjacent normal brain for Cd68 (red, AlexaFluor-594), GFP (green) and MHC-II (white). DAPI is shown in blue and TdTomato fluorescence is not shown. Scale bar: 100μm. Representative of n=5 tumors. (E) Venn diagram depicting significantly upregulated genes in BMDM vs MG in GL261 model, GEMM-shP53, and non-malignant brain (GSE68376 dataset). Select genes are listed. (F) Boxplot of Core BMDM genes (Figure 2E) and Core MG genes (Figure S2D) where each data point represents the z-scored expression of a gene across the indicated cell populations using available datasets from the Immunological Genome Project.
Figure 3
Figure 3. Cell-specific transcription factor activities underlie differences between TAM BMDM and TAM MG
(A) Heatmap depicting ATAC-seq signal 1kb upstream and downstream of peaks specifically enriched in GL261 TAM BMDM (left panel) and GL261 TAM MG (right). Peaks were selected based on association with differentially expressed genes between TAM BMDM (top, green) and TAM MG (bottom, red). (B) Motifs identified by HOMER to be enriched in TAM BMDM and TAM MG peaks shown in (A). (C) Boxplots depicting normalized TF activity scores for indicated motifs across TAM BMDM and TAM MG from GL261 and GEMM-shP53 gliomas. (D) Heatmap depicting row-normalized log2 gene expression values for indicated genes in four different TAM populations. (E-F) ATAC-sequencing tracks from TAM BMDM (top, green) and TAM MG (bottom, red) from GL261 gliomas for (E) Runx3 and (F) Hdac11. Shaded grey regions indicate peaks specifically referenced in text. Y-axis values indicate tags per 10,000,000 with a range of 0–50. TSS denotes transcription start site.
Figure 4
Figure 4. Itga4/Cd49d distinguishes TAM BMDM and TAM MG in murine brain malignancy
(A) Histogram of Cd49d expression for indicated populations from non-tumor bearing mice. (B) Flow cytometry for Cd45 and either Cd49d (top) or Cd11a (bottom) in normal blood monocytes, normal MG (from adjacent normal brain), or TAMs isolated from Flt3:Cre Rosa26:mTmG mice with GEMM-shP53 tumors. Adjacent histograms indicate GFP expression in indicated populations. (C) Experimental schematic for 99LN-BrM model in Cx3cr1-lineage tracing mice. (D) Representative IF staining of TdTomato (red), Iba1 (white) and DAPI (blue) 99LN-BrM tumors as depicted in (C). Scale bar: 50μm. (E) Flow cytometry as in (B) for 99LN-BrM model, with TdTomato expression indicated in the adjacent histogram. Flow plots are representative of n=5–8 mice.
Figure 5
Figure 5. CD49D discriminates TAM BMDM and TAM MG in human brain malignancy
(A) Classical monocytes, MG, and TAMs were defined as CD45+CD11B+CD66BCD14+CD16. Gated cells are then shown for CD14 and CD49D in representative samples of human classical monocytes from peripheral blood (n=6), TAMs from a lung adenocarcinoma patient (n=6), MG from a non-malignant brain (n=3), and TAMs from a GBM patient (n=3). (B) Histogram of CD45 expression by flow cytometry in human (left) and mouse (right) samples. In human GBM, CD45 expression is shown for granulocytes (CD45+CD11B+CD66B+CD16+CD14low), lymphocytes (CD45+CD11B), TAM MG (CD45+CD11B+CD66BCD16CD14+CD49D) and TAM BMDM (CD45+CD11B+CD66BCD16CD14+CD49D+). In mouse, Cd45 expression is shown for granulocytes (Cd45+Cd11b+Ly6ClowLy6G+), lymphocytes (Cd45+Cd11b), TAM MG (Cd45+Cd11b+Ly6CLy6GTomato+GFP) and TAM BMDM (Cd45+Cd11b+Ly6CLy6GTomatoGFP+) from a Flt3:Cre Rosa26:mTmG GEMM-shP53 glioma. Representative of n=3 patients and n=5 mice. (C) Z-scored single sample gene set enrichment analysis scores for TAM BMDM genes (left, paired t-test, p≤5.01×10⁻³) and TAM MG genes (right, paired t-test, p≤7.78×10⁻³) in matched CD49D and CD49D+ TAMs from GBM patients. Dashed lines indicate matched samples (n=3 patients). (D) Scatterplot of TAM BMDM signature score (x-axis, left, Spearman rho=0.564, p≤2.2×10⁻¹⁶) and TAM MG signature score (x-axis, right, Spearman rho=0.067, p≤0.411) and ITGA4 expression (y-axis) from TCGA-GBM RNA-seq data. Solid blue line indicates line of best fit with shaded areas depicting standard deviation confidence intervals. (E-F) Z-scored TAM BMDM signature scores across (E) GBM subtype (ANOVA p≤2.2×10⁻¹⁶), and (F) IDH1 mutation status (Student’s t-test p≤5.93×10⁻³).

Similar articles

Cited by

References

    1. Ajami B, Bennett JL, Krieger C, Tetzlaff W, Rossi FM. Local self-renewal can sustain CNS microglia maintenance and function throughout adult life. Nat Neurosci. 2007;10:1538–1543. - PubMed
    1. Alder JK, Georgantas RW, 3rd, Hildreth RL, Kaplan IM, Morisot S, Yu X, McDevitt M, Civin CI. Kruppel-like factor 4 is essential for inflammatory monocyte differentiation in vivo. J Immunol. 2008;180:5645–5652. - PMC - PubMed
    1. Biffi A, De Palma M, Quattrini A, Del Carro U, Amadio S, Visigalli I, Sessa M, Fasano S, Brambilla R, Marchesini S, et al. Correction of metachromatic leukodystrophy in the mouse model by transplantation of genetically modified hematopoietic stem cells. J Clin Invest. 2004;113:1118–1129. - PMC - PubMed
    1. Bos PD, Zhang XH, Nadal C, Shu W, Gomis RR, Nguyen DX, Minn AJ, van de Vijver MJ, Gerald WL, Foekens JA, Massague J. Genes that mediate breast cancer metastasis to the brain. Nature. 2009;459:1005–1009. - PMC - PubMed
    1. Bowman RL, Joyce JA. Therapeutic targeting of tumor-associated macrophages and microglia in glioblastoma. Immunotherapy. 2014;6:663–666. - PubMed

Publication types

MeSH terms