. 2016 Nov 24;539(7630):565-569.
doi: 10.1038/nature20138. Epub 2016 Nov 9.

Different tissue phagocytes sample apoptotic cells to direct distinct homeostasis programs

Affiliations

Different tissue phagocytes sample apoptotic cells to direct distinct homeostasis programs

Ryan J Cummings et al. Nature. .

Abstract

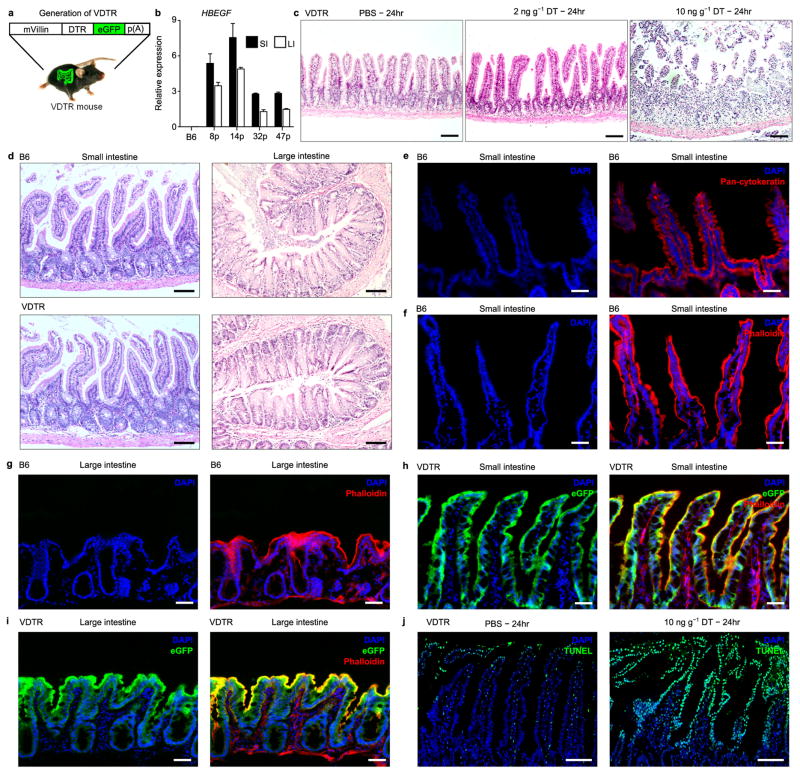
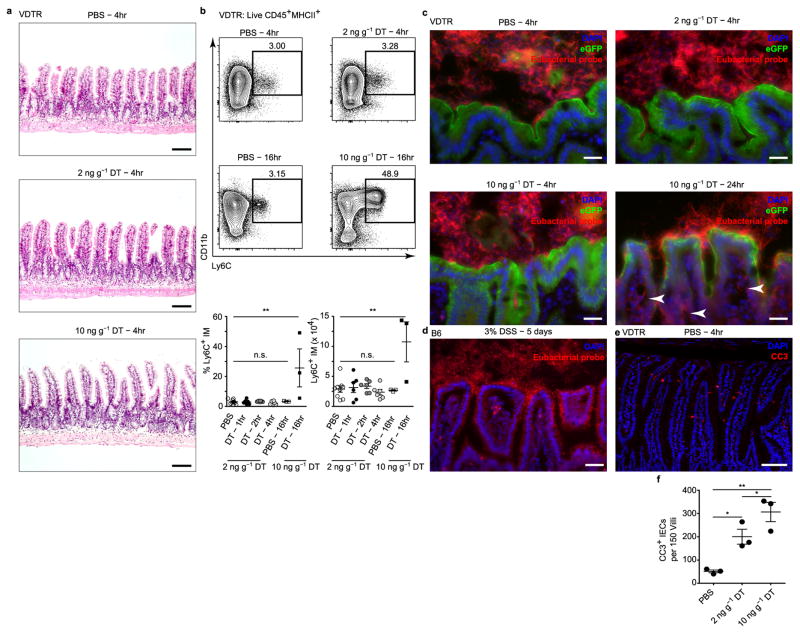
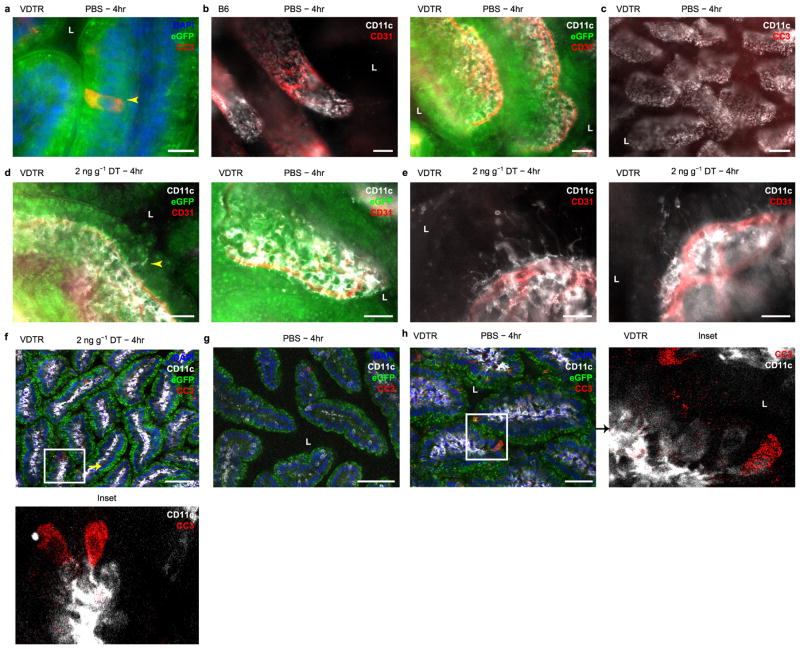
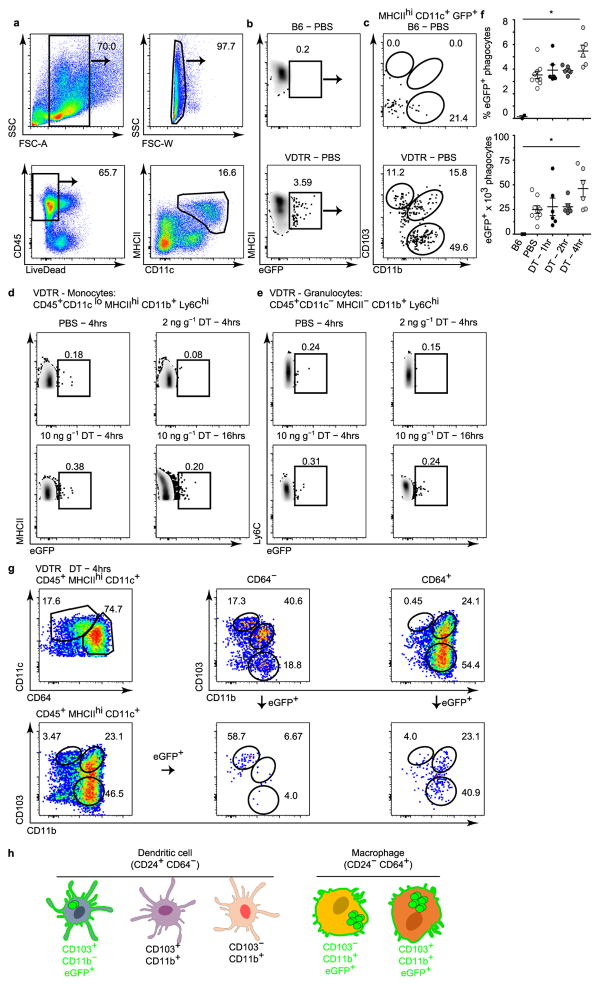
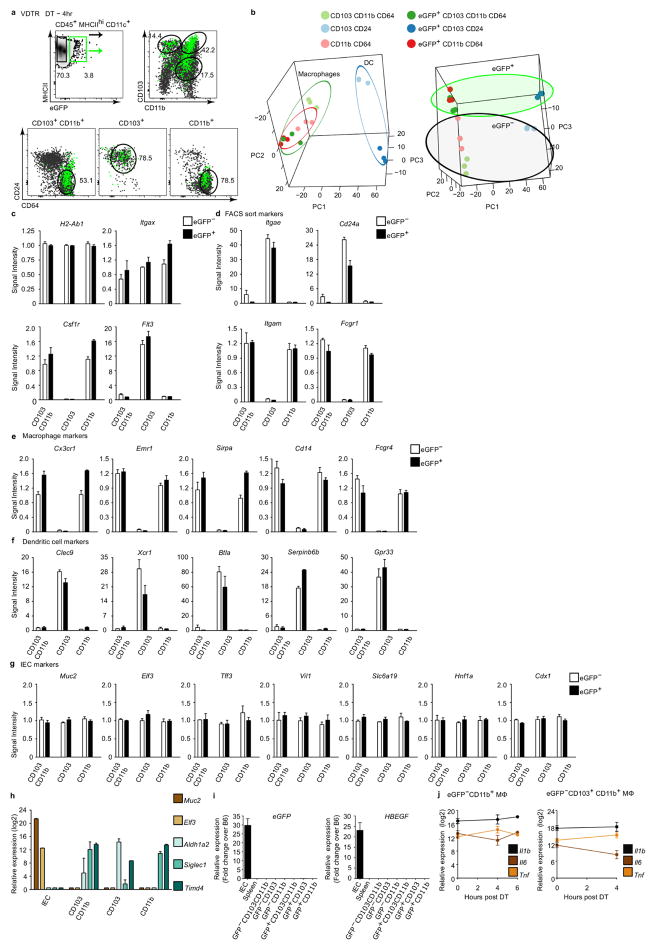
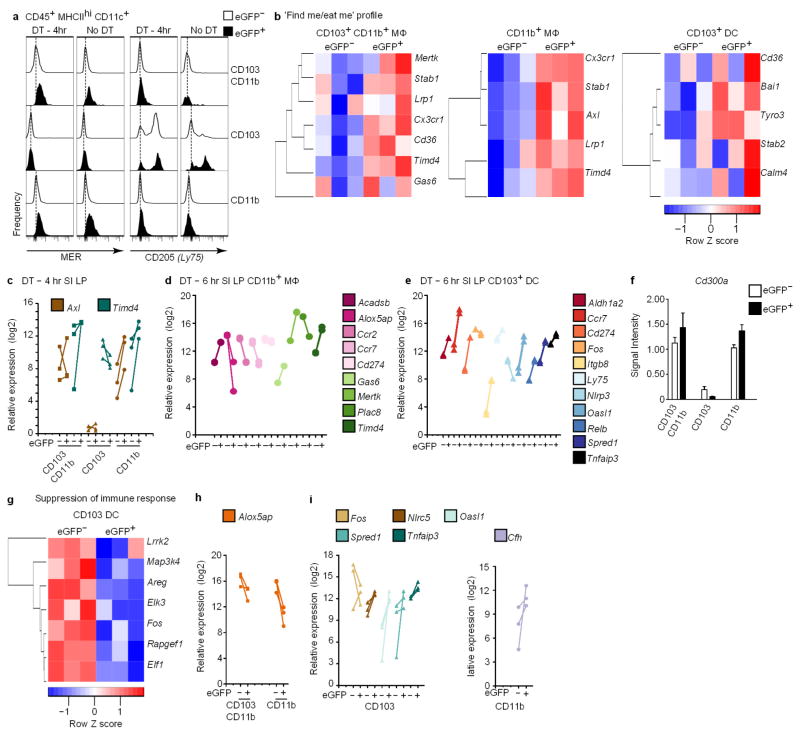
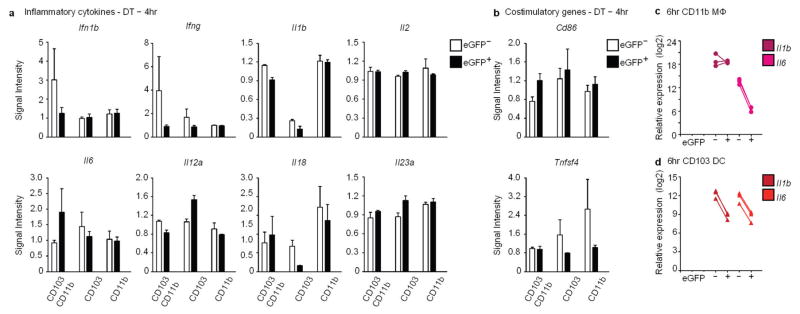
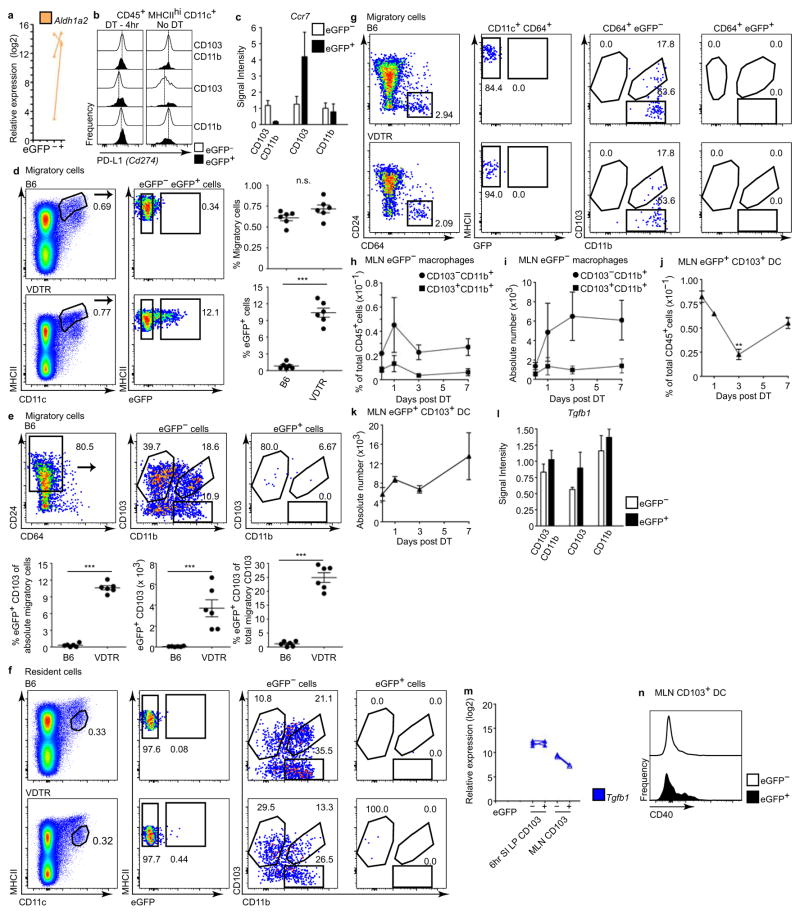
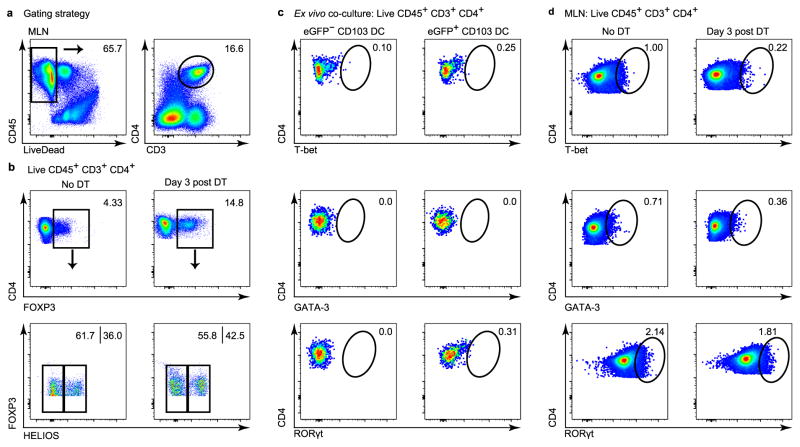
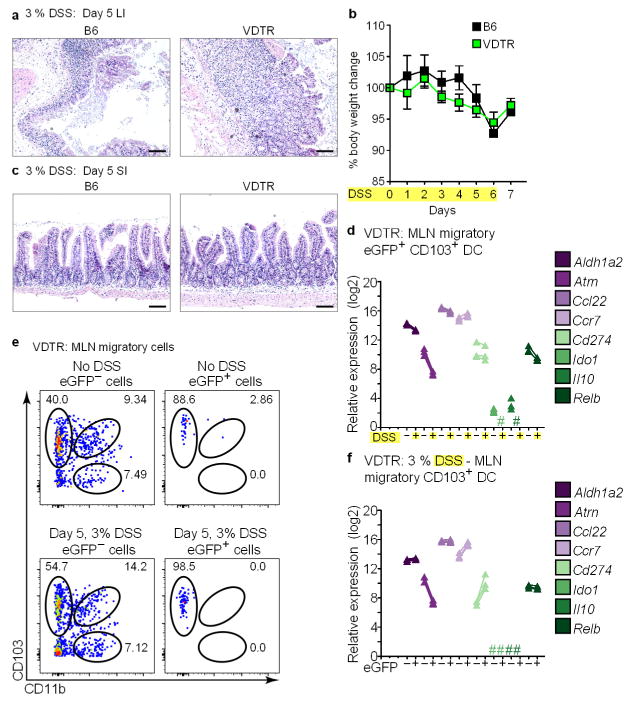
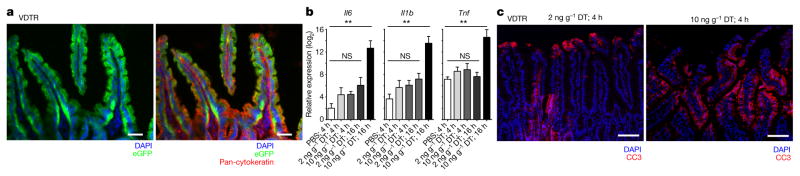
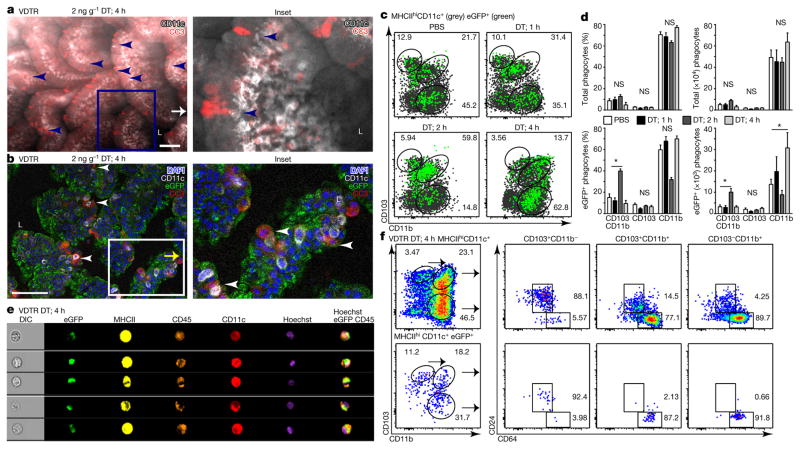
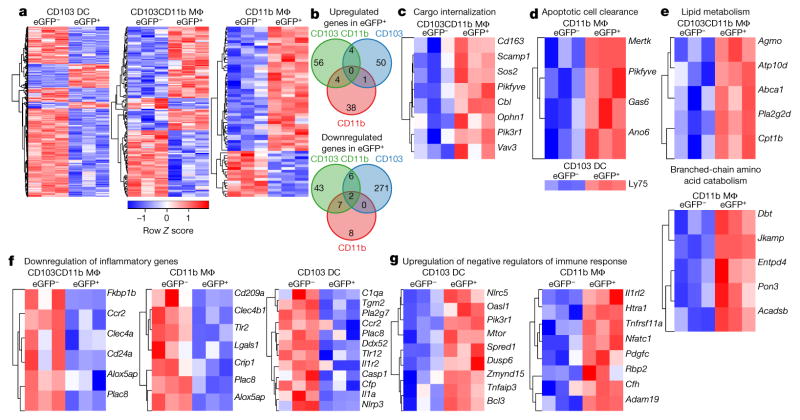
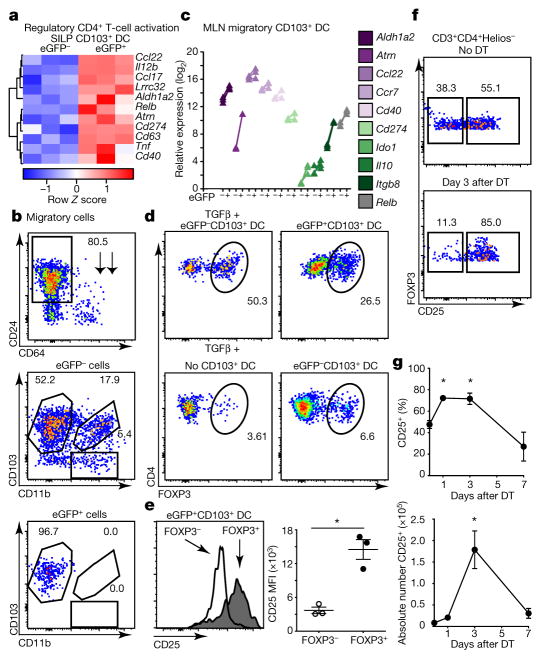
Recognition and removal of apoptotic cells by professional phagocytes, including dendritic cells and macrophages, preserves immune self-tolerance and prevents chronic inflammation and autoimmune pathologies. The diverse array of phagocytes that reside within different tissues, combined with the necessarily prompt nature of apoptotic cell clearance, makes it difficult to study this process in situ. The full spectrum of functions executed by tissue-resident phagocytes in response to homeostatic apoptosis, therefore, remains unclear. Here we show that mouse apoptotic intestinal epithelial cells (IECs), which undergo continuous renewal to maintain optimal barrier and absorptive functions, are not merely extruded to maintain homeostatic cell numbers, but are also sampled by a single subset of dendritic cells and two macrophage subsets within a well-characterized network of phagocytes in the small intestinal lamina propria. Characterization of the transcriptome within each subset before and after in situ sampling of apoptotic IECs revealed gene expression signatures unique to each phagocyte, including macrophage-specific lipid metabolism and amino acid catabolism, and a dendritic-cell-specific program of regulatory CD4+ T-cell activation. A common 'suppression of inflammation' signature was noted, although the specific genes and pathways involved varied amongst dendritic cells and macrophages, reflecting specialized functions. Apoptotic IECs were trafficked to mesenteric lymph nodes exclusively by the dendritic cell subset and served as critical determinants for the induction of tolerogenic regulatory CD4+ T-cell differentiation. Several of the genes that were differentially expressed by phagocytes bearing apoptotic IECs overlapped with susceptibility genes for inflammatory bowel disease. Collectively, these findings provide new insights into the consequences of apoptotic cell sampling, advance our understanding of how homeostasis is maintained within the mucosa and set the stage for development of novel therapeutics to alleviate chronic inflammatory diseases such as inflammatory bowel disease.


Conflict of interest statement

The authors declare no competing financial interests.

Figures

Extended Data Figure 1
Extended Data Figure 1. No gross anatomical changes in the small or large intestine of VDTR mice
a, The primate diphtheria toxin receptor (DTR)–eGFP transgene driven by the mouse villin promoter (mVillin). b, qRT–PCR for relative expression of primate diphtheria toxin receptor (HBEGF (‘DTR’)) mRNA in both the small and large intestine of four different DTR–eGFP transgenic (VDTR) founder lines. Founder 32p was selected to propagate the VDTR line on the basis of specific transgene expression in the intestinal tract and not in other organs. c, d, Haematoxylin and eosin staining (H&E) of small intestine and large intestine paraffin sections from treated VDTR (c) and untreated C57BL/6 (B6) and VDTR (d) as indicated. ei, Immunofluorescence of small intestine (e, f, h) and large intestine (g, i) cryo-sections from indicated mice after staining with phalloidin or pan-cytokeratin and DAPI as indicated. j, TUNEL (eGFP-quenched after paraffin embedding). p(A), polyadenylation. Scale bars, 100 μm (c, d, j), 50 μm (ei).
Extended Data Figure 2
Extended Data Figure 2. The intestinal microenvironment does not become inflamed following 2 ng g−1 diphtheria toxin administration
a, Haematoxylin and eosin stain of paraffin-embedded sections from small intestine of VDTR mice at 4 h following PBS or diphtheria toxin administration. b, Flow cytometry of SILP cells from VDTR mice treated with PBS or diphtheria toxin. Pre-gated on live CD45+MHCII+ cells. Numbers above gates indicate percentage of positively stained cells. Quantification is shown in bottom panels. IM, inflammatory monocytes. We noted no tissue destruction or discernible inflammation (a), nor infiltration of Ly6Chi monocytes (b) at 4 h with either dose of diphtheria toxin, in contrast to infiltration of these cells at 16 h following 10 ng g−1 diphtheria toxin. n = 9 mice for PBS, n = 6 mice for diphtheria toxin at 1–4 h, and n = 3 for PBS and diphtheria toxin at 16 h. One-way ANOVA; **P < 0.01; NS, not significant. Flow cytometry gates are representative of at least three independent experiments. Data are mean ±s.e.m. c, d, In situ hybridization with a eubacterial probe on large intestine cryo-sections following PBS or diphtheria toxin administration to VDTR mice (c), or 3% dextran sodium sulphate (DSS) treatment of B6 mice for 5 days (d). c, Arrowheads indicate presence of eubacterial probe in SILP. There was no bacterial translocation to the intestinal lamina propria at 4-h post-treatment with either 2 ng g−1 or 10 ng g−1 diphtheria toxin, as evidenced by luminal confinement of the in-situ-hybridized eubacterial probe signal, and similar to that in PBS-treated controls. e, Immunofluorescence on small-intestine paraffin sections stained with antibodies to CC3 at 4 h following PBS injection. f, Quantification from e and Fig. 1c. Scale bars, 100 μm (a, e), 25 μm (c, d).
Extended Data Figure 3
Extended Data Figure 3. Ileum lamina propria CD11c+ phagocytes extend dendrites towards apoptotic intestinal epithelial cells
ah, Conventional (ae) and confocal (fh) whole-mount microscopy of excised ileum from B6 or VDTR mice following PBS or diphtheria toxin as indicated. b, c, e, eGFP not overlaid. Insets from f and h depicted in bottom and right panels, respectively, without eGFP overlay. L, lumen. Arrowhead in a points to a CC3+ IEC; in d, to a CD11c+ dendrite. Scale bars, 25 μm (a, e), 50 μm (b, d, h), 100 μm (c, f, g).
Extended Data Figure 4
Extended Data Figure 4. Flow cytometry gating strategy for identifying CD11c+ and CD11c−/lo phagocytes in the SILP of VDTR mice
ae, g, Flow cytometric analyses of SILP cells from VDTR mice. Numbers indicate the percentage of gated populations. a, Gating strategy for total CD11c+ phagocytes. b, Identification of the eGFP+ gate on the basis of the small intestine cellular profile from B6 (eGFP) mice. c, CD103 and CD11b expression on gated cells in b. d, Monocytes pre-gated on live CD45+CD11cloMHCIIhiCD11b+Ly6Chi cells. e, Granulocytes pre-gated on live CD45+CD11cMHCIICD11b+Ly6Chi cells. f, Percentage of cells and absolute numbers from b. g, Dendritic cells and macrophages pre-gated on live CD45+MHCIIhiCD11c+ cells, further identified as CD64 and CD64+, respectively. Gating on differential CD64 expression, followed by delineation of CD103 and CD11b expression, also distinguished two macrophage and three dendritic cell populations. Data represent at least three independent experiments and in f, n = 3 B6 mice; n = 6 VDTR mice treated with 2 ng g−1 diphtheria toxin for 1–4 h; n = 9 VDTR mice treated with PBS; one-way ANOVA; *P < 0.05. Data are mean ±s.e.m. h, Schematic of SILP phagocytes that sample apoptotic IECs (green).
Extended Data Figure 5
Extended Data Figure 5. eGFP+ and eGFPCD11c+ phagocyte populations exhibit distinct transcriptional profiles
a, FACS-sorted dendritic cell and macrophage populations from the SILP of VDTR mice at 4 h following diphtheria toxin administration using the gating strategy described in Fig. 2f, which included CD24 and CD64. b, Principal Component Analysis (PCA) of the 1,534 genes (ANOVA Q <0.05; 4.8% of total) with most variable expression in dendritic cell and macrophage (Mϕ) subsets, with (eGFP+) or without (eGFP) apoptotic IEC cargo. PCA-separated macrophages from dendritic cells (left panel) and eGFP+ from eGFP (right panel). We confirmed the purity and identity of sorted phagocytes on the basis of relative expression of genes encoding the molecules used for FACS sorting, as well as macrophage and dendritic-cell-specific genes. cg, Signal intensity of genes encoding MHCII (H2-Ab1) and CD11c (Itgax), shared by both dendritic cells and macrophages, the macrophage-specific Csf1 receptor (Csf1r), and the dendritic-cell-specific kinase Flt3 (Flt3) in CD11c+ phagocytes (c); molecules used for FACS sorting (d); macrophage markers (e); dendritic cell markers (f); and IEC markers from analyses of microarray experiments (g). It should be noted that IEC-specific genes were not increased in eGFP+ compared to eGFP phagocytes indicating negligible contamination by IEC-specific transcripts. Data represent five independent experiments with four mice per experiment and three biological replicates. White and black bars indicate expression from eGFP and eGFP+ phagocytes, respectively. h, Validation by qRT–PCR for IEC-specific genes including Muc2 (mucin-2) and Elf3 (E74-like factor 3), which were not expressed by phagocytes but readily detectable in sorted IECs. Conversely, phagocyte-specific transcripts (Aldh1a2, Siglec1 and Timd4) were expressed in sorted phagocytes but not in IECs. Data represent two independent experiments depicting relative expression (log2). i, qRT–PCR quantification of relative eGFP expression and the primate diphtheria toxin receptor (HBEGF or ‘DTR’) from VDTR IECs, spleen cells, and eGFP and eGFP+ phagocytes. As expected, expression of the eGFP and DTR (HBEGF) transgenes were confined to IECs in VDTR mice and not present in sorted dendritic cell or macrophages. Data represent two independent experiments depicting fold change over C57BL/6J litter mate controls. j, qRT–PCR relative expression (log2) of inflammatory transcripts from indicated eGFP SILP macrophages over time. The unchanged expression of Il1b, Il6, and Tnf in eGFPCD11b+ and CD103+CD11b+ macrophages, which served as sentinels of the microenvironment, provided further evidence for lack of inflammation induction by low-dose 2 ng g−1 diphtheria toxin. Note that the unique transcriptional profiles of eGFP+ phagocytes may belong to pre-existing subpopulations that become detectable only when marked by eGFP, owing to an inherently superior capacity for apoptotic cell sampling. However, we consider it more likely that the differential gene expression patterns between eGFP+ and eGFP populations are a consequence of apoptotic IEC internalization. Data represent three independent analytical repeats and one biological replicate consisting of three mice per time point. Data are mean ±s.e.m.
Extended Data Figure 6
Extended Data Figure 6. Further validation of the differential gene expression profiles following apoptotic IEC sampling
a, Flow cytometry validation for MER and CD205 (Ly75) protein upregulation either in the steady state or 4 h after diphtheria toxin administration, reflecting transcript data shown in Fig. 3d. Flow cytometry representative of at least three independent experiments. b, g, Hierarchical clustering of differentially expressed ‘find me/eat me’ receptor (b) and ‘suppression of immune response’ (g) genes at 4 h after diphtheria toxin administration. Differences in expression did (g) and did not (b) meet statistical significance of at least 1.2-fold (ANOVA (Q < 0.05) and Tukey’s HSD post-hoc test (P <0.05); −1.2> fold > 1.2) comparing eGFP+ and eGFP phagocytes at 4 h following diphtheria toxin administration; expressed by row Z scale and relative expression (log2). In b, upregulated genes correlating with eGFP content included Cx3cr1 (the receptor for the ‘find me’ signal fractalkine) and TAM family receptor Axl by CD11b+ macrophages, as well as Tyro3 by CD103+ dendritic cells. Different members of the Stabilin family of scavenger receptors, Adgrb1, Stab1/2, required for apoptotic cell clearance, as well as Timd4, which binds to exposed phosphatidylserine, were differentially expressed by macrophages and CD103+ dendritic cells. Data represent five independent experiments with four mice per experiment and three biological replicates. Many genes in b and g remained differentially regulated at 6 h after diphtheria toxin administration (see d and e), showing a stable profile not unique to the 4-h time point. c, qRT–PCR validation for Axl and Timd4 in SILP phagocytes at 4 h after diphtheria toxin administration. d, e, qRT–PCR quantification of relative gene expression in the indicated eGFP and eGFP+ populations (log2). CD11b+ macrophages (d) and CD103+ dendritic cells (e) from the SILP at 6 h following diphtheria toxin administration. Expression of Ccr7, encoding the chemotactic receptor required for migration into mesenteric lymph nodes where priming of naive T cells occurs, was higher in SILP eGFP+CD103+ dendritic cells, but not macrophages, relative to their eGFP counterparts (Extended data Fig. 8c), and remained high in eGFP+CD103+ dendritic cells at 6 h after diphtheria toxin administration (e) compared to the downregulation by eGFP+ cells relative to eGFPCD11b+ macrophages (d). Data represent two independent analytical repeats and one biological replicate consisting of three mice. f, Signal intensity of Cd300a, encoding an inhibitory receptor reported to bind apoptotic cell-exposed phosphatidylserine and suppress commensal-driven IFNβ production by large intestine lamina propria CD103CD11b+CX3CR1+F4/80lo–int cells, from microarray analyses conducted at 4 h after diphtheria toxin administration, showing similar levels in SILP eGFP+ and eGFP macrophages and CD103+ dendritic cells indicated on the x axis. Data did not meet statistical significance of at least 1.2-fold (ANOVA (Q < 0.05) and Tukey’s HSD post-hoc test (P <0.05); −1.2> fold > 1.2) and represent five independent experiments with 4 mice per experiment and three biological replicates. Data are mean ± s.e.m. White and black bar graphs indicate expression from eGFP and eGFP+ phagocytes, respectively. h, i, Microarray validation by duplicate qRT–PCR for indicated genes represent three independent experiments.
Extended Data Figure 7
Extended Data Figure 7. Inflammatory cytokine and co-stimulatory genes in CD11c+ phagocytes are unchanged and decreased at 4 h and 6 h, respectively, following sampling of apoptotic IECs
Signal intensity of genes encoding inflammatory cytokines (a), and co-stimulatory molecules (b), from microarray analyses conducted 4 h after diphtheria toxin administration on the SILP phagocyte populations indicated on the x axes where CD103CD11b and CD11b denote CD103+CD11b+ and CD11b+ macrophages, and CD103 denotes CD103+ dendritic cells. White and black bar graphs indicate expression from eGFP and eGFP+ phagocytes, respectively. No statistically significant changes were observed as genes did not meet statistical significance of at least 1.2 fold (ANOVA (Q < 0.05) and Tukey’s HSD post-hoc test (P <0.05); −1.2> fold >1.2). Data represent five independent experiments with four mice per experiment and three biological replicates. c, d, qRT–PCR quantification of Il1b and Il6 transcripts expressed by eGFP+ and eGFPCD11b+ macrophages (c) and CD103+ dendritic cells (d) from the SILP at 6 h after diphtheria toxin administration. Data represent three independent analytical repeats and one biological replicate consisting of three mice.
Extended Data Figure 8
Extended Data Figure 8. Resident phagocytes in the mesenteric lymph node do not carry eGFP+ apoptotic IEC cargo
a, Duplicate qRT–PCR quantification of Aldh1a2 transcript levels. b, Flow cytometry validation for CD274 protein expression at steady state or at 4 h after diphtheria toxin administration reflecting transcript data shown in Fig. 4a. Data represent at least three independent experiments. c, l, Signal intensity of Ccr7 (c) and Tgfb1 (l) from microarray analyses. Expression of Ccr7 was higher in SILP eGFP+CD103+ dendritic cells but not macrophages, relative to their eGFP counterparts. Although Ccr7 transcripts showed a higher expression trend in CD103+ dendritic cells, relative expression of Ccr7 and Tgfb1 did not meet statistical significance of at least 1.2-fold (ANOVA (Q < 0.05) and Tukey’s HSD post-hoc test (P <0.05); −1.2 >fold > 1.2). Data represent five independent experiments with four mice per experiment and three biological replicates. dg, Flow cytometric analyses of MLN cells from naive, untreated B6 and VDTR mice. d, e, ‘Migratory’ cells were pre-gated on live CD45+MHCIIhiCD11c+ cells. Quantification in right (d) and bottom (e) panels. f, ‘Resident’ cells were pre-gated on live CD45+MHCII+CD11c+ cells and these cells were eGFP. n = 3 mice per experiment, n = 6 mice per group; unpaired two-tailed t-test with Welch’s correction; ***P <0.001. e, g, eGFP and eGFP+ cells from d were further sorted on the basis of CD64, CD24, CD103 and CD11b expression. e, CD24+CD103+ dendritic cells from B6 control mice did not contain the eGFP label. g, The minor populations (~2%) of CD64+CD103+CD11b+ and CD64+CD11b+ macrophages within the migratory gate were also eGFP. Data in e, g, represent three independent experiments. hk, Flow cytometry analyses of migratory eGFP and eGFP+ phagocytes in the MLN over time following a single injection of diphtheria toxin. Increasing the number of apoptotic IECs with diphtheria toxin treatment did not lead to a statistically significant increase in the frequency or absolute number of the indicated macrophage populations (h and i, respectively) or eGFP+CD103+ dendritic cells (j and k, respectively) over time within migratory MLN cells. This was expected given the non-inflammatory nature of the low dose diphtheria toxin and the small number (~0.5–2 ×10⁴) of total CD103+ dendritic cell within the SILP, of which an even smaller fraction (~10%) are eGFP+ (Fig. 2d). Data represent four independent experiments with 4 mice per time point. Data mean ±s.e.m. m, qRT–PCR for Tgfb1 from indicated cell populations. Data represent three independent analytical repeats and one biological replicate consisting of 3 mice. n, Flow cytometry for surface CD40 expression on migratory eGFP+ and eGFP MLN CD103+ dendritic cells from untreated VDTR mice representative of four independent experiments.
Extended Data Figure 9
Extended Data Figure 9. Naive CD4+ T cells co-cultured with eGFP+ or eGFPCD103 dendritic cells from MLN do not differentiate into T-bet+, GATA-3+, or RORγt+ cells
a, b, d, Flow cytometric analyses of VDTR MLN. a, b, Gating strategy for total CD45+CD3+CD4+ T cells. b, T cells pre-gated as in a from non-treated and 3 days post-diphtheria-toxin-treated VDTR mice. Peripherally induced Treg were identified as FOXP3+Helios cells. c, Flow cytometric analyses of splenic CD4+ T cells cultured ex vivo at 1 ×10⁵ after enrichment of naive CD4+ T cells, for 5 days with FACS-sorted 1 ×10⁴ eGFP+ or eGFPCD103+ MLN dendritic cells. Data represent two independent experiments. d, MLN CD4+ T cells from non-treated and day 3 post-diphtheria-toxin-treated VDTR mice. T-bet, GATA-3 and RORγt, characteristic of TH1, TH2 and TH17 cells, respectively, were not present in ex vivo co-cultures (c) or in the MLN of diphtheria-toxin-treated mice (d). At least three independent experiments were performed for flow cytometry studies. Numbers in plots indicate the percentage of positively stained cells within each gate.
Extended Data Figure 10
Extended Data Figure 10. Inflammation does not alter the population of phagocytes that traffics apoptotic IEC cargo to MLN, but does alter its gene expression
B6 and VDTR mice for 5 days received drinking water supplemented with 3% DSS (yellow highlight in b, d). On day 5, DSS treatment was stopped and replaced with fresh drinking water. a, c, Paraffin haematoxylin and eosin sections from the large intestine (a), and small intestine (c) of indicated mice. Scale bars, 100 μm. b, Change in weight shown on the y axis monitored daily as shown on the x axis. DSS treatment of VDTR mice (green line) was accompanied by weight loss similar to that observed in B6 mice (black line), with minimal damage to the terminal ileum, as expected. n = 4 mice per group. d, f, qRT–PCR for indicated transcripts expressed by migratory eGFP+CD103+ MLN dendritic cells from untreated and day 5 DSS-treated VDTR mice (d), and eGFP and eGFP+CD103+ MLN dendritic cell isolated from day 5 DSS treated VDTR mice (f). #, not detected. Data represent three independent analytical repeats and one biological replicate consisting of two mice. e, Flow cytometry analyses of MLN migratory cells from day-5 DSS-treated and non-DSS-treated mice. Data represent two independent experiments consisting of two mice. Numbers near gates indicate the percentage of positively stained cells.
Figure 1
Figure 1. A novel mouse model for inducing apoptosis of IECs under non-inflammatory conditions
a, Immunofluorescence for indicated markers on small intestine cryo-sections. b, qRT–PCR on VDTR ileum represents at least four independent experiments in duplicate. n =4 mice per group. One-way ANOVA; **P <0.01, *P < 0.05. NS, not significant. Data are mean ±s.e.m. c, Immunofluorescence for cleaved caspase 3 (CC3) on small intestine paraffin sections 4 h after administration of 2 or 10 ng g−1 diphtheria toxin (DT). Scale bars, 50 (a) and 100 (c) μm.
Figure 2
Figure 2. A single CD103+ dendritic cell subset and two macrophage subsets sample apoptotic intestinal epithelial cells
a, b, Conventional (without eGFP overlaid) (a) and confocal (b) whole-mount microscopy of VDTR ileum. Scale bars, 100 μm. Arrowheads in a indicate phagocytes near CC3+ IECs. L, lumen. c, Flow cytometry analysis of total (grey) and eGFP+ (green) phagocytes pre-gated on live CD45+MHCIIhiCD11c+ cells. d, Percentage and absolute number of phagocytes from c. e, ImageStream of SILP VDTR cells. Data represent three independent experiments. DIC, differential interference contrast microscopy. f, Flow cytometry analysis of total phagocytes with corresponding eGFP+ cells. Data are mean ±s.e.m., n = 3 B6 mice; n = 6 VDTR mice treated with 2 ng g−1 diphtheria toxin for 1–4 h; n = 9 VDTR mice treated with PBS; one-way ANOVA; *P <0.05; NS, not significant. Data in c, e, and f, represent SILP cells from VDTR mice, at least three independent experiments.
Figure 3
Figure 3. Sampling apoptotic IECs in situ triggers a transcriptional ‘suppression of inflammation’ signature distinct for macrophages (Mϕ) and CD103+ dendritic cells (DC)
a, cg, Hierarchical clustering of differentially expressed genes upregulated by at least 1.2 fold (ANOVA (q < 0.05) and Tukey’s honest significant difference (HSD) post-hoc test (P <0.05); −1.2 >fold-change >1.2); expressed by row Z scale and organized according to Gene Ontology as indicated. b, Venn diagrams of genes in a. Data represent five independent experiments, four mice per experiment, three biological replicates.
Figure 4
Figure 4. Apoptotic cell cargo endow migratory CD103+ dendritic cells with the ability to induce Treg-cell differentiation
a, Hierarchical clustering of differentially expressed genes upregulated in CD103+ dendritic cells as in Fig. 3. b, d–f, Flow cytometry of untreated VDTR MLN phagocytes (b) and splenic CD4+ T cells (df) stained after co-culture with indicated ex vivo dendritic cells (d, e) or MLN CD4+ T cells stained ex vivo (f). Numbers indicate percentage of cells within gates. b, Migratory phagocytes pre-gated on live CD45+MHCIIhiCD11c+ cells. c, qRT–PCR for indicated genes representative of three independent analytical repeats with one biological replicate consisting of two mice. e, Geometric mean of CD25 (right panel) from d. Data represent two independent experiments, 2–3 replicates per condition. f, MLN Treg (pre-gated on CD3+CD4+Helios) cells from VDTR mice untreated (top) and 3 days after 2 ng g−1 diphtheria toxin treatment (bottom). g, Quantification of data from f over time. n = 4 mice per time point; n =5 mice treated with PBS. One-way ANOVA; *P < 0.05. Data are mean ±s.e.m.

Comment in

Similar articles

Cited by

References

    1. Poon IK, Lucas CD, Rossi AG, Ravichandran KS. Apoptotic cell clearance: basic biology and therapeutic potential. Nat Rev Immunol. 2014;14:166–180. - PMC - PubMed
    1. Green DR, Ferguson T, Zitvogel L, Kroemer G. Immunogenic and tolerogenic cell death. Nat Rev Immunol. 2009;9:353–363. - PMC - PubMed
    1. Blander JM. Death in the intestinal epithelium—basic biology and implications for inflammatory bowel disease. FEBS J. 2016;283:2720–2730. - PMC - PubMed
    1. Eisenhoffer GT, et al. Crowding induces live cell extrusion to maintain homeostatic cell numbers in epithelia. Nature. 2012;484:546–549. - PMC - PubMed
    1. Bekiaris V, Persson EK, Agace WW. Intestinal dendritic cells in the regulation of mucosal immunity. Immunol Rev. 2014;260:86–101. - PubMed

Publication types

MeSH terms