Quantitative determination of ribosome nascent chain stability
- PMID: 27821780
- PMCID: PMC5127326
- DOI: 10.1073/pnas.1610272113
Quantitative determination of ribosome nascent chain stability
Abstract
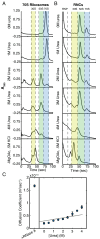
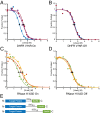
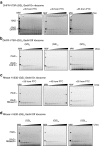
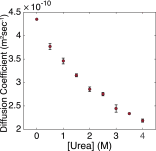
Accurate protein folding is essential for proper cellular and organismal function. In the cell, protein folding is carefully regulated; changes in folding homeostasis (proteostasis) can disrupt many cellular processes and have been implicated in various neurodegenerative diseases and other pathologies. For many proteins, the initial folding process begins during translation while the protein is still tethered to the ribosome; however, most biophysical studies of a protein's energy landscape are carried out in isolation under idealized, dilute conditions and may not accurately report on the energy landscape in vivo. Thus, the energy landscape of ribosome nascent chains and the effect of the tethered ribosome on nascent chain folding remain unclear. Here we have developed a general assay for quantitatively measuring the folding stability of ribosome nascent chains, and find that the ribosome exerts a destabilizing effect on the polypeptide chain. This destabilization decreases as a function of the distance away from the peptidyl transferase center. Thus, the ribosome may add an additional layer of robustness to the protein-folding process by avoiding the formation of stable partially folded states before the protein has completely emerged from the ribosome.
Keywords: cotranslational folding; protein folding; protein stability; pulse proteolysis.
Conflict of interest statement
The authors declare no conflict of interest.
Figures


Similar articles
-
A small single-domain protein folds through the same pathway on and off the ribosome.Proc Natl Acad Sci U S A. 2018 Nov 27;115(48):12206-12211. doi: 10.1073/pnas.1810517115. Epub 2018 Nov 8. Proc Natl Acad Sci U S A. 2018. PMID: 30409803 Free PMC article.
-
Effects of protein size, thermodynamic stability, and net charge on cotranslational folding on the ribosome.Proc Natl Acad Sci U S A. 2018 Oct 2;115(40):E9280-E9287. doi: 10.1073/pnas.1812756115. Epub 2018 Sep 17. Proc Natl Acad Sci U S A. 2018. PMID: 30224455 Free PMC article.
-
A switch from α-helical to β-strand conformation during co-translational protein folding.EMBO J. 2022 Feb 15;41(4):e109175. doi: 10.15252/embj.2021109175. Epub 2022 Jan 7. EMBO J. 2022. PMID: 34994471 Free PMC article.
-
How the ribosome shapes cotranslational protein folding.Curr Opin Struct Biol. 2024 Feb;84:102740. doi: 10.1016/j.sbi.2023.102740. Epub 2023 Dec 9. Curr Opin Struct Biol. 2024. PMID: 38071940 Review.
-
How Does the Ribosome Fold the Proteome?Annu Rev Biochem. 2020 Jun 20;89:389-415. doi: 10.1146/annurev-biochem-062917-012226. Annu Rev Biochem. 2020. PMID: 32569518 Review.
Cited by
-
Folding and Evolution of a Repeat Protein on the Ribosome.Front Mol Biosci. 2022 May 30;9:851038. doi: 10.3389/fmolb.2022.851038. eCollection 2022. Front Mol Biosci. 2022. PMID: 35707224 Free PMC article.
-
Folding up and Moving on-Nascent Protein Folding on the Ribosome.J Mol Biol. 2018 Oct 26;430(22):4580-4591. doi: 10.1016/j.jmb.2018.06.050. Epub 2018 Jul 5. J Mol Biol. 2018. PMID: 29981746 Free PMC article. Review.
-
A small single-domain protein folds through the same pathway on and off the ribosome.Proc Natl Acad Sci U S A. 2018 Nov 27;115(48):12206-12211. doi: 10.1073/pnas.1810517115. Epub 2018 Nov 8. Proc Natl Acad Sci U S A. 2018. PMID: 30409803 Free PMC article.
-
Translation-coupled protein folding assay using a protease to monitor the folding status.Protein Sci. 2019 Jul;28(7):1252-1261. doi: 10.1002/pro.3624. Epub 2019 May 3. Protein Sci. 2019. PMID: 30993770 Free PMC article.
-
Nascent chains derived from a foldable protein sequence interact with specific ribosomal surface sites near the exit tunnel.Sci Rep. 2024 May 29;14(1):12324. doi: 10.1038/s41598-024-61274-1. Sci Rep. 2024. PMID: 38811604 Free PMC article.
References
-
- Dobson CM. Protein folding and misfolding. Nature. 2003;426(6968):884–890. - PubMed
-
- Clark PL. Protein folding in the cell: Reshaping the folding funnel. Trends Biochem Sci. 2004;29(10):527–534. - PubMed
-
- Hartl FU, Hayer-Hartl M. Converging concepts of protein folding in vitro and in vivo. Nat Struct Mol Biol. 2009;16(6):574–581. - PubMed
-
- Cabrita LD, Dobson CM, Christodoulou J. Protein folding on the ribosome. Curr Opin Struct Biol. 2010;20(1):33–45. - PubMed
Publication types
MeSH terms
Substances
Grants and funding
LinkOut - more resources
Full Text Sources
Other Literature Sources

