. 2016 Oct 25:7:13053.
doi: 10.1038/ncomms13053.

Single-cell lineage tracing in the mammary gland reveals stochastic clonal dispersion of stem/progenitor cell progeny

Affiliations

Single-cell lineage tracing in the mammary gland reveals stochastic clonal dispersion of stem/progenitor cell progeny

Felicity M Davis et al. Nat Commun. .

Abstract

The mammary gland undergoes cycles of growth and regeneration throughout reproductive life, a process that requires mammary stem cells (MaSCs). Whilst recent genetic fate-mapping studies using lineage-specific promoters have provided valuable insights into the mammary epithelial hierarchy, the true differentiation potential of adult MaSCs remains unclear. To address this, herein we utilize a stochastic genetic-labelling strategy to indelibly mark a single cell and its progeny in situ, combined with tissue clearing and 3D imaging. Using this approach, clones arising from a single parent cell could be visualized in their entirety. We reveal that clonal progeny contribute exclusively to either luminal or basal lineages and are distributed sporadically to branching ducts or alveoli. Quantitative analyses suggest that pools of unipotent stem/progenitor cells contribute to adult mammary gland development. Our results highlight the utility of tracing a single cell and reveal that progeny of a single proliferative MaSC/progenitor are dispersed throughout the epithelium.


Figures
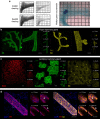
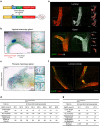
Figure 1
Figure 1. Optical tissue clearing and 3D imaging of the mammary gland.
(a) Transmission images of an entire virgin mammary gland before (left panels) and after (middle panels) tissue clearing using CUBIC or SeeDB, and a CUBIC-cleared mammary gland counterstained with methyl green to visualize the complete ductal network (right panel). Representative images from three mice. Grid width: 2 mm. (b) 3D imaging of K5 and K8 immunostaining of SeeDB-cleared virgin mammary tissue within its native stroma. K5 overview shows 1.18 mm (xy) of mammary gland (z=114 μm imaging stack depth); K8 overview shows 834 μm (xy) (z=114 μm). The depth (z) is relative to the first image in the image sequence, reached after passing through the mammary fat pad (∼350 μm). Scale bars, 50 μm. (c) Immunostaining for SMA (xy=579 μm; z=53 μm), E-cadherin (xy=467 μm; z=36 μm) and K8 (xy=399 μm; z=32 μm) in mammary glands from lactating mice. Scale bars, 50 μm. (d) Immunostaining shows populations of K8hi and K8lo luminal cells, with the K8hi cells costaining with nuclear PR (arrowhead) (representative images from three mice); scale bars, 50 μm.
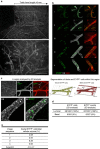
Figure 2
Figure 2. Single-cell lineage tracing in the virgin mammary gland.
(a) Schematic representation of the R26[CA]30 mouse model. (b,c) Examples of two large clonally marked regions (BP.8 and BP.7) in mammary glands from R26[CA]30SYNbglA mice that were likely to have arisen from the labelling of a MaSC/progenitor (based on linear length and number of label-positive branches) (d). Dark purple staining is β-glucosidase+ cells; mammary tissue was counterstained with methyl green. Annotations show the linear length of the clones and their distance from the nipple region (asterisk). Clone BP.7 originated in the nipple region and is likely to have been labelled very early in development. Scale bars, 2 mm (overview) and 0.5 mm (inset). (d) A summary of the eight clonally marked regions likely to have arisen from the labelling of a MaSC/progenitor, observed from the analysis of 30 R26[CA]30SYNbglA mice. (e) Examples of luminal (top panel) and basal (bottom panel) EYFP+ cells from R26[CA]30EYFP mice representing over 25 label-positive regions. Scale bars, 50 μm. (f) A large clonally marked region containing many EYFP+ cells. Labelled progeny spanned multiple ducts and exhibited a sporadic labelling pattern, intermixed with unlabelled cells. Scale bars, 100 μm. (g) A summary of three clonally marked regions presumed to have arisen from the labelling of a MaSC/progenitor, observed from the analysis of 63 R26[CA]30EYFP mice. Lu, luminal; Ba, basal.
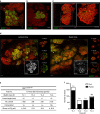
Figure 3
Figure 3. 3D analysis of a clone arising from a single labelled luminal presumptive MaSC.
(a) Wholemount fluorescence images (K8 immunofluorescence) of the mammary ductal network demarcating the linear length of the clone and one region (magnified views, i–v) that was imaged at high cellular resolution by confocal microscopy in b. Further regions from this clone are shown in Supplementary Fig. 9. Asterisk shows the location of the nipple. Scale bar, 1 mm (wholemount) and 50 μm (confocal). (c) Images of a clonally marked region that was analysed by 3D image analysis. Digital segmentation of EYFP+ cells within the luminal (K8-expressing) and basal (SMA-expressing) compartments is shown. Original 3D images show that progeny from a single luminal MaSC/progenitor included both K8hi (arrow) and K8lo (arrowhead) cells. BV, blood vessel. Scale bars, 1 mm (wholemount) and 100 μm (confocal). (d) Tabulated results of 3D and two-dimensional (2D) clonal analyses. For 3D analysis, all segmented ductal EYFP+ cells were classified as luminal based on the proportion of K8 versus SMA signal (n=227 cells from 4 image sequences). For 2D analysis, cells were classified by manual scoring of histological sections (n=281 cells from 10 sections spanning 300 μm depth). This clone (YP.1) is one of three clones likely to have arisen from the labelling of a MaSC (based on linear length and number of label-positive branches), identified from the analysis of over 500 mammary glands from 63 hemizygous R26[CA]30EYFP pubertal mice. (e) Tabulated results of the computed volumetric ratio of EYFP+ cells with respect to cellular volume for each of the four regions analysed.
Figure 4
Figure 4. 3D analysis of a clone arising from a single labelled basal presumptive MaSC.
(a) Wholemount fluorescence images (K8 immunofluorescence) of the mammary ductal network, mapping regions (i–vi) that were imaged using a confocal microscope in b. All EYFP+ cells in this clone (YP.3) were basal. A distinct clone (separated by >1 mm) was identified in this tissue piece and contained only luminal cells (shown in Supplementary Fig. 8). Luminal and basal EYFP+ cells were not imaged in the same branches and clones were never intermixed. Asterisk shows the nipple and origin of the ductal network. Scale bar, 1 mm (wholemount) and 100 μm (confocal, overview) or 30 μm (confocal, magnified view). (c) Tabulated results of the 3D lineage analysis (n=53 cells from 3 image sequences). (d) Tabulated results of the computed volumetric ratio of EYFP+ cells with respect to total basal cellular volume for each of the three regions analysed.
Figure 5
Figure 5. Clonal labelling patterns observed in R26-Confetti;R26-CreERT2 pubertal mice.
(a) Schematic representation of the R26-Confetti;R26-CreERT2 mouse model. (b) Initial labelling level observed 2 days after the administration of a single, low-dose of tamoxifen (1 mg intraperitoneal (i.p.)) to 4-week-old mice. Scale bar, 100 μm. (c) Labelling patterns observed in R26-Confetti;R26-CreERT2 pubertal mice confirm the results from the R26[CA]30 model. Labelling was induced by the administration of a single, low-dose of tamoxifen (1 mg i.p.) to 4-week-old mice and mammary glands were collected after a 3-week chase. Left panel shows a region containing YFP+ luminal cells and RFP+ basal cells (arrowhead) populating three branches, interspersed with unlabelled cells. Right panel shows a region containing GFP+, YFP+ and RFP+ luminal cells in a single branch. Scale bar, 100 μm (overview) and 50 μm (inset). Images are representative of three mice. Additional images are shown in Supplementary Fig. 11.
Figure 6
Figure 6. Contribution of a single MaSC/progenitor to alveologenesis.
(a) An image showing the uneven contribution of a single labelled ductal cell to different lobuloalveolar structures; arrow indicates the presumptive EYFP+ cell of origin at the ductal branch point. Scale bar, 50 μm. (b) A rare instance of progeny from a single luminal EYFP+ cell contributing almost entirely to the luminal lineage of 2–4 alveoli within a single lobule. Scale bar, 50 μm. (c) An example of a single labelled EYFP+ luminal cell that contributed one EYFP+ luminal daughter cell to multiple alveoli in a lobule. Scale bar, 100 μm. (d) 3D images revealing the extensive contribution of a single luminal (left, clone YL.1) and basal (right, clone YL.4) EYFP+ cell to the lobuloalveolar network in independent lactating mammary glands. Labelled alveoli were mostly populated by both lineage-restricted EYFP+ and unlabelled cells (arrow), with occasional alveoli observed that were fully populated by EYFP+ cells of a single lineage (arrowhead). Scale bar, 100 μm (overview) and 40 μm (inset). (e) A summary of the four large clonally marked regions observed from the analysis of 10 R26[CA]30EYFP mice during lactation. (f) The number of alveoli that were fully populated by EYFP+ cells of a single lineage (full) or populated by both EYFP+ and unlabelled cells of a single lineage (partial). Lu, luminal; Ba, basal.
Figure 7
Figure 7. Schematic model.
Schematic model of the most common labelling pattern arising from the genetic labelling of a single lineage-restricted MaSC/progenitor to (a) ductal morphogenesis and (b) alveologenesis, identified in R26[CA]30 mice and confirmed using the R26-Confetti;R26-CreERT2 model (puberty).

Similar articles

Cited by

References

    1. Watson C. J. & Khaled W. T. Mammary development in the embryo and adult: a journey of morphogenesis and commitment. Development 135, 995–1003 (2008). - PubMed
    1. Sreekumar A., Roarty K. & Rosen J. M. The mammary stem cell hierarchy: a looking glass into heterogeneous breast cancer landscapes. Endocr. Relat. Cancer 22, T161–T176 (2015). - PMC - PubMed
    1. Shackleton M. et al. Generation of a functional mammary gland from a single stem cell. Nature 439, 84–88 (2006). - PubMed
    1. Stingl J. et al. Purification and unique properties of mammary epithelial stem cells. Nature 439, 993–997 (2006). - PubMed
    1. Sleeman K. E., Kendrick H., Ashworth A., Isacke C. M. & Smalley M. J. CD24 staining of mouse mammary gland cells defines luminal epithelial, myoepithelial/basal and non-epithelial cells. Breast Cancer Res. 8, R7 (2006). - PMC - PubMed

Publication types

MeSH terms