. 2016 Dec 1;540(7631):74-79.
doi: 10.1038/nature20156. Epub 2016 Oct 24.

Correcting mitochondrial fusion by manipulating mitofusin conformations

Affiliations

Correcting mitochondrial fusion by manipulating mitofusin conformations

Antonietta Franco et al. Nature. .

Abstract

Mitochondria are dynamic organelles that exchange contents and undergo remodelling during cyclic fusion and fission. Genetic mutations in MFN2 (the gene encoding mitofusin 2) interrupt mitochondrial fusion and cause the untreatable neurodegenerative condition Charcot-Marie-Tooth disease type 2A (CMT2A). It has not yet been possible to directly modulate mitochondrial fusion, in part because the structural basis of mitofusin function is not completely understood. Here we show that mitofusins adopt either a fusion-constrained or a fusion-permissive molecular conformation, directed by specific intramolecular binding interactions, and demonstrate that mitofusin-dependent mitochondrial fusion can be regulated in mouse cells by targeting these conformational transitions. On the basis of this model, we engineered a cell-permeant minipeptide to destabilize the fusion-constrained conformation of mitofusin and promote the fusion-permissive conformation, reversing mitochondrial abnormalities in cultured fibroblasts and neurons that harbour CMT2A-associated genetic defects. The relationship between the conformational plasticity of mitofusin 2 and mitochondrial dynamism reveals a central mechanism that regulates mitochondrial fusion, the manipulation of which can correct mitochondrial pathology triggered by defective or imbalanced mitochondrial dynamics.


Figures
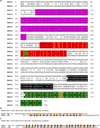
Extended Data Figure 1
Extended Data Figure 1. Interacting domains in human mitofusins
a. Amino acid alignment of human Mfn1 and Mfn2. Conservative amino acid substitutions are indicated by +. Mfn domains are color-coded as in Fig 1a: purple is GTPase, red is HR1, black is TM, green is HR2. Yellow amino acids in HR1 and red amino acids in HR2 are residues central to inter- or intra-molecular binding. Areas where local unfolding of HR1 and HR2 α-helices occurs are highlighted yellow-green. b. Antiparallel inter-molecular Mfn2 HR2-HR2 binding as predicted from reference . c. Intra-molecular Mfn2 HR1-HR2 binding as depicted in Figure 1c and Supplemental video 2.
Extended Data Figure 2
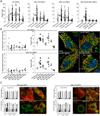
Extended Data Figure 2. Adenovirally-expressed Gly-substituted mini-peptides derived from Mfn2 HR1 specifically regulate Mfn-mediated mitochondrial fusion
a. Changes in mitochondrial aspect ratio provoked by adeno-367-384Gly and adeno-398-418Gly in MEFs having different Mfn expression profiles, compared to adeno-WT Mfn2 and adeno-(Mfn2) HR1. Each point is the aspect ratio of an individual mitochondrion; Group data are meanαSEM; *=P<0.05 vs adeno-null (ANOVA). Exact numbers of mitochondria measured from 4 or 5 separate experiments per condition are shown on the figure. b. Mitochondrial polarization status and aspect ratio in WT and Mfn2 KO MEFs expressing WT Mfn2 or fragments thereof. Each point is the mean of ~20 mitochondria from ~5 cells in the number of independent experiments indicated on the graph. Group data are meanαSEM; *=P<0.05 vs ad-null Ctrl (ANOVA). Representative (of 15–40 images/group) merged confocal images of WT MEFs infected with ad-Mfn2 or the two biologically active Ad-peptides are to the right; scale bar is 10 microns. c. MitoTracker Green and m-cherry Parkin (top) or Lyso-Red (bottom) co-stained WT or Mfn2 KO MEFs before (left) or 1 hour after (right) treatment with 50 nM FCCP. Group data are meanαSEM; there were no differences between groups (ANOVA; n=3 independent experiments per condition). Scale bars are 10 µm.
Extended Data Figure 3
Extended Data Figure 3. Effects of TAT-conjugated mini-peptides on MEFs
a. Merged confocal images (representative of 30) of mitochondria in MEFs 2 hours after application of TAT-367-384Gly (top) or TAT-398-418Gly (bottom). Complete dose-response relationship is in Figure 2d. b. Immunoblot analysis of mitochondrial dynamics proteins 4 hours after application of TAT-367-384 Gly or TAT-398-418 Gly. Opa1 is the inner mitochondrial membrane fusion protein Optic atrophy 1; Drp1 is the fission protein Dynamin related protein 1. Opa1 immunoblot was co-probed for Mfn2. c. Immunoblot quantitation. MeanαSEM; N=4 for Mfn2;, n=2 for all other proteins. Un-cropped original blots are in supplementary information Figure 1.
Extended Data Figure 4
Extended Data Figure 4. Mfn2 HR1-derived TAT-mini-peptides do not suppress GTPase activity, impair mitochondrial polarization, or increase cell death
a. Relative GTPase activity of recombinant Mfn2 is shown with respect to a no-Peptide control. Background signal from no GTP blank was subtracted from each value prior to normalization. Mean αSD of 3 independent experiments. b and c. Mitochondrial depolarization was assessed as loss of TMRE staining (b) and cell death was assessed as ethidium bromide uptake (c) in WT MEFs cultured in 4500 mg/L glucose (left) or galactose (right) treated with or without 1 µM TAT-mini-peptide for 24h. N=3 or 4 independent experiments per condition. All group data in panels a-c are mean α SEM. There were no significant differences between TAT-mini-peptide treatment groups (ANOVA).
Extended Data Figure 5
Extended Data Figure 5. TAT-367-384Gly rescues mitochondrial dysmorphology in a cell model of autosomal recessive CMT2A. (left)
Representative (of 15–20/group) confocal micrographs of MitoTracker green/Hoechst stained Mfn2 KO MEFs at baseline or 24h after application of mini-peptide; a representative normal MEF is shown for comparison. Mean normal MEF mitochondrial aspect ratio is 6.2. Group data are meanαSEM; * is P<0.05 vs control (ANOVA), n=3 or 4 per group. Scale bar is 10 microns.
Extended Data Figure 6
Extended Data Figure 6. Minipeptide effects on dysfunctional Mfn2 mutants
WT Mfn2 or the indicated mutants were expressed for 48 h using adenoviri (ad) in Mfn null MEFs (Mfn1/Mfn2 DKO). TAT minipeptides or vehicle (sterile water) were added and mitochondrial morphometry assessed 24 hours later. Images (representative of 15/group) are merged MitoTracker Green (green) and TMRE (red). Scale bars are 10 µm. Quantitative data for aspect ratio is shown below (n=3/condition). Group data are meanαSEM; *=P<0.05 vs same-group Ctrl (ANOVA).
Extended Data Figure 7
Extended Data Figure 7. WT Mfn2 expression to parallel Mfn2 T105M expression studies
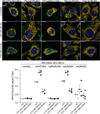
a. Immunoblot analysis of mitochondrial dynamics proteins in cultured MEFs transduced with ad-βgal (viral control) or Ad-Mfn2 (adenoviral wild-type human Mfn2). Mfn2 expression increased 5-fold over uninfected Ctrl; apparent increased Mfn1 signal is cross immunoreactivity with Mfn2 as shown by slightly faster migration. b. Merged confocal images (MitoTracker Green and TMRE; representative of 15/group) of MEFs expressing WT Mfn2 and treated with TAT-minipeptides as shown. Quantitative data (n=3 independent experiments) are on the right. Group data are meanαSEM; * = P<0.05 vs Ctrl by one-way ANOVA. Scale bars are 10 µm. c. Immunoblot quantifications for panel a. d. Immunoblot quantifications for Figure 4b, for comparison. N=4 for Mfn2; n=2 for all other proteins. Y axis scales are identical except Mfn2 in (panel c), which is expanded to accommodate high (5× normal) ad-WT Mfn2 expression level.
Extended Data Figure 8
Extended Data Figure 8. TAT-367-384Gly corrects mitochondrial fragmentation provoked by Mfn2 K109A in cultured rat motor neurons
Representative (of > 20/group) anti-TOM20/Hoechst images of formalin-fixed cultured neurons infected with adeno-Mfn2K109A (top) or adeno-WT Mfn2 (bottom) and treated for 24 h with 1 µM TAT control (Ctrl) or TAT-367-384Gly minipeptide. Scale bars are 10 microns. Experimental n per treatment group is shown on the graph. Data are meanαSEM;*=P<0.05 vs Ctrl (Student’s t-test).
Extended Data Figure 9
Extended Data Figure 9. TAT-367-384Gly reverses mitochondrial pathology in cultured Mfn2 K109A mouse neurons
Live-cell confocal imaging of MitoGFP (green)/ TMRE (red)/ Hoechst (blue nuclei) stained mouse hippocampal neurons (representative of >30 images/group). Normal control neurons from nontransgenic (NTG) mouse pups are on top; Mfn2 T105M fl/st transgenic mouse neurons are on bottom. Adeno-MitoGFP was added at low titers to enhance visualization of individual neurons. Note mitochondrial fragmentation and clumping after adeno-Cre induced induction of Mfn2 T105M, and reversal after 24h of TAT-367-384Gly treatment. Scale bars are 20 microns.
Figure 1
Figure 1. Intramolecular interactions between Mfn2 HR1 and HR2 modulate mitochondrial fusion
a. Domain model of Mfn structure. GTPase is purple, HR1 is red, transmembrane (TM) domain is black, HR2 is green. Amino acid numbers are for human Mfn1 and Mfn2. b. Mfn-Mfn interacting in trans to produce mitochondrial tethering that precedes outer membrane fusion. c. Intra-molecular hMfn2 HR1 (red) - HR2 (green) interactions based on crystal structures of bacterial DLP. d. Homology model of hMfn2 showing putative constrained/inactive (left) and extended/active (right) conformations. e. Confocal images of MEFs expressing β-gal (Ctrl), hMfn2 HR1 fragment or fully functional wild-type (WT) hMfn2. MitoTracker Green (MitoGrn) stains mitochondria, blue Hoechst stains nuclei. Quantitative results are to the right. Group data are mean±SEM; *=P<0.05 vs Ctrl (ANOVA) in 4 independent experiments for each condition. Scale bars are 10 microns.
Figure 2
Figure 2. Adenovirally-expressed Gly-substituted minipeptides derived from Mfn2 HR1 regulate Mfn-mediated mitochondrial fusion
a. Derivation of HR1 minipeptides and their predicted binding to HR2. Red shows critical Gly substitution. b. Ribbon representations showing (top) TAT-367-384Gly (blue) interrupting intra-molecular HR1-HR2 binding, and (bottom) TAT-398-418Gly (yellow) interrupting the inter-molecular HR2-HR2 interaction essential to mitochondrial tethering. c. Mitochondrial content exchange (red-green overlay) 6h after PEG-mediated cell fusion. Scale bar is 20 µm. N=3 experiments measuring ~50 cells each; *=P<0.01 vs +PEG (ANOVA and Tukey’s test). d. TAT minipeptide dose-response at 4 hours (left, n=6 or 7) and time-course of 1 µM effects (right, n=3). Group data are mean±SEM.
Figure 3
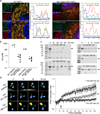
Figure 3. Molecular effects of HR1-derived TAT-minipeptides on Mfn2
a. Confocal localization of FITC-labeled TAT-minipeptides (green) in WT MEFs (left) and Mfn null MEFs (Mfn1/Mfn2 DKO; right). Red mitochondria were stained with MitoTracker Orange; blue is nucleus (Hoechst). Line-scans are to the right of their respective images. Representative of >20 images/group. Scale bars are 5 microns. b. Peptide binding to Mfn2. Group data are mean±SEM; n = 3 studies for baseline and 6 or 7 studies for cooperativity. * = P<0.05 vs same peptide alone (t-test). c. Carboxypeptidase protection assays. Anti-Mfn2 recognizes HR2 (hMfn2 amino acids 661-758). Arrows show Mfn2; gel source data are in Extended Data Figure. 1. d. Mfn2 live cell FRET studies. Representative images are on the left; quantitative data (mean±SEM, n=10) are to the right. Arrow indicates time of TAT-peptide addition.
Figure 4
Figure 4. TAT-367-384Gly normalizes mitochondrial dysmorphology induced by the CMT2A mutant Mfn2 T105M
a. (top) Schematic representation of the conditional T105M transgene construct. (bottom) Time course of mitochondrial fragmentation after adeno-Cre mediated induction of Mfn2 T105M. Group data are mean±SEM, N=3; *=P<0.05 vs 24h same treatment group (ANOVA). b. Immunoblot analysis of mitochondrial dynamics factors in Mfn2 T105M MEFs treated as indicated above; gel source data are in Extended Data Figure. 1 and quantitation is in Extended Data Figure 8d. c. Confocal micrographs (representative of >15/group) showing mitochondrial fragmentation evoked by Mfn2 T105M, its normalization 24h after application of 1 µM TAT-367-384Gly, and its exaggeration 24h after 1 µM TAT-367-384Gly. Experimental design is depicted above. Scale bars are 10 microns. On the right are group data; N=3 or 4. Group data are mean±SEM; *=P<0.05 vs Ctrl, #=P<0.05 vs Ad-Cre (ANOVA).
Figure 5
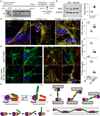
Figure 5. TAT-367-384Gly corrects mitochondrial pathology in CMT2A Mfn2 T105M mouse neurons
a. Experimental design. Inset shows PCR genotyping of a Mfn2 T105M fl/st transgene (arrow) mouse litter whose pups were used for neuron harvesting and culture. b. Immunoblot of Mfn2 expression in T105M fl/st cortical neurons 72h after adeno-Cre or adeno-β-gal (Ctrl) (quantitative data to the right are n=4); gel source data are in Extended Data Figure. 1. c. Merged live confocal images of cultured neurons without (no Cre) and with (+ Cre) Mfn2 T105M induction, and in Mfn2 T105M-induced neurons 24h after addition of 1 µM TAT-367-384Gly. Scale bars are 10 microns. d. Mfn2 T105M expressing neurons without (top) and with (bottom) 24h treatment with 1 µM TAT-367-384Gly. Scale bars are 40 microns in low power images and 10 microns in high power images. Quantitative data are to the right; each point is result from one of 3 independently-established Mfn2 T105M neuronal cultures, each with 3 biological replicates of ~20 neurons. Group data are mean±SEM; * = P<0.01 vs no Cre; # = P<0.01 vs T105M+Cre. e. (left) Schematic depiction of the folded/HR2-constrained (left) and unfolded/HR2-extended (right) mitofusin conformations; HR2 unfolding is below. (right) HR2 flexing at Gly 623/642 after trans-association of HR2 domains; molecular patch formed between mitochondria by coincident GTP-dependent/GTPase domain-mediated cis Mfn2 dimerization is below.

Similar articles

Cited by

References

    1. Chan DC. Fusion and fission: interlinked processes critical for mitochondrial health. Annu Rev Genet. 2012;46:265–287. - PubMed
    1. Chen H, et al. Mitofusins Mfn1 and Mfn2 coordinately regulate mitochondrial fusion and are essential for embryonic development. J Cell Biol. 2003;160:189–200. - PMC - PubMed
    1. Kasahara A, Cipolat S, Chen Y, Dorn GW, 2nd, Scorrano L. Mitochondrial fusion directs cardiomyocyte differentiation via calcineurin and Notch signaling. Science. 2013;342:734–737. - PubMed
    1. Chen H, McCaffery JM, Chan DC. Mitochondrial fusion protects against neurodegeneration in the cerebellum. Cell. 2007;130:548–562. - PubMed
    1. Chen H, et al. Mitochondrial fusion is required for mtDNA stability in skeletal muscle and tolerance of mtDNA mutations. Cell. 2010;141:280–289. - PMC - PubMed

Publication types

MeSH terms

Supplementary concepts