

Genome evolution in the allotetraploid frog Xenopus laevis
- PMID: 27762356
- PMCID: PMC5313049
- DOI: 10.1038/nature19840
Genome evolution in the allotetraploid frog Xenopus laevis
Abstract
To explore the origins and consequences of tetraploidy in the African clawed frog, we sequenced the Xenopus laevis genome and compared it to the related diploid X. tropicalis genome. We characterize the allotetraploid origin of X. laevis by partitioning its genome into two homoeologous subgenomes, marked by distinct families of 'fossil' transposable elements. On the basis of the activity of these elements and the age of hundreds of unitary pseudogenes, we estimate that the two diploid progenitor species diverged around 34 million years ago (Ma) and combined to form an allotetraploid around 17-18 Ma. More than 56% of all genes were retained in two homoeologous copies. Protein function, gene expression, and the amount of conserved flanking sequence all correlate with retention rates. The subgenomes have evolved asymmetrically, with one chromosome set more often preserving the ancestral state and the other experiencing more gene loss, deletion, rearrangement, and reduced gene expression.
Figures
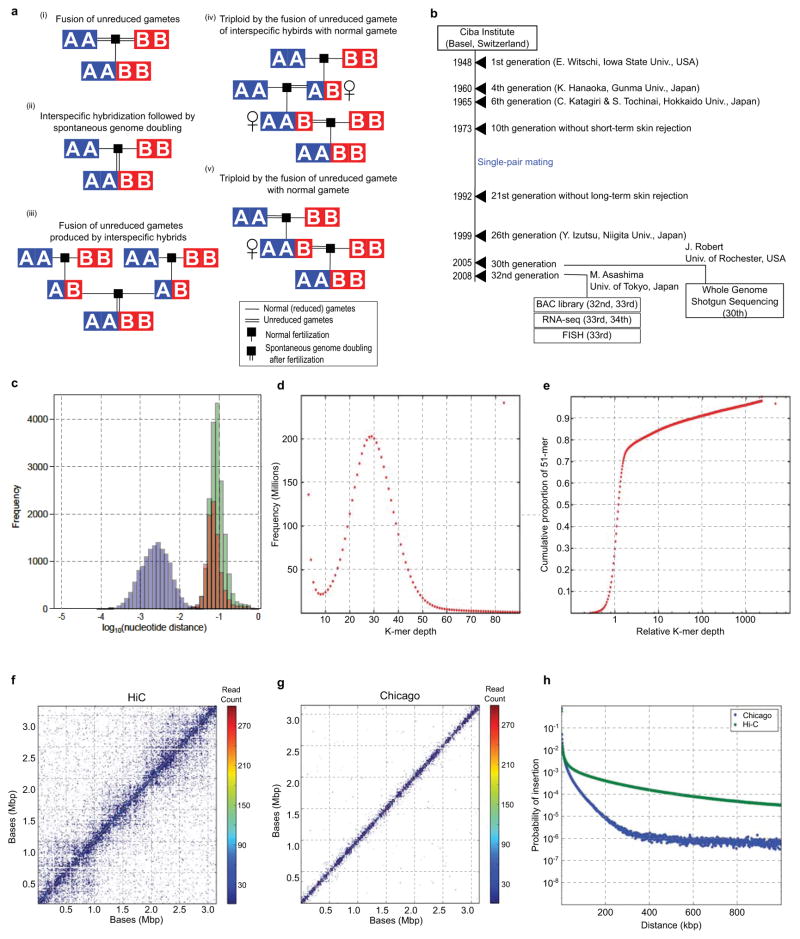
(i) Fusion of unreduced gametes from species A and B. (ii) Interspecific hybridization followed by spontaneous doubling. (iii) Fusion of unreduced gametes produced by interspecific hybrids. (iv) Interspecific hybrids produce unreduced gametes, which fuse with normal gametes from species A. The resulting triploid again produces unreduced gametes, which fuse with normal gametes from species B (v) Unreduced gamete from species A fuses with normal gamete from species B. The resulting AAB triploid produces unreduced gametes that are fertilized by normal gametes species B. See Supplemental Note 1.1 for a more detailed discussion.
History of the J strain. See Supplementary Note 2.1 for details. The years of events and generation numbers (e.g., frog transfer to another institute, establishment of homozygosity, construction of materials) are indicated in the scheme. Generation numbers are estimates due to loss of old breeding records.
The nucleotide distance of orthologs (green), homeologs (red), and alleles (blue) is discussed in Supplemental Note 8.7. The distances are shown on a log scale to differentiate between the distributions.
51-mer frequency histogram showing the number of 51-mers with specified count in the shotgun dataset. The prominent peak implies that each genomic locus is sampled 29x in 51-mers. Note the absence of a feature at twice this depth, indicating that homeologous features with high identity are rare.
Cumulative proportion of 51-mers as a function of relative depth (i.e., depth/29). Relative depth provides an estimate of genomic copy number. The rapid rise at relative depth 1 implies that 70–75% the X. laevis genome is single copy with respect to 51-mers. The remainder of the genome is primarily concentrated in repetitive sequences with copy number ≫100. Note logarithmic scale.
The contact map of 85,260 Chicago read pairs for JGIv72.000090484.chr4S, a 3.1Mb scaffold in the XENLA_JGI_v72 assembly.
The contact map of 85,260 HiC read pairs for JGIv72.000090484.chr4S. Read pairs were binned at 10kb intervals. For each read pair, the forward and reverse reads map with at least 20 map quality score.
The insert distribution of HiC and Chicago read pairs that map to the same scaffold of XENLA_JGI_v72 with at least 20 map quality score. The x-axis is the read pair separation distance. The y-axis is the counts for that bin divided by the total number of reads. The bins are 1kb.
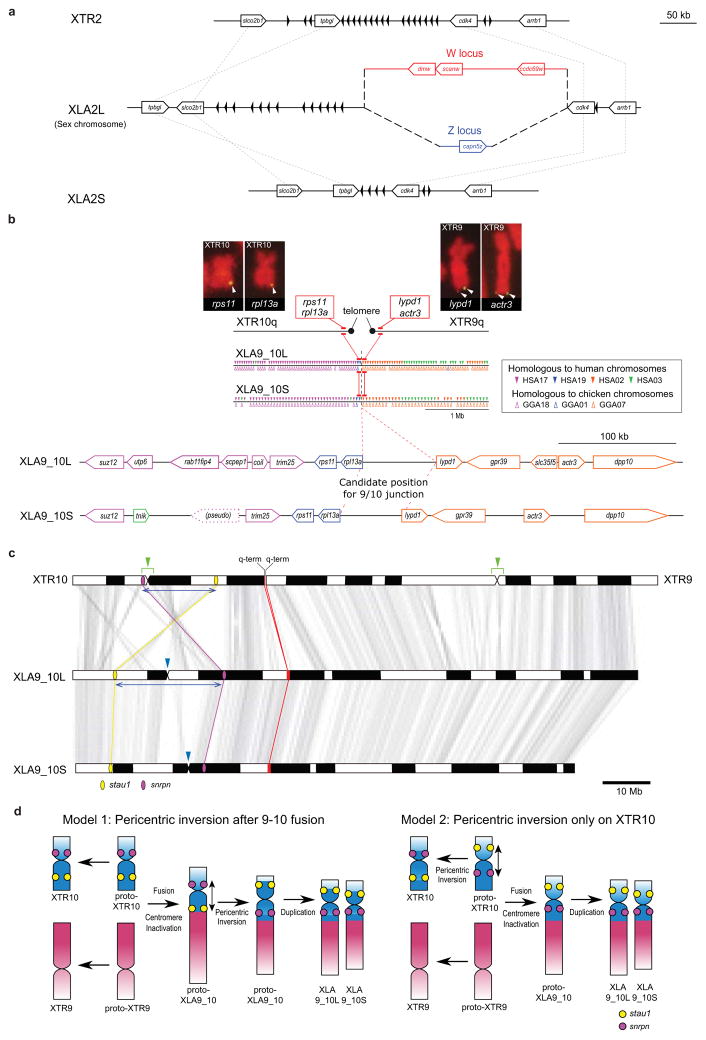
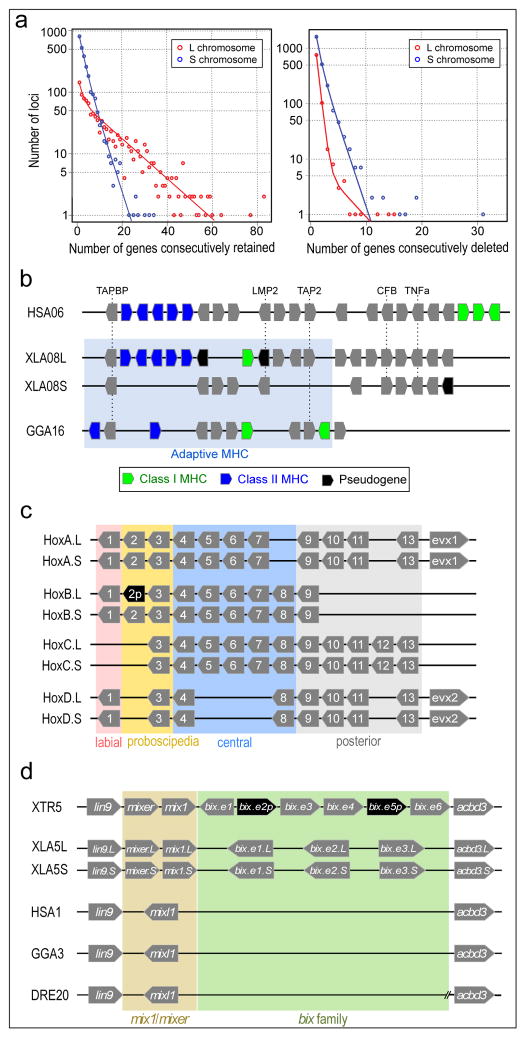
Structure of the sex chromosome of X. laevis (XLA2L) and comparison with XLA2S and XTR2. The W version of XLA2L harbors W-specific sequence containing the female sex-determining gene, dmw (red), while Z has a different Z-specific sequence (blue). Pentagon arrows and black triangles indicate genes and olfactory receptor genes, respectively. Their tips correspond to their 3’-ends.
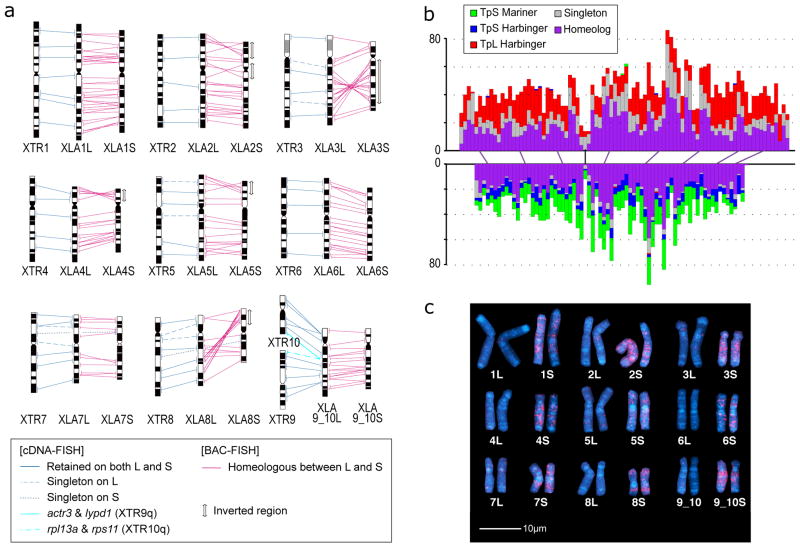
Alignment of the q-terminal regions of XTR9 and 10 with corresponding regions of XLA9_10L and XLA9_10S. Genes near the q terminal regions of XTR 9 and XTR10 were missing in the X. tropicalis genome assembly v9, but rps11, rpl13a, lypd1, and actr3 were expected to be located there based on the synteny with human chromosomes, and then verified by cDNA FISH (upper panels). Small triangles on XLA9_10L and S indicate the distribution of gene models showing both identity and coverage greater than 30%, against the human and chicken peptide sequences from Ensembl, in the region between ±2 Mb from the prospective 9/10 junction. HSA: human chromosome. GGA: chicken chromosome. The magnified view represents syntenic genes to scale with colors corresponding to human genes.
The orders of orthologous genes across XTR9, XTR10, XLA9_10L and XLA9_10S. Green arrowheads: positions of centromeres in XTR9 and 10 predicted by examination of the cytogenetic chromosome length ratio of p versus q arms. Blue arrowheads: positions of centromere repeats, frog centromeric repeat-162, in XLA9_10L and S. Magenta and yellow ellipses: chromosomal locations of snrpn (magenta) and stau1 (yellow) from X. tropicalis v9 and X. laevis v9.1 assemblies. Red ellipses: chromosomal locations of four genes, rps11, rpl13a, lypd1, and actr3. XTR9 is flipped to facilitate comparison. Blue bidirectional arrows indicate the homologous regions where pericentric inversions may have occurred on proto-chromosomes (see Extended Data Fig. 2d).
Schematic representation for the two hypothetical processes of chromosomal rearrangements (fusion and inversion) that occurred between the hypothetical proto-XTR9 and 10 to produce proto-XLA9_10, and eventually XLA9_10L and S. The process of chromosome rearrangements is explained parsimoniously in two different ways (left and right panels), starting from proto-XTR9 and 10. Actual and hypothetical ancestral chromosomal locations of snrpn and stau1 are shown by magenta and yellow circles, respectively. Note that the chromosomal locations of these genes on the proto-XTR10 differ between the two models. Chromosome segments homologous to XTR9 and XTR10 are shown in red and blue, respectively. XTR9 is inverted to facilitate comparison. Bidirectional arrows indicate the regions where pericentric inversions may have occurred. Black arrows indicate the direction of chromosomal evolution.
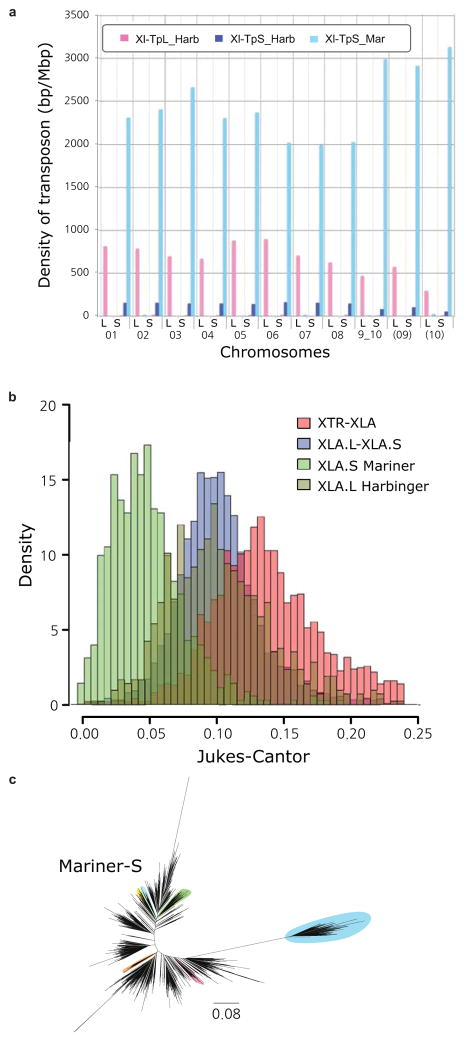
Density of the subgenome specific transposons on each chromosome (coverage length of transposable element [bp]/chromosome length [Mbp]). The coverage lengths of transposons were calculated from the results of BLASTN search (E-value cutoff 1E-5) using the consensus sequences as queries.
Jukes-Cantor distances across non-CpG sites, corrected as in Supplemental Note 7.5. Distances between X. tropicalis and X. laevis transposons consensus sequences are shown. The X. laevis-specific transposon differences are each individual transposon sequence against the consensus sequence for that subfamily.
Phylogenetic tree of Xl-TpS_Mar transposon expansions in the X. laevis genome, built using Jukes-Cantor corrected distances (Supplemental Note 7.5). Sub-clusters with enough members to determine accurate timings are highlighted. The scale bar represents the corrected Jukes-Cantor distance.
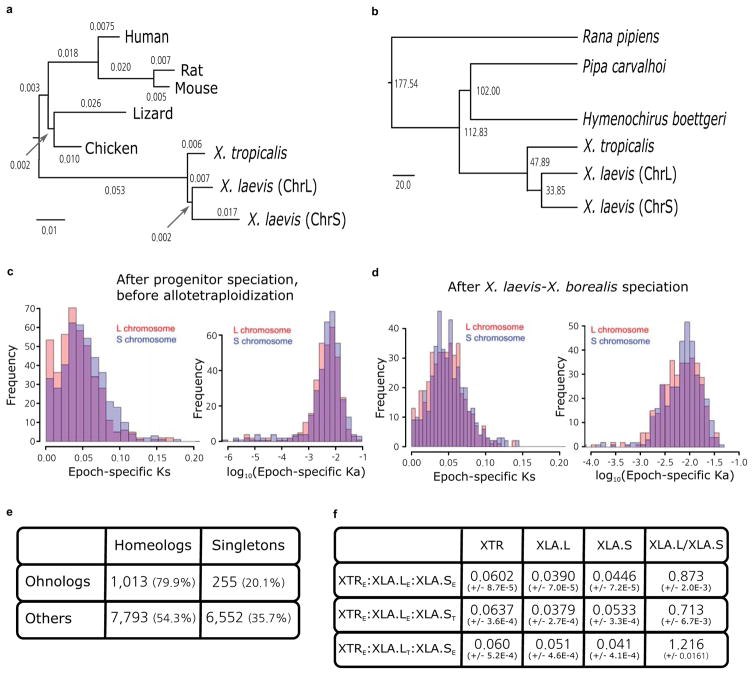
Phylogenetic tree of pan-vertebrate conserved non-coding elements (pvCNEs), rooted by elephant shark. Alignments were done by MUSCLE, and the maximum-likelihood tree was built by PhyML. Branch length scale shown on bottom. The difference in branch lengths of tetrapods follows the same topology as the protein-coding tree (Fig. 2b).
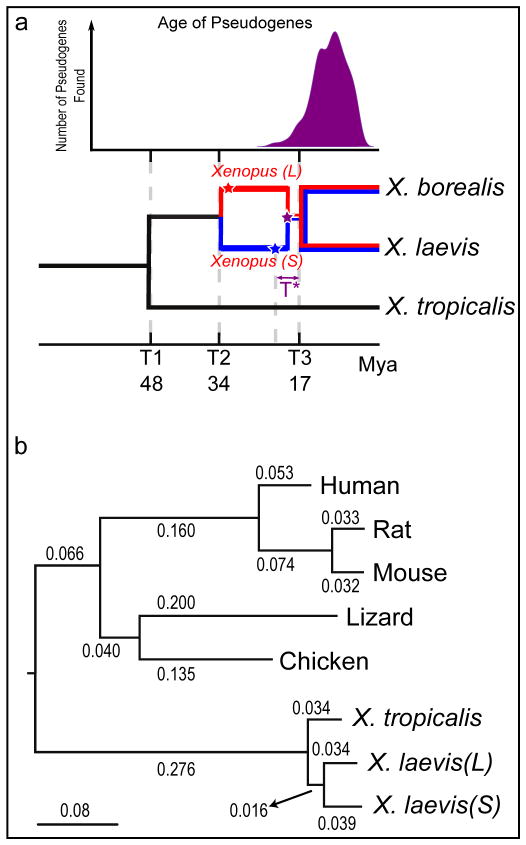
Complete phylogenetic tree from Fig. 2a, with divergence times computed by r8s.
Distribution of Ks and Ka on specific subgenomes during the time between L and S speciation, before X. laevis and X. borealis speciation. We find accelerated mutations rates between T2 and T3 in Ks and Ka (p=1.4e-5 (left), 8.6e-3 (right)).
Distribution of Ks and Ka on specific subgenomes during the time after laevis and borealis speciation. We do not find significantly accelerated substitution rates. (p= 0.10 (left) and 0.03 (right)).
Table showing the number of homeologs and singletons identified as homeologs from the ancient vertebrate duplication (or ohnologs as they are historically called)63. 79.9% of ohnologs retain both copies in X. laevis today, significantly more than the 54.3% of the rest of the genome after excluding ohnologs (χ2 test p-value= 4.44E-69).
Table showing the branch lengths of bootstrapped maximum likelihood trees described in Supplemental Note 12.5. The columns refer to the X. tropicalis (XTR), L chromosome of X. laevis (XLA.L), S chromosome of X. laevis (XLA.S), and XLA.L/XLA.S branch lengths respectively. The first row is triplets where all genes show expression, the second row is triplets where L is a thanagene, and the third row is triplets where S is a thanagene. The L branch length is significantly smaller when all genes are expressed, or when S is a thanagene (Wilcoxon p-value=1.7E-216 and 6.4E-212 respectively). The S branch length is smaller when L is a thanagene (p=2.4E-223). The ratio of branch lengths (L/S) is significantly different for either L or S thanagene datasets compared to when all genes are expressed (p=3.55E-214 and 7.48E-220 respectively). The ratio is different between the two thanagene datasets as well (p=1.79E-217).
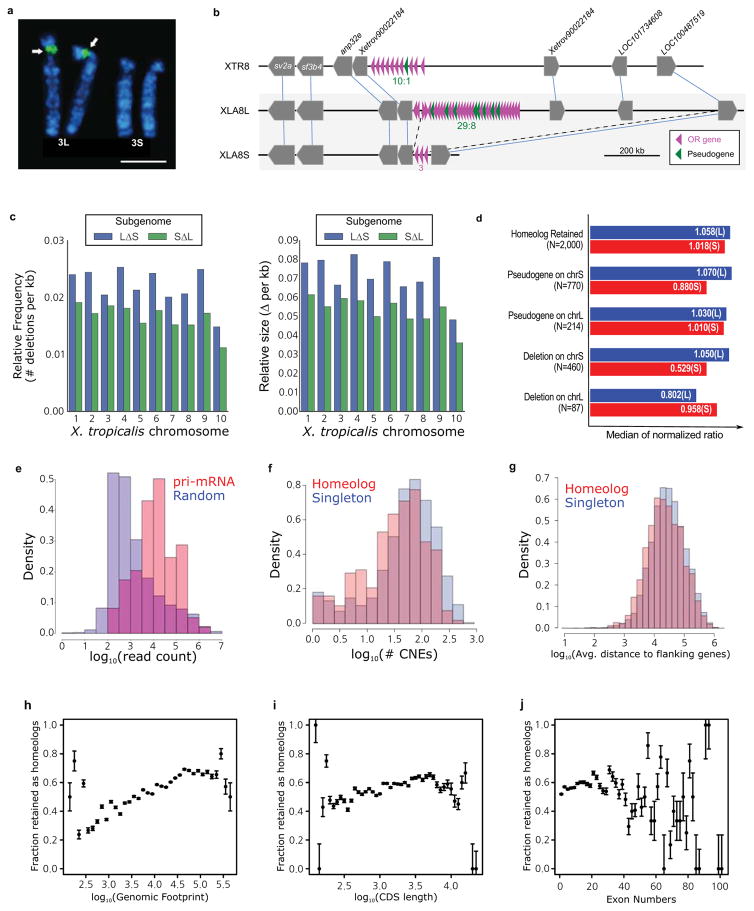
Chromosomal locations of the 45S pre-ribosomal RNA gene (rna45s), which encodes a precursor RNA for 18S, 5.8S, and 28S rRNAs, was determined using pHr21Ab (5.8-kb for the 5′ portion) and pHr14E3 (7.3-kb for the 3′ portion) fragments as FISH probes. DNA fragments used for the probes were provided by National Institutes of Biomedical Innovation, Health and Nutrition, Osaka, and labeled with biotin-16-dUTP (Roche Diagnostics) by nick translation. After hybridization, the slides were incubated with FITC-avidin (Vector Laboratories). Hybridization signals (arrows) were detected to the short arm of XLA3L, but not XLA3S. Scale bar represents 5 μm.
A large deletion including an olfactory receptor gene (or) cluster. Schematic structures of or gene clusters and adjacent genes on the 8th chromosomes of X. tropicalis (XTR8) and X. laevis (XLA8L and XLA8S). Chromosomal locations: XTR8:107,524,547-108,927,581; XLA8L:105,062,063–106,610,199; XLA8S:91,630,596–92,060,451. Horizontal bars, genomic DNA sequences; triangles, genes. Outside of or gene cluster, only representative genes are shown. The length of triangle is to scale. The orientation of triangles indicates 5′ to 3′ direction of genes. Thin lines connect orthologous/homeologous genes. Magenta triangles, or genes; green triangles, pseudogenes (point-mutated or truncated or genes). The number of or genes is shown underneath gene clusters. Dotted lines, a deleted region in XLA8S in comparison with XLA8L. The centromere is located on the left side and the telomere is on the right.
The relative frequency (left panel) and size (right panel) of genomic regions deleted in the S (blue) and L (green) chromosomes respectively. Both subgenomes experienced sequence loss through deletions, however, the deletions on the S subgenome are larger and have been more frequent. Deletions were called based on the progressive Cactus sequence alignment between the X.laevis L and S subgenomes and the X. tropicalis genome. Chromosome 9_10 of laevis was split into 9 and 10 on basis of alignment with the X. tropicalis chromosomes. Sequences from L that were not present on S, but could at least partially be identified in X. tropicalis, and consisted of gaps for no more than 25% of their length were called as deleted regions in S. The same procedure was followed for deleted regions in L.
Identification of triplet loci is described in Supplemental Note 8.1. Loci were classified into groups based on the presence of gene 2 in both X. laevis subgenomes (homeolog retained), versus those that had a pseudogene in the middle (pseudogene) or no remnant of the middle gene as assessed by Exonerate (deletion). To normalize the intergenic lengths we divided the nucleotide distance between genes 1 and 3 in either X. laevis subgenome by the orthologous distance in X. tropicalis. The median of the normalized ratio distribution is plotted on the bar chart. On average S deletions appear to be larger than L deletions (52.9% length vs 80.2% the size of the orthologous X. tropicalis region respectively).
The number of RNA-seq reads aligning +/− 1kb of precursor miRNA loci (red) was compared to the read count for 10,000 random unannotated 2.1 kb regions of the genome (blue). All 83 homeologous, intergenic miRNA pairs showed alignment within their regions, as opposed to 4,127/10,000 (41.27%) of the randomly chosen intergenic sequences. The putative primary-miRNA loci have a higher read count than the expressed randomly chosen regions as well (Wilcoxon p=1.4E-38).
The CACTUS alignment was parsed to identify flanking CNE around each X. tropicalis gene. The number of CNEs > 50bp in length for singletons is shown in red, homeologs in blue. Komologrov-Smirnov test p-value is 1E-11.
The average distance to the nearest gene was computed for each chromosomal locus in X. tropicalis. The average intergenic distance for those with a single X. laevis gene is shown in red, those with two shown in blue. Wilcoxon p-value= 9.8E-24.
The distribution of gene retention by genomic footprint of the X. tropicalis ortholog. We define genomic footprint as the genomic distance from the start signal of the CDS to the stop signal, including introns. The x axis shows log10(genomic footprint), the y-axis is the retention rate of each bin. The error bars are the standard deviation of the total divided by the number of genes in each bin. We tested for significant differences in length between homeologs and singletons by a Wilcoxon test (p-value = 2.4E-96).
The distribution of gene retention by CDS length of the X. tropicalis ortholog. The x axis shows log10(CDS length), the y-axis is the retention rate of each bin. The error bars are the standard deviation of the total divided by the number of genes in each bin. We tested for significant differences in length between homeologs and singletons by a Wilcoxon test (p-value= 1.7E-21).
The distribution of gene retention by exon number of the X. tropicalis ortholog. The x axis shows number of exons; the y-axis is the retention rate of each bin. The error bars are the standard deviation of the total divided by the number of genes in each bin. We tested for significant differences in length between homeologs and singletons by a Wilcoxon test (p-value= 3.2E-8).
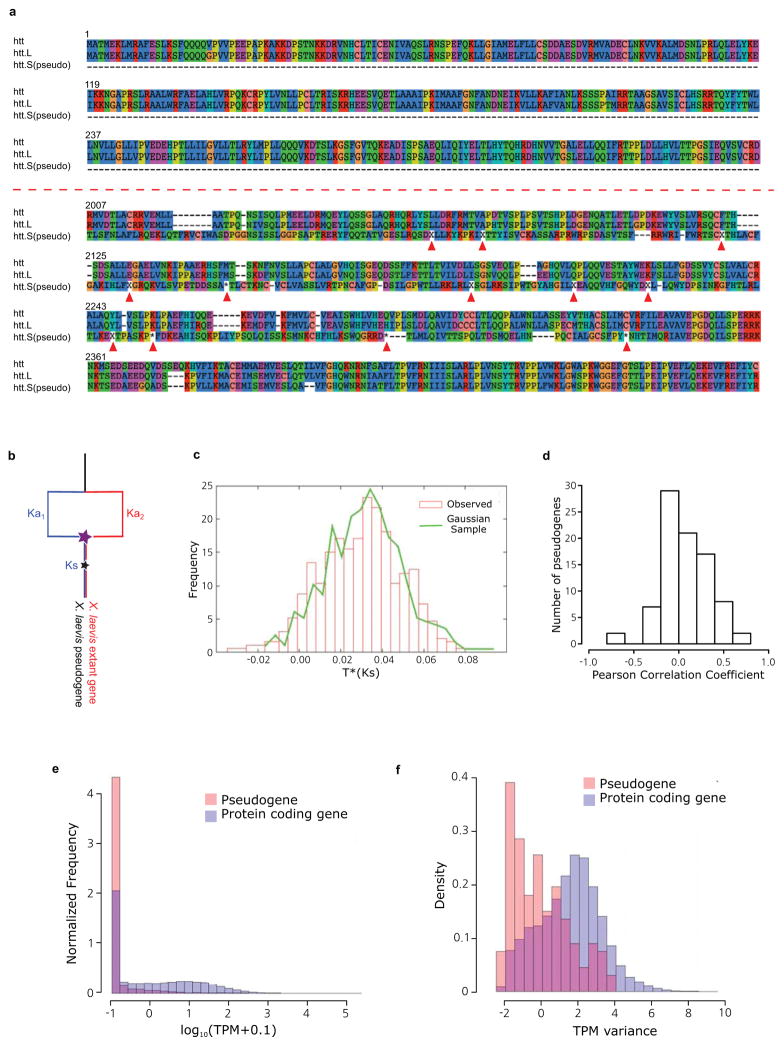
Illustration of htt.S pseudogene alignment to X. tropicalis htt, and the extant X. laevis htt.L, translated to amino acids. The amino acid position is shown at the beginning of each line. Missing codons are marked by ‘−’. Frameshifts and premature stops are marked by ‘X’ and ‘*’ respectively (and pointed to with red arrows). (top) the first exon of the pseudogene is completely missing from the S chromosome. The characteristic poly-Q region is maintained by both htt and htt.L. (bottom) An exon with conservation in the pseudogene, illustrating that despite many frameshifts, premature stops, and the lack of a proper start, and insertions of new sequence, we identify many codons in the pseudogene that occur in large conserved blocks.
Illustration of our model to compute pseudogene ages. The star represents the point of nonfunctionalization for a currently pseudogenized locus. We assume the expected rate of nonsynonymous changes can be estimated by the Ka of the extant gene and X. tropicalis. We then compare the Ks and Ka of the pseudogene sequence to estimate the time of nonfunctionalization. See Supplemental Note 9 for a more detailed discussion.
Estimated epochs of pseudogenization for 430 genes are indistinguishable from a burst of pseudogenization > 10 Mya (Ks > 0.03). See Supplemental Note 9 for a more detailed discussion.
Correlation of pseudogene expression with its extant homeolog. The little expression seen in pseudogenes tends to be uncorrelated with the extant homeolog.
Histogram of pseudogene expression values across all 28 tissues and developmental stages (red) compared to all extant genes (blue). The pseudogenes are rarely expressed, and tend to be expressed at lower levels than extant protein-coding genes.
Histograms of expression variance of pseudogenes (red) compared to extant genes (blue). The small amount of pseudogene expression observed does not tend to vary across tissues and developmental stages in the same way that extant genes do.
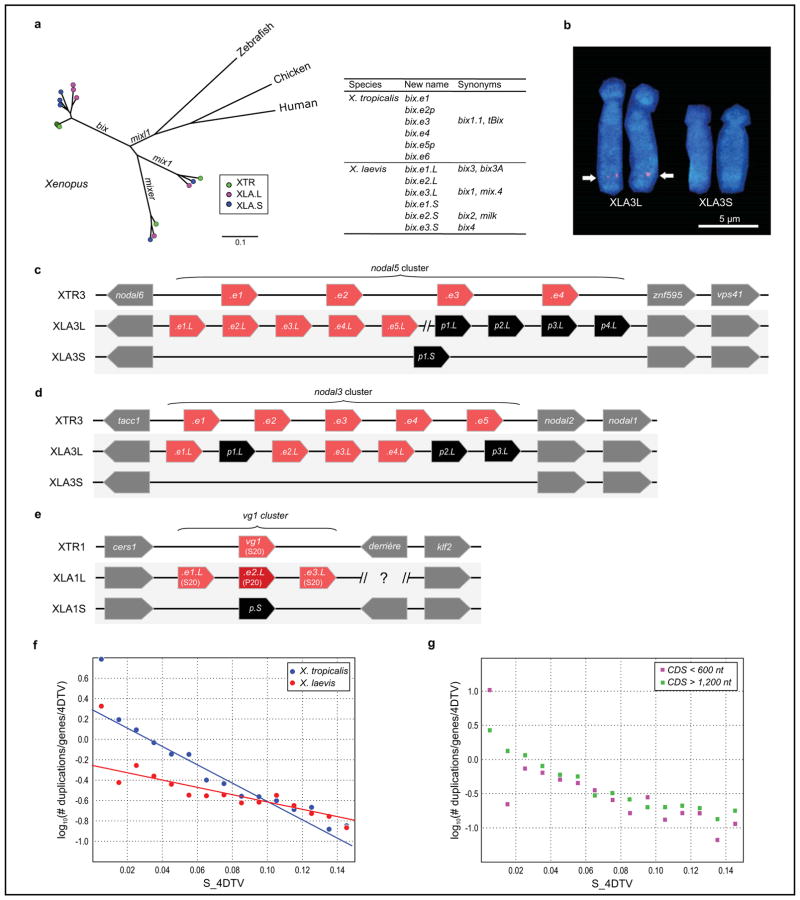
Phylogenetic trees of the mix/bix cluster. Nucleotide sequences were aligned using MUSCLE, and a phylogenetic diagram was generated by the ML method with 1,000 bootstraps (MEGA6). Circles with different colors represent X. laevis L genes (magenta), X. laevis S genes (blue), and X. tropicalis genes (green). The table shows the correspondence of bix gene names proposed in this study and previously used (synonyms).
FISH analysis showing XLA3S-specific deletion of the nodal5 gene cluster. One unit of the nodal5 gene region, including exons, introns, and an intergenic region was used as a probe for FISH (counterstained with Hoechst). Arrows indicate the hybridization signals of nodal5s. Scale bar indicates 5 um.
Comparison of the nodal5 gene cluster. Genome sequencing revealed that nodal5.e1.L~.e5.L (in pink) and nodal6.L are clustered. Amplification of nodal5 gene in XLA3L and loss of this cluster in XLA3S were confirmed. Pseudogenes (nodal5p1.L~p4.L and nodal5p1.S) are indicated in black. The nodal5 cluster of X. tropicails does not contain any pseudogene.
X. laevis L chromosome has four complete copies of nodal3 (nodal3.e1.L~.e4.L), whereas the gene cluster is lost from the X. laevis S chromosome. A truncated nodal3 gene (nodal3p1.L) is likely to be a pseudogene, and highly degenerate pseudogenes (nodal3p2.L and nodal3p3.L) also exist on the L chromosome.
Like nodal3, vg1 is lost from the S chromosome although there is a pseudogene (vg1p.S). vg1 is specifically amplified on the X. laevis L chromosome (vg1.e1.L~.e3.L) in comparison with X. tropicalis. An amino acid change (Ser20 to Pro20) in Vg1 protein has been shown to result in functional differences (Supplementary Note 13.9). vg1 and derrière are orthologous to mammalian gdf1.
Fraction of all genes duplicated and retained to present epoch per 1 expected 4DTV(four-fold degenerate transversions) at different epochs (semi-log scale). Shown also are linear fits, which would be consistent with constant birth- and death rate models (first epoch is omitted from both fitted data sets, as is second epoch from X. laevis). See Supplemental Note 11 for a more detailed discussion.
Same, but for “short genes” (CDS < 600 bp) and “long genes” (CDS > 1200 bp) separately. The loss rate of new duplicates appears to be similar. If the extra copy of a newly duplicated gene were lost when the first 100% disabling mutation occurred, we would expect, on average, the longer genes to be lost.
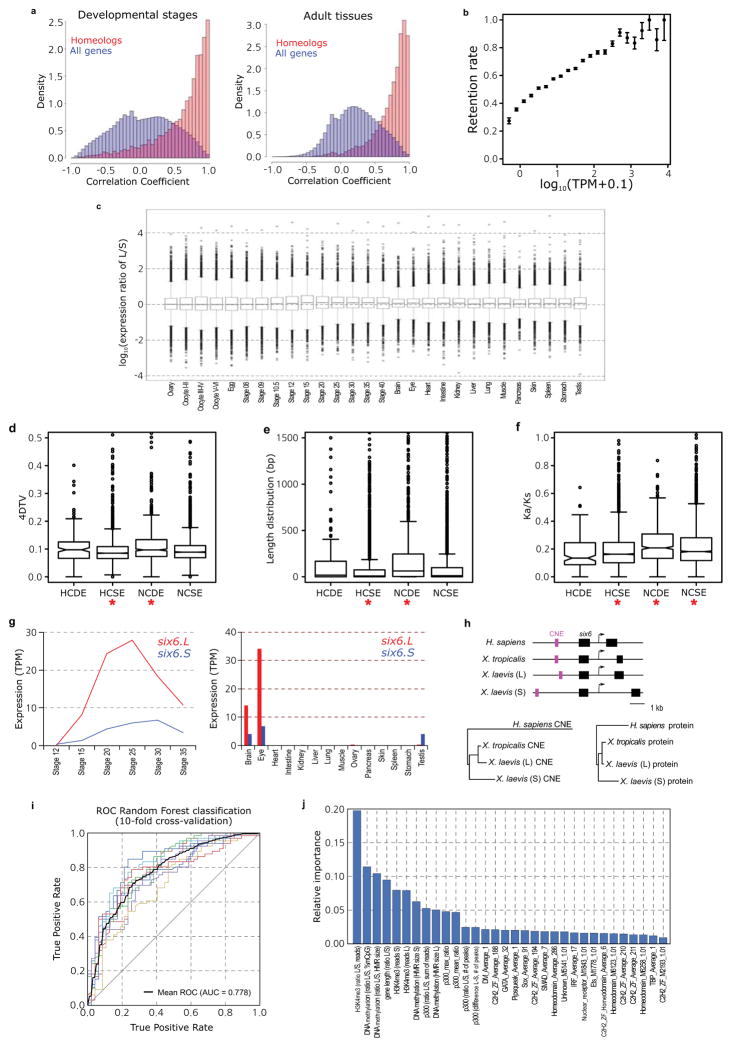
Pairwise Pearson correlation distributions between homeologous genes (red) and all genes (blue). The left histogram is for stage data; right is for adult data. The x-axis is the correlation; the y-axis is the percent of data. The homeologous genes have a correlation distribution closer to one due to their being the same locus recently. X. laevis TPM values 0.5 were lowered to 0. Any gene with no TPM > 0 was removed from analysis. We then added 0.1 to all TPM values and log transformed (log10).
Scatterplot comparing binned genes by their median X. tropicalis expression64 to the retention rate of their X. laevis (co)-orthologs. Error bars are the standard deviation for the whole data set divided by the square root of the number of genes analyzed in a bin. We assessed significance by a Wilcoxon test of the homeologous and singleton distributions, p-value = 6.31E-113.
Complete boxplot shown in Fig. 4c. The difference between subgenomes is difficult to see at this magnification, illustrating that many loci deviate from the whole genome median of preferring the L homeolog. There are some L outliers expressed 104 as much as their S homeologs, whereas no S genes shows such a strong trend. These differences are discussed in more detail in Supplemental Note 12.
Boxplot of 4DTv (four-fold degenerate transversions) by homeolog class defined in Supplemental Note 12.4. Significant differences are marked by a red asterisk (Wilcoxon p<1E-5). HCSE group shows lower sequence change than others (p=3.7E-12) and the NCDE group shows high rates of sequence change (p=5.6E-14).
Boxplot of CDS length difference between X. laevis homeologs by homeolog class defined in Supplemental Note 12.4. Significant differences are marked by a red asterisk (Wilcoxon p<1E-5). HCSE group shows smaller CDS length differences than others (p=2.4E-13) and the NCDE group shows large differences in homeolog CDS length (p=2.1E-32).
Boxplot of Ka/Ks between X. laevis homeologs by homeolog class defined in Supplemental Note 12.4. Significant differences are marked by a red asterisk (t-test p<1E-5). HCSE group shows lower non-synonymous sequence change than others (p=8.2E-19) and the NCDE and NCSE groups shows higher rates of non-synonymous sequence change (p=2.0E-12 and p=7.0E-9 respectively).
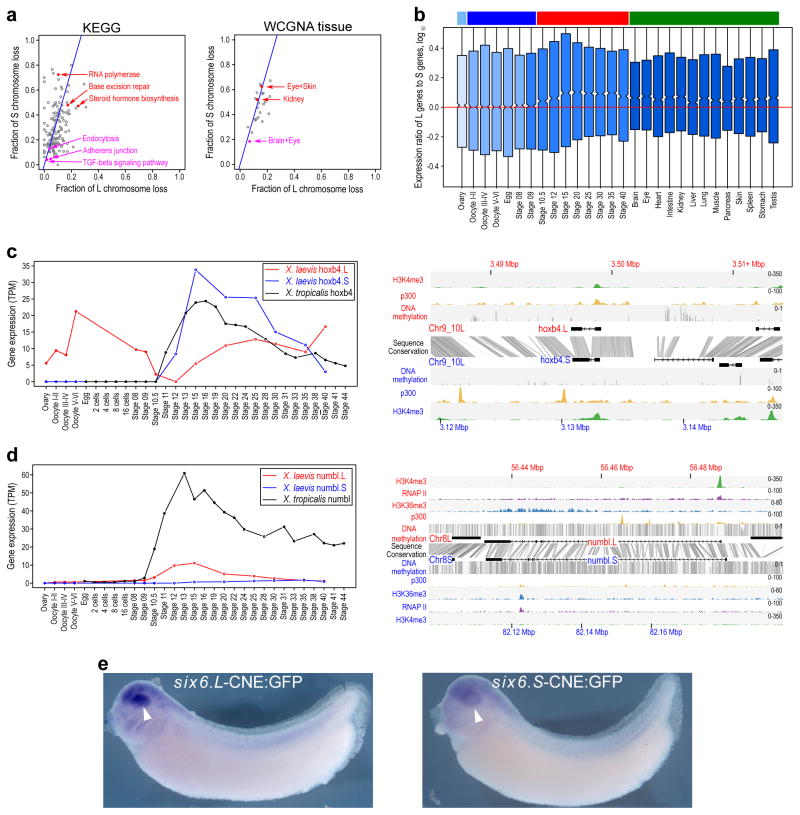
RNA-seq analysis of six6.L (red) and six6.S (blue) during X. laevis development (left panel) and in the adult tissues (right panel). Expression levels of six6.S were lower than those of six6.L at most developmental stages and in adult tissues.
Diagram of Homo sapiens, X. tropicalis and X. laevis six6 loci (upper panel). Magenta and black boxes indicate CNEs and exons, respectively. The phylogenetic tree analyses of H. sapiens, X. tropicalis and X. laevis six6 CNEs (lower left panel), and Six6 proteins (lower right panel). Notably, six6.S is more diverged from X. tropicalis six6 than six6.L, both in the encoded protein sequences and in conserved non-coding elements (CNEs) within 3 kb from the transcription start sites. Materials, methods and the CNE locations on genome assemblies are described in Supplementary Materials (Supplementary Note 13.1).
On the basis of chromatin state properties, a Random Forest machine-learning algorithm can accurately predict L versus S expression bias. The classification is based on all genes with greater than 3-fold expression difference at NF stage 10.5 (a set of 1,129 genes). The mean (dotted black line) of the ROC area under the curve is 0.778 (10-fold cross-validation). Features were selected using Linear Support Vector Classification and are shown in Extended Data Fig. 8j.
Relative importance (based on Gini impurity) of selected features used in the Random Forest classification. All features used in the classification are shown. Among various variables, the ratios of H3K4me3 and DNA methylation at the promoter contributed most to the decision tree model. A difference in p300 binding in the genomic region surrounding the gene also contributed to the Random Forest classification, as did the presence or absence of a number of specific transcription factor motifs in the promoter.
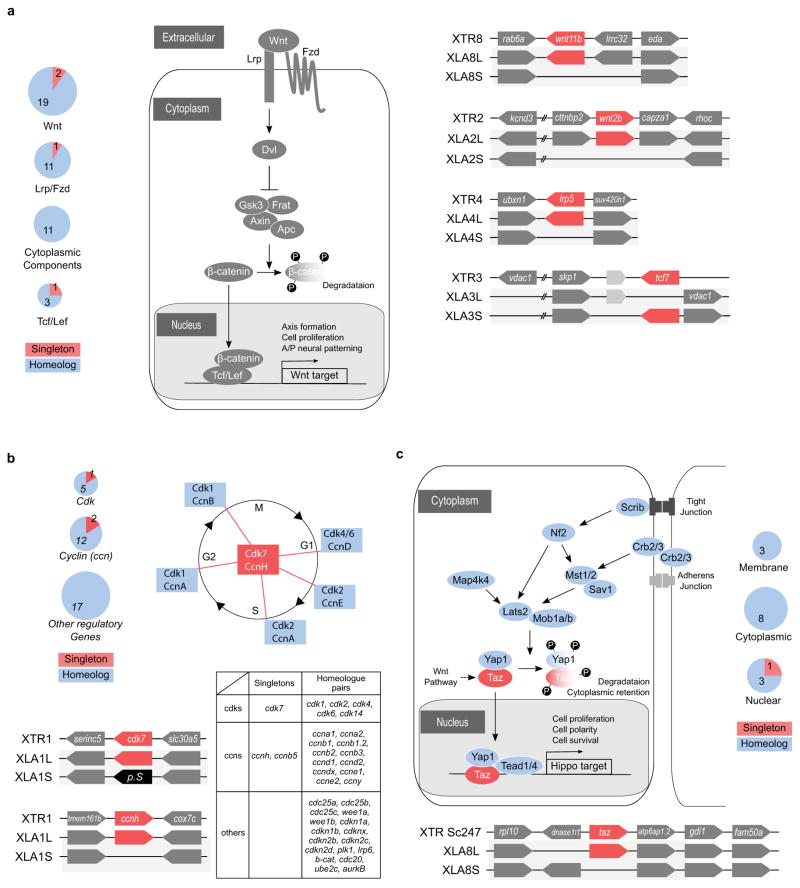
Wnt pathway. Left panel: Several key components of the canonical Wnt pathway in the X. laevis genome. The numbers in brackets show the number of paralogs. Components that have homeologous pair of genes or singleton are shown in blue and red, respectively. Each (Wnt:21 genes, LRP:2 genes, Fzd:10 genes, Dvl:3 genes, Frat(GBP):1 gene, GSK3:2 genes, Axin:2 genes, bcatenin: 1 gene, APC: 2 genes, TCF/LEF:4 genes) were classified into 4 groups according to subcellular localization, and the number of singleton and homeolog retained genes is shown by pie charts. Right panel: Syntenies around four singleton genes.
Cell cycle. Upper right panel: Diagram of the cell cycle and regulatory proteins critical to each phase. Cyclin H (CcnH) and Cdk7 constitute Cdk-activating kinase (CAK), a key factor required for activation of all Cdks. Genes encoding Cyclin H and Cdk7 (red), but not other regulators (blue), became singletons. Upper left panel: Pie charts show the numbers of homeologous pairs (blue) and singletons (red) in each functional category as indicated. Lower left panel: Syntenies of ccnh and cdk7 loci in X. tropicalis and X. laevis. Abbreviations for species and chromosome numbers: X. tropicalis (XTR1), X. laevis (XLA1L and XLA1S). Lower right table: Individual genes used for drawing the pie charts are shown in the table.
Hippo pathway. Upper panel: Hippo pathway components and retention of their homeologous gene pairs. All genes for Hippo pathway components as indicated were identified in the whole genome of X. laevis. Blue icons indicate that both of the homeologous genes are expressed in normal development and adult organs. The red icon, Taz, indicates a singleton. Yap is interchangeable with Taz in most cases, but TAZ, but not YAP, serves as a mediator of Wnt signaling (broken line). Pie charts show the numbers of homeolog pairs (blue) and singleton (red) in each category of Hippo pathway components classified according to subcellular localization. Lower panel: Comparative analysis of syntenies around the taz gene. X. tropicalis scaffold247 is not incorporated into the chromosome-scale assembly (v9) and hence its chromosomal location is not known yet. The p arm termini of XLA8L and XLA8S are on the left.
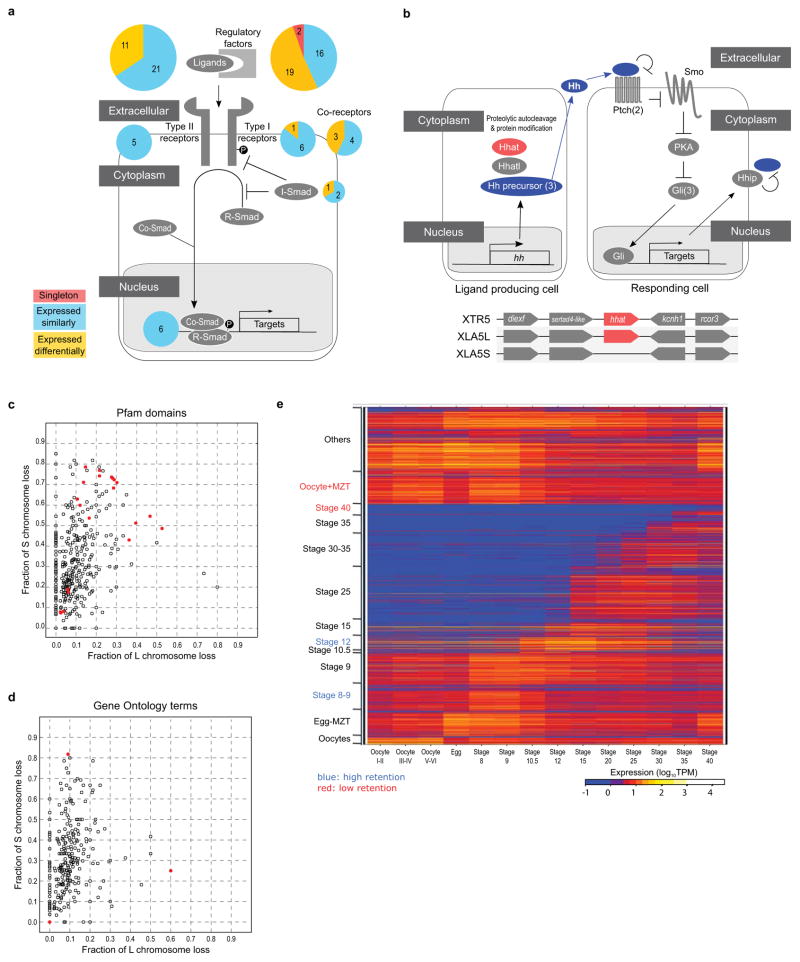
TGF-beta pathway. Pie charts indicate the ratio of differentially expressed homeologous pairs (orange) and singleton (red). A large portion of the extracellular regulatory factors is either differentially regulated or became singleton. Genes for a type I receptor, co-receptors, an inhibitory Smad are also differentially regulated. Multicopy genes like nodal3, nodal5, and vg1 are not counted as singletons, though those S genes are deleted. Instead, these and duplicated chordin genes are categorized into differentially regulated genes.
Hedgehog pathway. Upper panel: The simplified Hedgehog pathway known in Shh signalling is schematically shown. Most signalling components are encoded by both homeologous genes, whereas Hhat (shown in red) is encoded by a singleton gene. In case paralogs exist, the numbers of paralogs are shown in parenthesis. In the left cell, the Shh precursor (Hh precursor) is matured through the process involving Hhat and Hhatl, and secreted. In the right cell, the binding of Shh (Hh) to Ptch1 (Ptch) receptor inhibits Ptch1-mediated repression of Smo, leading to Smo activation and subsequent inhibition of PKA; otherwise PKA converts Gli activators to truncated repressors. As a consequence, Gli proteins activate target genes, such as Ptch1 and Hhip. The transmembrane protein Hhip binds Shh and suppresses Shh activity. Lower panel: Schematic comparison of syntenies around hhat genes of X. tropicalis chromosome 5 (top) and X. laevis 5L chromosome (middle), and the corresponding region of X. laevis 5S chromosome (bottom). The diagram is not drawn to scale.
Deletions rates on L (x-axis), vs S (y-axis) for different Pfam groups. For Pfam groups we computed the number of X. laevis single-copy genes (singletons) vs homeolog pairs and computes a fraction retained. The line is expected L/S loss based on genome-wide average (56.4%). Red points show groups with high or low rates of loss (p<.01). See Supplemental Table 5 for more information.
Deletions rates on L (x-axis), vs S (y-axis) for different stage WGCNA groups (visualized as a heatmap in Fig. 4a). For stage WGCNA groups we computed the number of X. laevis single-copy genes (singletons) vs homeolog pairs and computes a fraction retained. The line is expected L/S loss based on genome-wide average (56.4%). Red points show groups with high or low rates of loss (p<.01).
Deletion rates on L (x-axis), vs S (y-axis) for different GO groups. For GO groups we computed the number of X. laevis single-copy genes (singletons) vs homeolog pairs and computes a fraction retained. The line is expected L/S loss based on genome-wide average (56.4%). Red points show groups with high or low rates of loss (p<0.01). See Supplemental Table 5 for more information.
Comment in
-
Genomics: A matched set of frog sequences.Nature. 2016 Oct 20;538(7625):320-321. doi: 10.1038/538320a. Nature. 2016. PMID: 27762363 No abstract available.
Similar articles
-
Divergent subgenome evolution in the allotetraploid frog Xenopus calcaratus.Gene. 2023 Jan 30;851:146974. doi: 10.1016/j.gene.2022.146974. Epub 2022 Oct 27. Gene. 2023. PMID: 36309242
-
Regulatory remodeling in the allo-tetraploid frog Xenopus laevis.Genome Biol. 2017 Oct 24;18(1):198. doi: 10.1186/s13059-017-1335-7. Genome Biol. 2017. PMID: 29065907 Free PMC article.
-
Genome organization of the vg1 and nodal3 gene clusters in the allotetraploid frog Xenopus laevis.Dev Biol. 2017 Jun 15;426(2):236-244. doi: 10.1016/j.ydbio.2016.04.014. Epub 2016 Oct 5. Dev Biol. 2017. PMID: 27720224
-
Molecular Polymorphism and Divergence of Duplicated Genes in Tetraploid African Clawed Frogs (Xenopus).Cytogenet Genome Res. 2015;145(3-4):243-52. doi: 10.1159/000431108. Epub 2015 Jun 9. Cytogenet Genome Res. 2015. PMID: 26066830 Review.
-
Manipulating the Xenopus genome with transposable elements.Genome Biol. 2007;8 Suppl 1(Suppl 1):S11. doi: 10.1186/gb-2007-8-s1-s11. Genome Biol. 2007. PMID: 18047688 Free PMC article. Review.
Cited by
-
Comparative Distribution of Repetitive Sequences in the Karyotypes of Xenopus tropicalis and Xenopus laevis (Anura, Pipidae).Genes (Basel). 2021 Apr 21;12(5):617. doi: 10.3390/genes12050617. Genes (Basel). 2021. PMID: 33919402 Free PMC article.
-
Genomics: A matched set of frog sequences.Nature. 2016 Oct 20;538(7625):320-321. doi: 10.1038/538320a. Nature. 2016. PMID: 27762363 No abstract available.
-
New Species Can Broaden Myelin Research: Suitability of Little Skate, Leucoraja erinacea.Life (Basel). 2021 Feb 11;11(2):136. doi: 10.3390/life11020136. Life (Basel). 2021. PMID: 33670172 Free PMC article.
-
Identification and characterization of centromeric sequences in Xenopus laevis.Genome Res. 2021 Jun;31(6):958-967. doi: 10.1101/gr.267781.120. Epub 2021 Apr 19. Genome Res. 2021. PMID: 33875480 Free PMC article.
-
Unraveling the Unusual Subgenomic Organization in the Neopolyploid Free-Living Flatworm Macrostomum lignano.Mol Biol Evol. 2023 Dec 1;40(12):msad250. doi: 10.1093/molbev/msad250. Mol Biol Evol. 2023. PMID: 37979163 Free PMC article.
References
-
- Van de Peer Y, Maere S, Meyer A. The evolutionary significance of ancient genome duplications. Nat Rev Genet. 2009;10:725–32. - PubMed
-
- Holland PW, Garcia-Fernàndez J, Williams NA, Sidow A. Gene duplications and the origins of vertebrate development. Development. 1994:125–33. - PubMed
-
- Muller HJ. Why Polyploidy is Rarer in Animals Than in Plants. Am Nat. 1925;59:346–353.
-
- Orr HA. ‘Why Polyploidy is Rarer in Animals Than in Plants’ Revisited. Am Nat. 1990;136:759–770.
Publication types
MeSH terms
Substances
Grants and funding
- HD065705/US/United States/United States
- GM086321/US/United States/United States
- T32 HG000047/HG/NHGRI NIH HHS/United States
- R35 GM118183/GM/NIGMS NIH HHS/United States
- P41 HD064556/HD/NICHD NIH HHS/United States
- R01 GM042341/GM/NIGMS NIH HHS/United States
- R01 HD069344/HD/NICHD NIH HHS/United States
- R01 GM086627/GM/NIGMS NIH HHS/United States
- R21 GM119021/GM/NIGMS NIH HHS/United States
- R21 HD084072/HD/NICHD NIH HHS/United States
- R01 HD080708/HD/NICHD NIH HHS/United States
- HD080708/US/United States/United States
- R01 GM086321/GM/NIGMS NIH HHS/United States
- R01 GM104853/GM/NIGMS NIH HHS/United States
- R01 OD010549/OD/NIH HHS/United States
- R01 HL117164/HL/NHLBI NIH HHS/United States
LinkOut - more resources
Full Text Sources
Other Literature Sources
Molecular Biology Databases
Miscellaneous
