. 2016 Oct 18;45(4):817-830.
doi: 10.1016/j.immuni.2016.09.016.

Metabolic Reprogramming Mediated by the mTORC2-IRF4 Signaling Axis Is Essential for Macrophage Alternative Activation

Affiliations

Metabolic Reprogramming Mediated by the mTORC2-IRF4 Signaling Axis Is Essential for Macrophage Alternative Activation

Stanley Ching-Cheng Huang et al. Immunity. .

Abstract

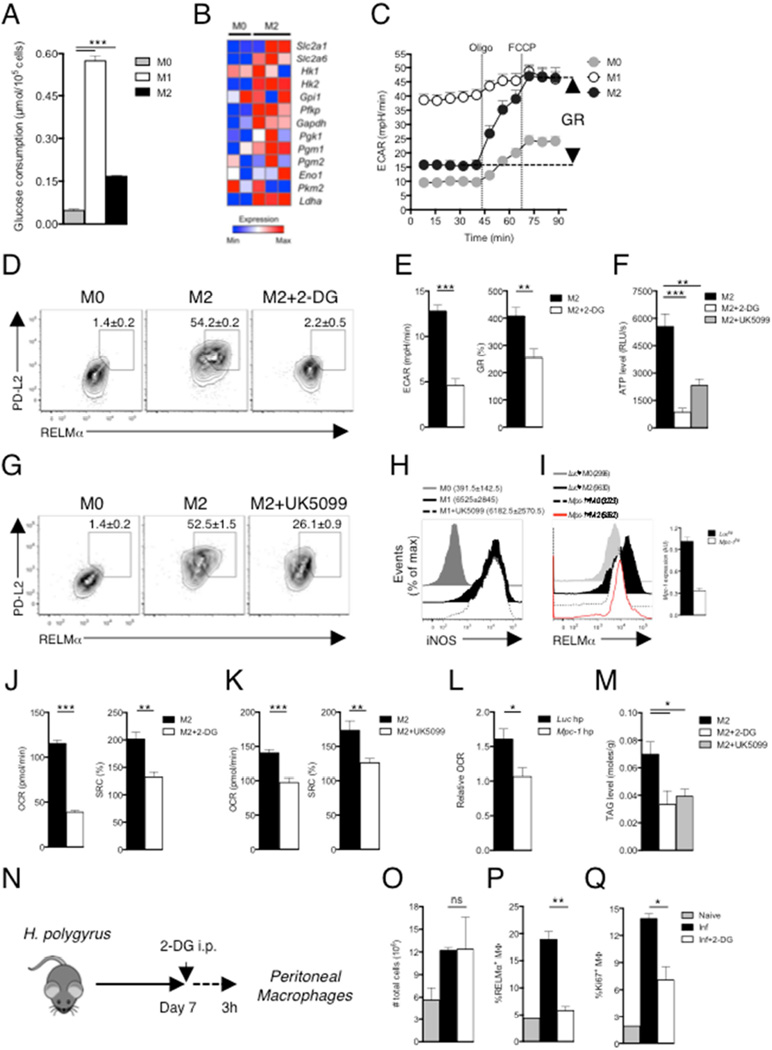
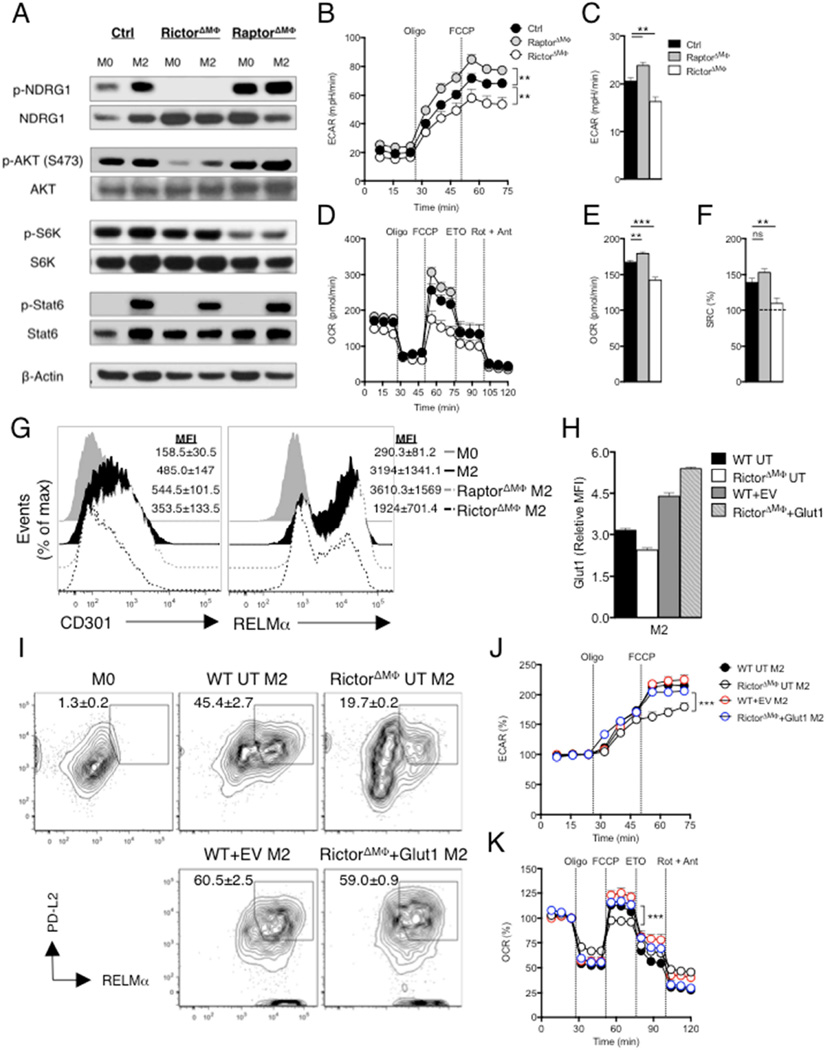
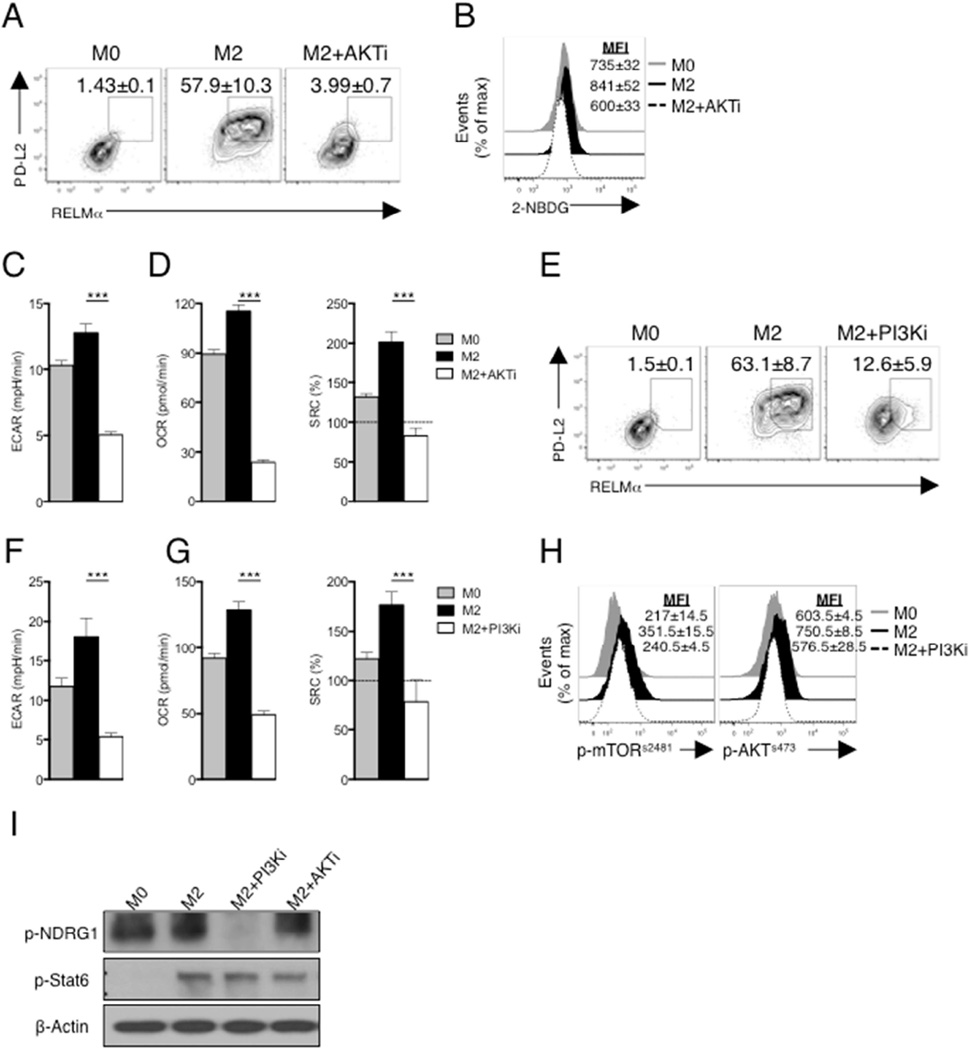
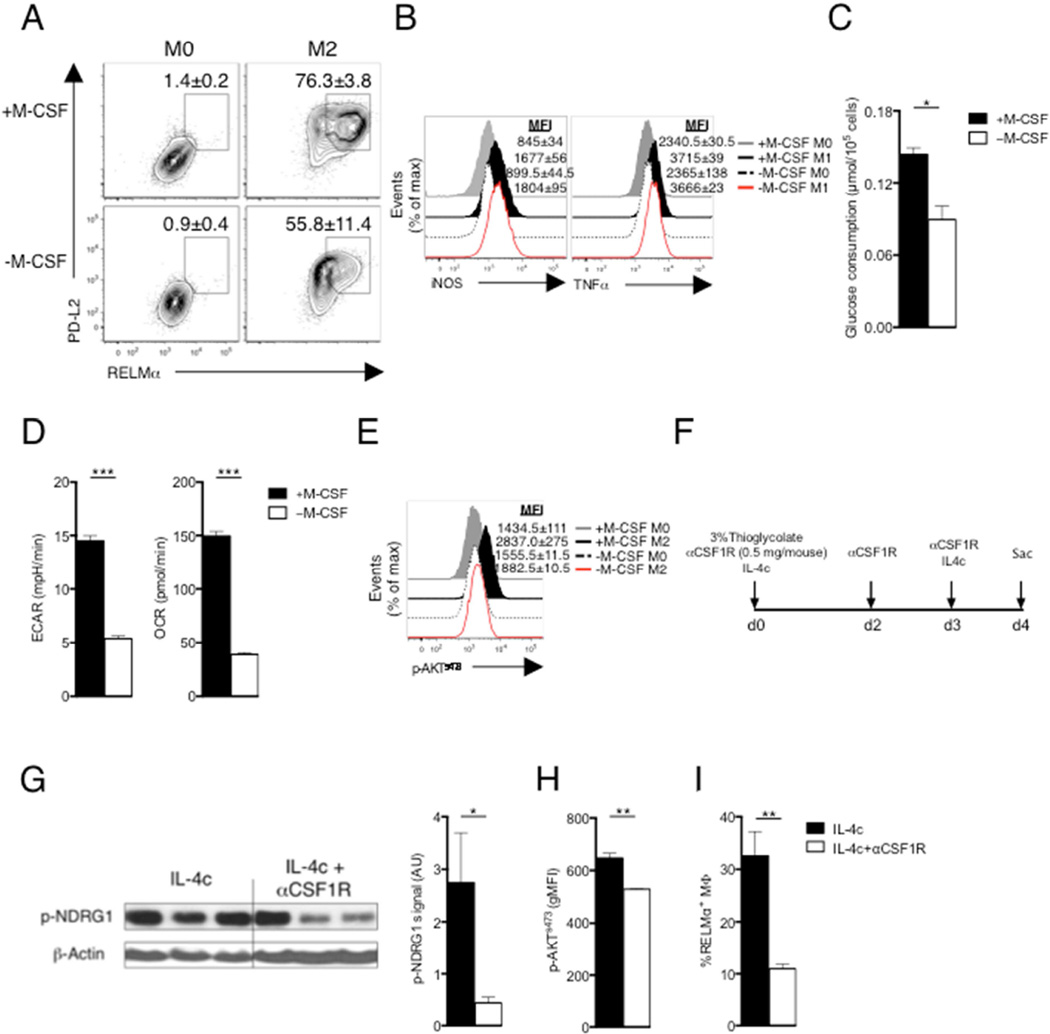
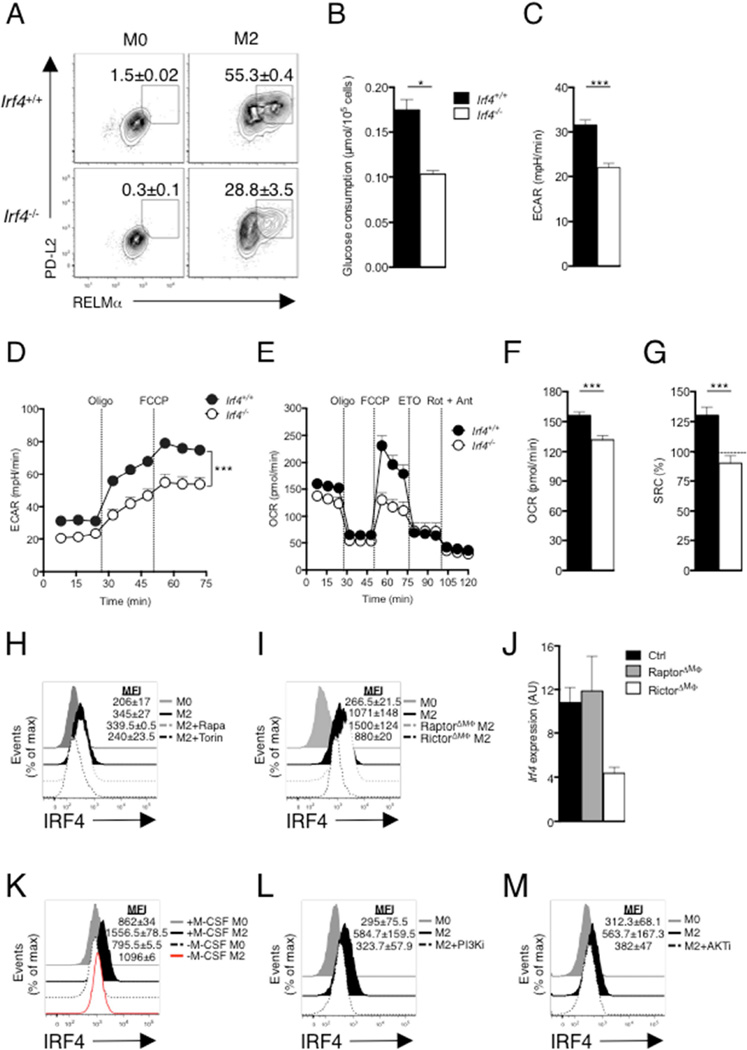
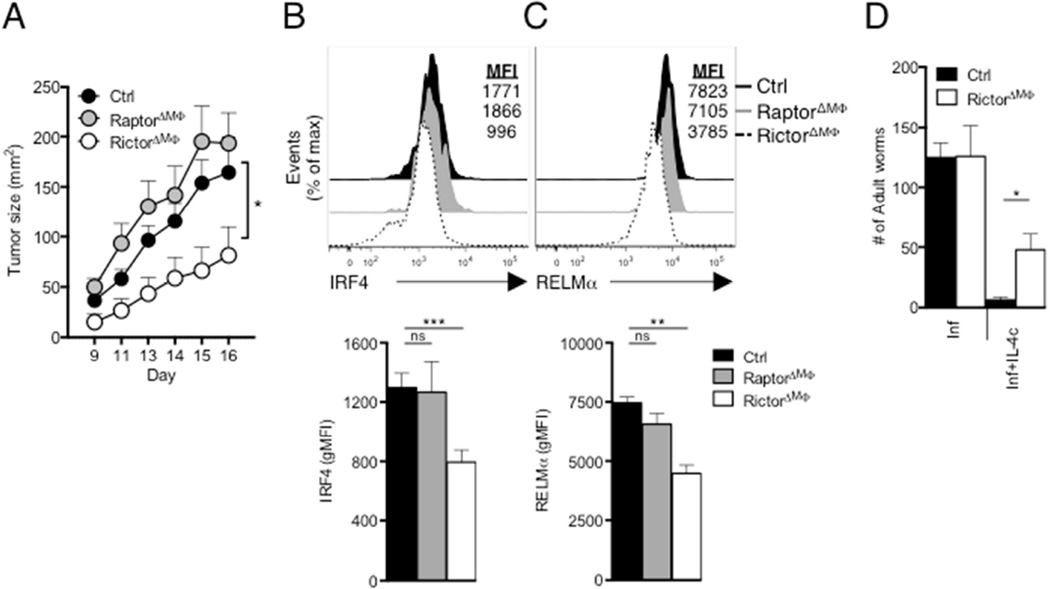
Macrophage activation status is intrinsically linked to metabolic remodeling. Macrophages stimulated by interleukin 4 (IL-4) to become alternatively (or, M2) activated increase fatty acid oxidation and oxidative phosphorylation; these metabolic changes are critical for M2 activation. Enhanced glucose utilization is also characteristic of the M2 metabolic signature. Here, we found that increased glucose utilization is essential for M2 activation. Increased glucose metabolism in IL-4-stimulated macrophages required the activation of the mTORC2 pathway, and loss of mTORC2 in macrophages suppressed tumor growth and decreased immunity to a parasitic nematode. Macrophage colony stimulating factor (M-CSF) was implicated as a contributing upstream activator of mTORC2 in a pathway that involved PI3K and AKT. mTORC2 operated in parallel with the IL-4Rα-Stat6 pathway to facilitate increased glycolysis during M2 activation via the induction of the transcription factor IRF4. IRF4 expression required both mTORC2 and Stat6 pathways, providing an underlying mechanism to explain how glucose utilization is increased to support M2 activation.

Keywords: cancer immunity; cytokine signaling; growth-factor signaling; macrophage; metabolism; type 2 immunity.


Figures

Figure 1
Figure 1. Glucose metabolism is essential for M2 macrophage activation
(A) Glucose uptake by bone marrow macrophages cultured for 24 hr in medium alone (M0) or with IFNγ plus LPS (M1), or with IL-4 (M2). (B) Relative expression of genes encoding glycolysis pathway enzymes. (C) ECAR at baseline and after sequential treatment with oligomycin (Oligo) and FCCP. GR, glycolytic reserve. (D) PD-L2 and RELMα expression in macrophages cultured for 24 hr in IL-4 with or without 2-DG, and in M0 macrophages. (E) Effect of 2-DG on Basal ECAR and GR in M2 macrophages. (F) Levels of ATP in macrophages cultured for 24 hr without (M0) or with (M2) IL-4 with or without 2-DG or UK5099. (G) PD-L2 and RELMα expression in macrophages cultured for 24 hr in IL-4 with or without UK5099, and in M0 macrophages. (H) iNOS expression by macrophages cultured for 24 hr in M0 or M1-polarizing conditions with or without UK5099. (I) RELMα expression in M2 macrophages transduced with Luc hpRNA or Mpc-1 hpRNA retroviruses. (J–K) Basal OCR and SRC of M2 macrophages with or without 2-DG or UK5099. (L) Relative OCR of Mpc-1 hpRNA transduced M2 macrophages, relative to untransduced M0 macrophages. (M) Levels of TAGs in macrophages cultured for 24 hr with IL-4 with or without 2-DG or UK5099. (N) Plan to assess the role of glucose in M2 macrophage activation during helminth infection. (O) The total number of PEC; (P) the frequency of RELMα+ pMacs, and (Q) the percentage of pMacs expressing the proliferation marker Ki67 (Ki67+MΦ), in mice from experiment shown in (N). PEC from naïve mice (2 per group) were controls. *P < 0.05, **P < 0.005 and ***P < 0.0001 (Student’s t-test). In D–I data are from flow cytometry. In D, G, H and I data from pooled replicates from one experiment are shown. In D, G, numbers are percentages of macrophages that are positive for both markers and in H, I, numbers are mean fluorescence intensity (MFI). Numbers in these panels represent mean ± s.e.m of data from three or more independent experiments. In A, E, F, J–M and O–Q, data are mean ± s.e.m. of technical replicates from one experiment, representative of 3 or more independent experiments. In B data from macrophages harvested from two MO cultures and three M2 cultures are shown.
Figure 2
Figure 2. mTORC2 is required to promote metabolic reprogramming and cellular activation in IL-4 stimulated macrophages
Bone marrow macrophages were from WT (Ctrl), RictorΔMΦ and RaptorΔMΦ mice. (A) Activity of mTORC1 and mTORC2 was assessed by immunoblot analysis for the indicated phosphoproteins from M0 macrophages, or macrophages stimulated for 3 hr with IL-4 (M2). (B) ECAR of M2 macrophages at baseline and following sequential treatment with oligomycin and FCCP. (C) Basal ECAR of M2 macrophages. (D) OCR of M2 macrophages at baseline and following sequential treatment with oligomycin, FCCP, etomoxir (ETO) and rotenone + antimycin. (E–F) Basal OCR and SRC of M2 macrophages. (G) Expression of CD301 and RELMα in M2 macrophages, assessed by flow cytometry. MFI: mean fluorescence intensity. (H–K) WT or RictorΔMΦ macrophages were either untransduced (UT) or transduced with retrovirus encoding a control reporter gene (EV-Ctrl)) or a reporter gene plus the Slc2a1 sequence (encodes Glut1), and stimulated with IL-4. Glut1 expression (H), and expression of PD-L2 and RELMα (I) were measured by flow cytometry. M0 WT macrophages were included in as a control in (I). ECAR (J) and OCR (K) were measured sequentially before and following the addition of inhibitors as indicated. In B-F, H, J and K, data are mean ± s.e.m. of technical replicates from one experiment representative of two or more independent experiments. Data in A, G and I are from pooled replicates from one experiment representative of two or more independent experiments. Numbers in G and I are mean MFI ± s.e.m (G) or mean % ± s.e.m, of date from two or more experiments. **P < 0.005 and ***P < 0.0001.
Figure 3
Figure 3. PI3K/AKT signaling is essential for M2 activation
(A) PD-L2 and RELMα expression by macrophages cultured for 24 hr in the absence (M0) or presence of IL-4 (M2) plus or minus triciribine (AKTi). (B) 2-NBDG staining of macrophages treated as in panel A. (C,D) Basal ECAR, basal OCR and SRC of macrophages treated as in A. (E) Expression of PD-L2 and RELMα by M0 macrophages, or by M2 macrophages with or without LY294002 (PI3Ki) for 24 hr. (F,G) Basal ECAR, basal OCR and SRC in macrophages treated as in panel E. (H) Phosphorylation of mTORs2481 (p-mTORs2481) and AKTs473 (p- AKTs473) in macrophages treated as in panel E. (I) Phosphorylation of NDRG1 and Stat6 from unstimulated macrophages (M0) or macrophages stimulated with IL-4 (M2) for 3 hr in the presence or absence of PI3Ki and AKTi, assessed by immunoblot analysis. Data in A,B, E and H are from flow cytometry, and are from individual experiments, but numbers represent mean % or mean MFI, ± s.e.m, of data from three or more independent experiments. In C, D, F and G, data are mean ± s.e.m. of technical replicates from one experiment representative of three or more independent experiments. Data in I are from one experiment representative of three independent experiments. ***P < 0.0001.
Figure 4
Figure 4. M-CSF is essential to regulate mTORC2 signaling in M2 macrophages
(A) Expression of PD-L2 and RELMα in macrophages cultured for 24 hr with (M2) or without (M0) IL-4 or M-CSF. (B) Expression of iNOS and TNF-α in macrophages cultured for 24 hr with (M1) or without (M0) IFN-γ + LPS or M-CSF. (C) Glucose consumption, and (D) basal ECAR and basal OCR of M2 macrophages treated as in (A). (E) Level of phosphorylated AKTs473 in macrophages as in A, assessed by flow cytometry. MFI values are shown. (F) Scheme to examine the effect of blocking M-CSF/CSF1R interaction on M2 activation in vivo. (G) Phosphorylated NDRG1 (p-NDRG1) in pMacs was measured by immunoblot; band density was normalized to loading controls and is presented in arbitrary units (AU). (H) Level of AKTs473, phosphorylation, and (I) frequency of RELMα+ cells, in pMacs. Data in A,B, E, H and I are from, flow cytometry and in A, B and E are from one experiment representative, but numbers represent mean % (A) or MFI (B,E) values, ± s.e.m, from three independent experiments. In C,D and G–I, data are mean ± s.e.m. of technical replicates from one experiment representative of three or more independent experiments. *P < 0.05, **P < 0.005 and ***P < 0.0001.
Figure 5
Figure 5. IRF4 mediates glucose metabolism to promote M2 activation
Bone marrow macrophages were from WT (Irf4+/+) and Irf4−/− mice. (A) Expression of PD-L2 and RELMα in macrophages cultured for 24 hr without (M0) or with (M2) IL-4. (B) Glucose uptake and (C) basal ECAR after macrophage culture in IL-4 for 24 hr. (D) ECAR of macrophages cultured for 24 hr in IL-4, followed by sequential treatment with oligomycin and FCCP. (E) OCR of macrophages cultured for 24 hr in IL-4, followed by sequential treatment with oligomycin, FCCP, etomoxir and rotenone + antimycin. (F) OCR and (G) SRC of macrophages after culture in IL-4 for 24 hr. (H) IRF4 expression by macrophages after culture without or with IL-4 for 24 hr plus or minus rapamycin (Rapa; 20 nM) or Torin 1 (Torin; 100 nM). (I) IRF4 expression by Raptor or Rictor deficient macrophages after culture without or with IL-4 for 24 hr. (J) Expression of Irf4 in IL-4 stimulated WT macrophages, or macrophages lacking Raptor or Rictor, as measured by qRT-PCR (expression normalized to WT M0 macrophages and presented in arbitrary units, AU). (K–M) IRF4 expression by macrophages after culture without (M0) or with (M2) IL-4 or M-CSF (K), PI3Ki (L) or AKTi (M) for 24 hr. Data in A, H, I, K–M are from flow cytometry and are from individual experiments, but numbers represent mean % (A) or MFI, ± s.e.m., of data from 3 or more independent experiments. In B–G, data are mean ± s.e.m. values from technical replicates from one experiment, representative of three or more independent experiments). *P < 0.05, **P < 0.005 and ***P < 0.0001.
Figure 6
Figure 6. Loss of mTORC2 activity in macrophages suppresses tumorigenesis and inhibits protective immunity against H. polygyrus
(A) Growth profile of tumors following inoculation of 2×10⁵ B16-OVA melanoma cells into WT (Ctrl), RaptorΔMΦ or RictorΔMΦ mice. (B) Top, IRF4 expression by TAMS from day 16 tumors from from Ctrl, RaptorΔMΦ and RictorΔMΦ. Bottom, geometric MFI of IRF4 staining shown in top panel. (C) Top, RELMα expression by TAMs, as in (B). Bottom, gMFI of RELMα. staining shown in top panel. (D) Adult H. polygyrus counts from infected WT (Ctrl) and RictorΔMΦ mice which on days 9, 11, 13 and 15 after infection were injected with PBS (Inf) or IL-4c (Inf+IL-4c), followed by analysis on day 16. Data are mean ± s.e.m. of five to six individually analyzed mice/group in one experiment, and representative of two independent experiments (A–C), or from one experiment representative of two independent experiments (mean ± s.e.m. of three to five mice per group) (D). *P < 0.05, **P < 0.005 and ***P < 0.0001.

Similar articles

Cited by

References

    1. Albert V, Svensson K, Shimobayashi M, Colombi M, Munoz S, Jimenez V, Handschin C, Bosch F, Hall MN. mTORC2 sustains thermogenesis via Akt-induced glucose uptake and glycolysis in brown adipose tissue. EMBO Mol Med. 2016;8:232–246. - PMC - PubMed
    1. Byles V, Covarrubias AJ, Ben-Sahra I, Lamming DW, Sabatini DM, Manning BD, Horng T. The TSC-mTOR pathway regulates macrophage polarization. Nature communications. 2013;4:2834. - PMC - PubMed
    1. Cader MZ, Boroviak K, Zhang Q, Assadi G, Kempster SL, Sewell GW, Saveljeva S, Ashcroft JW, Clare S, Mukhopadhyay S, et al. C13orf31 (FAMIN) is a central regulator of immunometabolic function. Nat Immunol. 2016;17:1046–1056. - PMC - PubMed
    1. Chang CH, Qiu J, O'Sullivan D, Buck MD, Noguchi T, Curtis JD, Chen Q, Gindin M, Gubin MM, van der Windt GJ, et al. Metabolic Competition in the Tumor Microenvironment Is a Driver of Cancer Progression. Cell. 2015;162:1229–1241. - PMC - PubMed
    1. Chang M, Hamilton JA, Scholz GM, Masendycz P, Macaulay SL, Elsegood CL. Phosphatidylinostitol-3 kinase and phospholipase C enhance CSF-1-dependent macrophage survival by controlling glucose uptake. Cellular signalling. 2009;21:1361–1369. - PubMed

MeSH terms

Substances