. 2016 Nov 1;126(11):4205-4218.
doi: 10.1172/JCI87927. Epub 2016 Oct 17.

Long noncoding RNA Tug1 regulates mitochondrial bioenergetics in diabetic nephropathy

Long noncoding RNA Tug1 regulates mitochondrial bioenergetics in diabetic nephropathy

Jianyin Long et al. J Clin Invest. .

Abstract

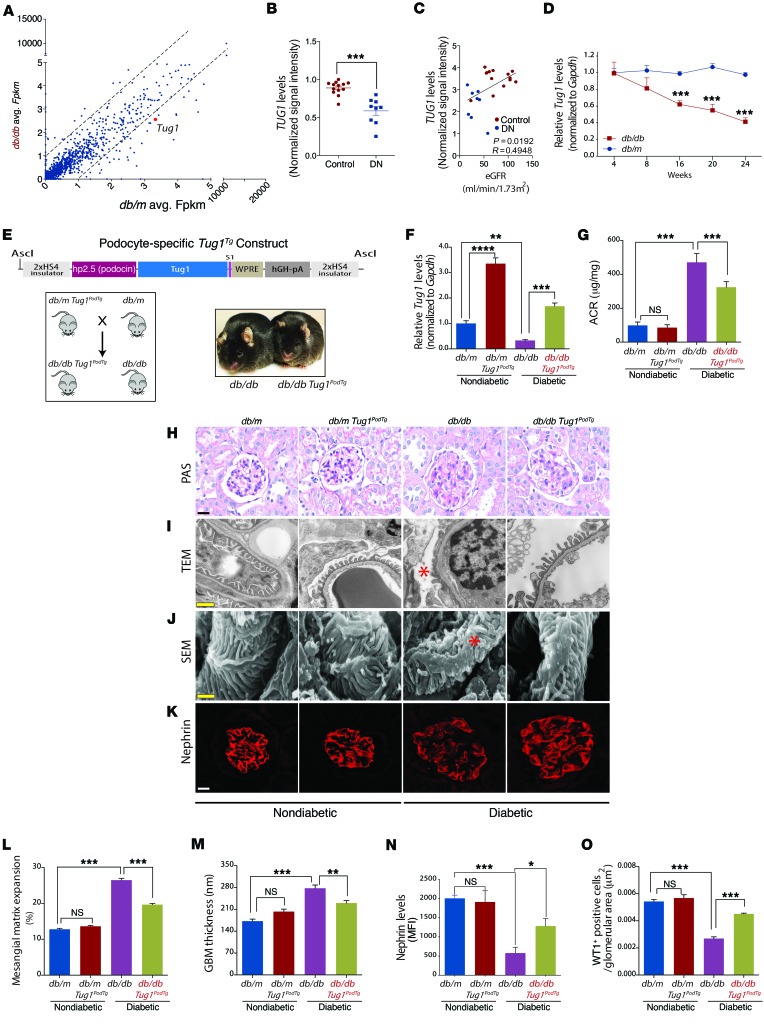
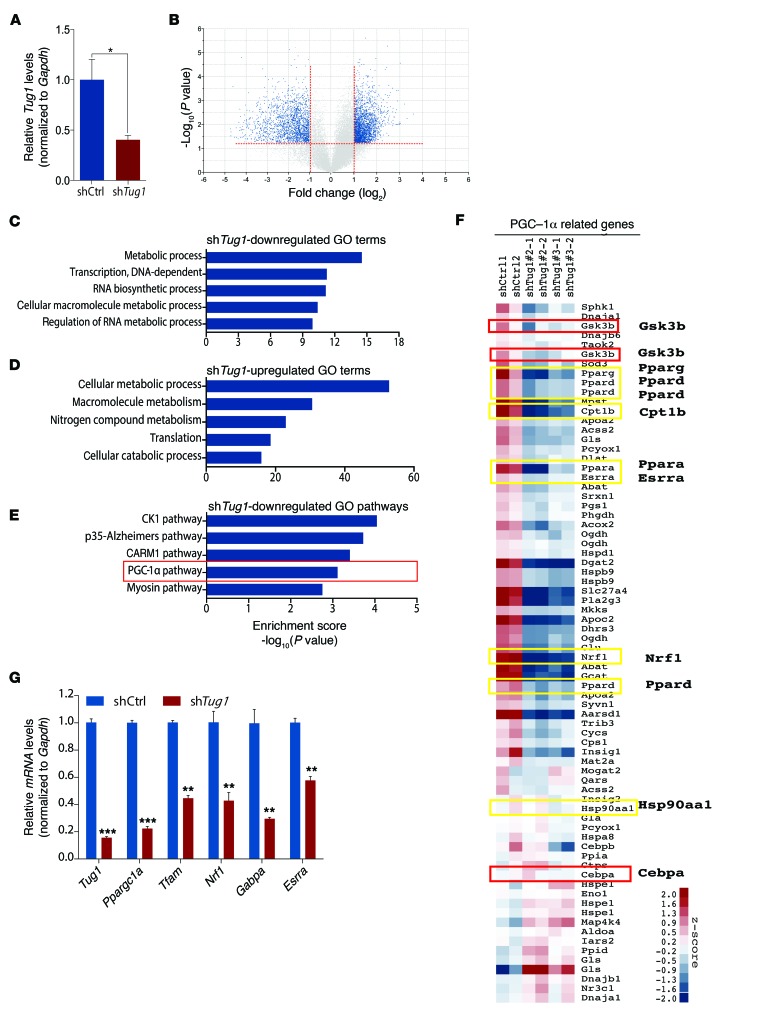
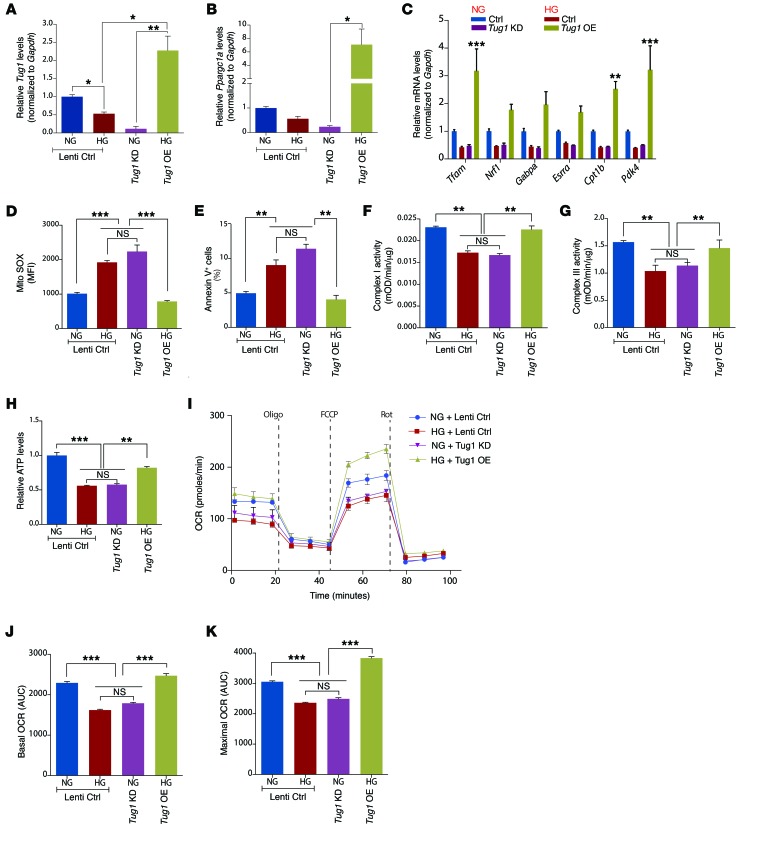
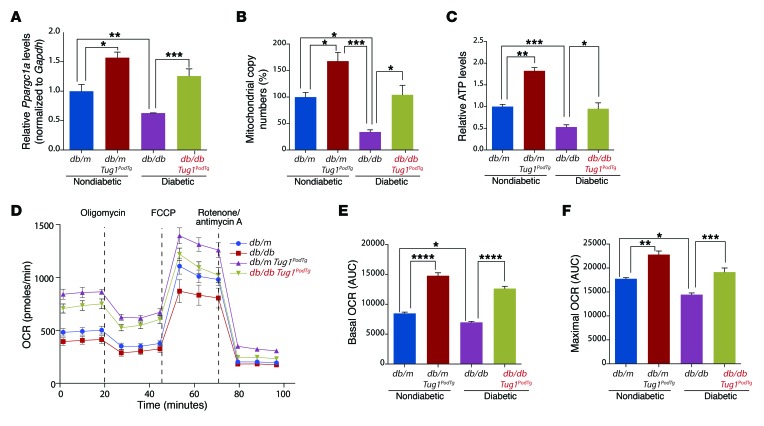
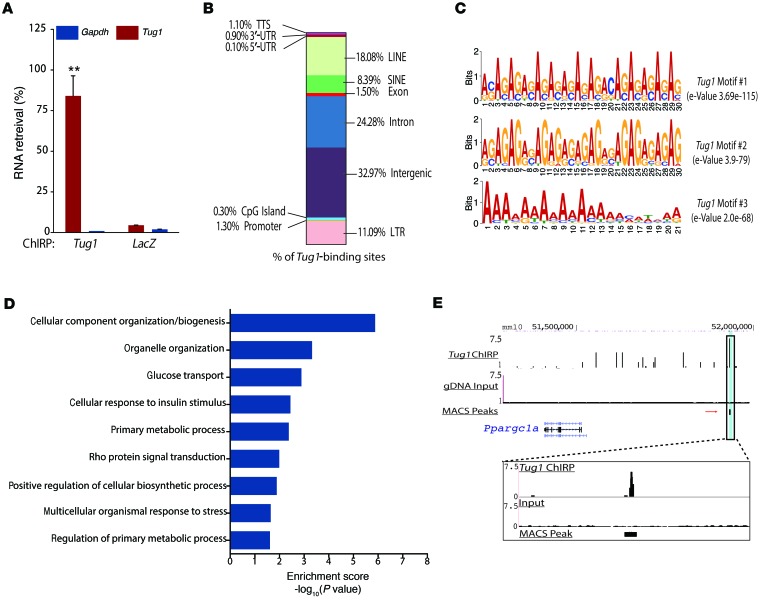
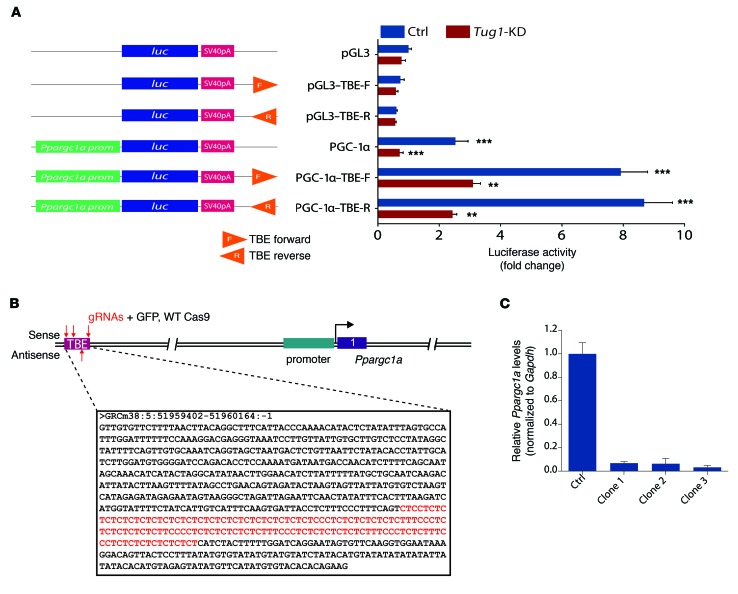
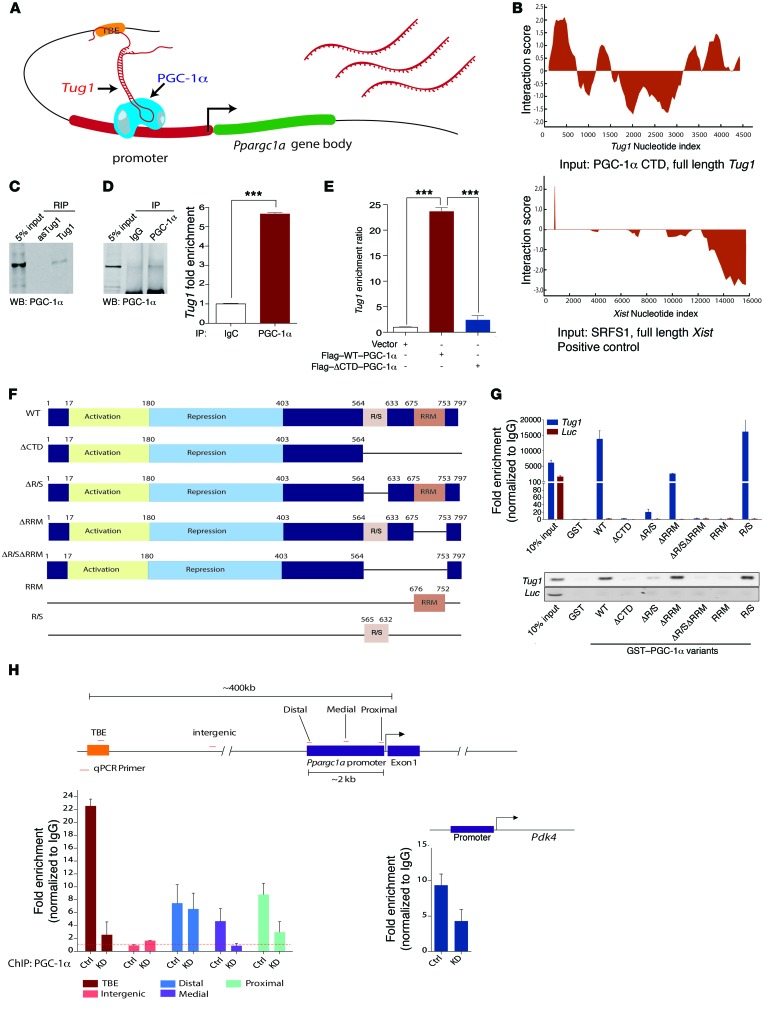
The regulatory roles of long noncoding RNAs (lncRNAs) in transcriptional coactivators are still largely unknown. Here, we have shown that the peroxisome proliferator-activated receptor γ (PPARγ) coactivator α (PGC-1α, encoded by Ppargc1a) is functionally regulated by the lncRNA taurine-upregulated gene 1 (Tug1). Further, we have described a role for Tug1 in the regulation of mitochondrial function in podocytes. Using a murine model of diabetic nephropathy (DN), we performed an unbiased RNA-sequencing (RNA-seq) analysis of kidney glomeruli and identified Tug1 as a differentially expressed lncRNA in the diabetic milieu. Podocyte-specific overexpression (OE) of Tug1 in diabetic mice improved the biochemical and histological features associated with DN. Unexpectedly, we found that Tug1 OE rescued the expression of PGC-1α and its transcriptional targets. Tug1 OE was also associated with improvements in mitochondrial bioenergetics in the podocytes of diabetic mice. Mechanistically, we found that the interaction between Tug1 and PGC-1α promotes the binding of PGC-1α to its own promoter. We identified a Tug1-binding element (TBE) upstream of the Ppargc1a gene and showed that Tug1 binds with the TBE to enhance Ppargc1a promoter activity. These findings indicate that a direct interaction between PGC-1α and Tug1 modulates mitochondrial bioenergetics in podocytes in the diabetic milieu.


Figures

Figure 1
Figure 1. Tug1 OE in podocytes protects against features of DN.
(A) Scatter plot of RNA-seq values for individual transcripts classified as noncoding RNAs. (B) Nephroseq expression data for TUG1 in control subjects (n = 13) and in subjects with DN (n =9). (C) Linear regression analysis of the same subjects in B, with eGFR values. (D) In vivo time course analysis of Tug1 expression in podocytes from diabetic and nondiabetic mice (n = 6 mice/group). (E) Schematic of Tug1Tg construct. Tug1 cDNA was cloned upstream of WPRE and hGH polyadenylation sequences. Expression is driven by the human NPHS2 (podocin) promoter. These elements are flanked by HS4 insulator sequences. Illustration shows the mating strategy to generate podocyte-specific diabetic Tug1PodTg mice. Representative image of adult control diabetic (db/db) and diabetic Tug1PodTg mice. (F) qPCR analysis of RNA isolated from podocytes measuring Tug1 levels in 24-week-old db/m (n = 5), db/db (n =5), db/m Tug1PodTg (n = 7), and db/db Tug1PodTg (n = 7) mice. (G) ACR analysis demonstrating a significant reduction in albuminuria in 24-week-old diabetic Tug1PodTg mice compared with that in controls, as in F. (HK) Representative (H) PAS-stained image; (I) TEM micrographs; (J) SEM micrographs; and (K) nephrin immunofluorescence confocal micrographs. Red asterisks on the TEM and SEM micrographs denote effaced podocyte foot processes. Scale bars: 50 μM (H and K), 0.5 μM (I), and 1 μM (J). (L) Quantification of mesangial matrix expansion determined as the percentage of PAS-positive area/glomerular area. (M) Quantification of GBM thickness. (N) Quantification of nephrin mean fluorescence intensity (MFI)/glomerular area. (O) Quantification of WT1-positive cells/glomerular area. *P < 0.05, **P < 0.01, ***P < 0.001, and ****P < 0.0001, by 2-tailed Student’s t test (B), linear regression analysis (C), and 1-way ANOVA, followed by Tukey’s post-hoc analysis (LO). Data represent the mean ± SEM.
Figure 2
Figure 2. Tug1 mediates expression of PGC-1α pathway genes.
(A) Gene expression analysis of RNA from pGIPZ-shControl (shCtrl) or shTug1 lentivirus–transduced podocytes used for microarray analysis. (B) Volcano plot of microarray data generated from Tug1-KD podocytes compared with controls. A cutoff of a log2 fold-change greater than 2 and a –log10 (P value) greater than 1 was used for downstream pathway analysis. (CE) Bioinformatics analysis of differentially regulated Tug1 target genes. (C and D) Biological processes GO terms from genes differentially up- and downregulated by Tug1. (E) Pathway analysis of Tug1-downregulated genes. (F) Hierarchical clustering analysis of RNA expression levels of PGC-1α–related genes in control podocytes compared with podocytes harboring stable KD of Tug1. Yellow boxes highlight genes that are direct targets of PGC-1α, and red boxes highlight its upstream regulators. (G) qPCR validation of several direct targets of PGC-1α. Expression values were normalized to Gapdh internal controls. Cell culture experiments were repeated at least 3 times. *P < 0.05, **P < 0.01, and ***P < 0.001 by 2-tailed Student’s t test (A and G). See Supplemental Methods for the data analysis steps related to BF. Data are expressed as the mean ± SEM.
Figure 3
Figure 3. Tug1 modulates Ppargc1a mRNA and mitochondrial bioenergetics in vitro.
(A and B) qPCR analysis of Ppargc1a and Tug1 in control (Lenti ctrl), Tug1-KD, or Tug1-OE cultured podocytes under NG or HG conditions. (C) qPCR of selected PGC-1α direct targets in podocytes from A. (D) Measurement of mitochondrial ROS in cultured podocytes, measured by flow cytometry as the MFI of MitoSOX. (E) Flow cytometric determination of the percentage of podocytes that underwent apoptosis as measured by annexin V–FITC+ cells. (F and G) Measurement of complex I and III activity in mitochondria isolated from cultured podocytes. (H) Relative ATP levels in podocytes, normalized to total protein content. (IK) Mitochondrial OCR analysis of cultured podocytes using the Seahorse XF24 Bioanalyzer device. Oligomycin (2 μM), FCCP (2 μM), and rotenone (0.5 μM)/antimycin A (0.5 μM) were added at the times indicated by dashed lines. Basal and maximal respiratory rates of podocytes were determined by calculating the AUC. Cell culture experiments were repeated at least 3 times. *P < 0.05, **P < 0.01, and ***P < 0.001, by 1-way ANOVA, followed by Tukey’s post-hoc analysis. Data are expressed as the mean ± SEM. mOD, milli optical density.
Figure 4
Figure 4. Tug1 modulates Ppargc1a mRNA and mitochondrial bioenergetics in vivo.
(A) qPCR analysis of Ppargc1a RNA levels and (B) determination of mitochondrial copy numbers in isolated podocytes from db/m (n = 5), db/db (n = 5), db/m Tug1PodTg (n = 4), and db/db Tug1PodTg (n = 7) mice. (C) Relative ATP levels in freshly isolated podocytes from the groups in A (n = 4 mice/group). (DF) Mitochondrial OCR analysis using the Seahorse XF24 Bioanalyzer device in cultured podocytes isolated from the groups in A. Oligomycin (2 μM), FCCP (2 μM), and rotenone (0.5 μM)/antimycin A (0.5 μM) were added at the times indicated by dashed lines. Basal and maximal respiratory rates of podocytes were determined by calculating the AUC for the groups from A. (E) Basal and (F) maximal mitochondrial OCR rates compared with controls. *P < 0.05, **P < 0.01, ***P < 0.001, and ****P < 0.0001 by 1-way ANOVA, followed by Tukey’s post-hoc analysis. Data are expressed as the mean ± SEM.
Figure 5
Figure 5. ChIRP-seq analysis reveals genome-wide binding sites for Tug1, including a TBE upstream of the Ppargc1a promoter.
(A) Biotinylated Tug1 antisense DNA probes retrieved approximately 77% of total Tug1 RNA. Biotinylated LacZ antisense DNA probes were unable to retrieve either RNA. **P < 0.01, by 2-tailed Student’s t test. Data are expressed as the mean ± SEM. (B) Percentage of Tug1-binding sites localized to different regions within the genome. LTR, long-terminal repeat; LINE, long-interspersed repetitive element; SINE, short-interspersed repetitive element. (C) Purine-rich stretches, either GA repeats or A repeats, represented the top scoring motifs among Tug1-binding sites. (D) Top GO analysis categories of biological processes related to Tug1-binding sites represented as enrichment scores: –log10(P value). (E) ChIRP-seq tag density at an intergenic, putative TBE approximately 400 kb upstream of the Ppargc1a gene promoter. Data are represented as Tug1-pulldown compared with input controls. Track heights were normalized to allow for comparison between groups. Tug1-pulldown data were generated from overlapping peak data from biological replicates of Tug1-odd pulldown and Tug1-even pulldown samples compared with input. Zoom inset highlights the peak height, and the location of MACS verified the peak. Aligned reads were used for peak calling of the ChIRP regions using MACS, version 1.4.0. gDNA, genomic DNA. Statistically significant ChIRP-enriched regions (peaks) were identified by comparison with input, using a P-value threshold of 10–5. Cell culture experiments were repeated at least 3 times. GO analysis was applied to peaks to determine the roles played in certain biological pathways or GO terms.
Figure 6
Figure 6. Tug1 enhances Ppargc1a promoter activity via the TBE.
(A) Schematic of Ppargc1a promoter-luciferase constructs. Right, luciferase reporter activity in control and Tug1-KD podocytes. Inclusion of the TBE leads to robust enhancement of promoter activity, which is significantly attenuated in Tug1-KD cells. **P < 0.01, and ***P < 0.001, by 2-tailed Student’s t test. luc, luciferase; F, forward; R, reverse. (B) Schematic of the genomic context of the TBE. The highlighted sequences refer to the sense strand of the TBE. The GA-repeat motif is located in the antisense strand. Genomic coordinates refer to Ensembl mouse genome assembly GRCm38. Red arrows indicate the position of the sgRNAs designed to target the TBE element. gRNAs, guide RNAs. (C) qPCR analysis of Ppargc1a mRNA in control podocytes and 3 independent TBE targeted clones. Expression values normalized to Gapdh internal controls. Cell culture experiments repeated at least 3 times. Data are expressed as the mean ± SEM. Ctrl, control.
Figure 7
Figure 7. Tug1 and PGC-1α directly interact to enhance Ppargc1a mRNA levels.
(A) Proposed model for the Tug1 mediated enhancement of Ppargc1a transcription. (B) Prediction of interaction propensity between the CTD and full length Tug1 RNA. Positive interaction score predicts increased propensity of binding. Control interaction plot (bottom panel) depicts experimentally validated interaction between the lncRNA Xist and its binding partner SRSF1. Positive Interaction Score indicates predicted binding. (C) Western blot (WB) analysis of podocyte nuclear extract incubated with sense or antisense biotinylated Tug1 demonstrating PGC-1α interaction with sense Tug1 RNA. (D) Western blot analysis confirming IP of endogenous PGC-1α from podocytes. qPCR analysis for Tug1 RNA in PGC-1α or IgG immunoprecipitated extracts. (E) qPCR analysis of RNA isolated from IP with Flag antibody from HEK293T cells transfected with Flag-tagged WT or the CTD deletion mutant (ΔCTD) PGC-1α. (F) Diagram of the GST PGC-1α variants used in domain mapping. (G) qPCR analysis of in vitro binding reactions using in vitro–transcribed Tug1 RNA or a luciferase RNA control incubated with the fusion protein constructs described in F. Agarose gel of qPCR products of Tug1 and luciferase. (H) Left: ChIP-qPCR analysis of PGC-1α in control WT (Ctrl) and Tug1-KD cells at the upstream TBE element, an intergenic region devoid of the predicted PGC-1α interaction, and the Ppargc1a gene promoter (primers spanning the distal, medial, and proximal regions of the promoter). Right: Positive control ChIP with primers designed to detect the promoter region of Pdk4. Data were fold-enrichment normalized to IgG. Cell culture experiments were repeated at least 3 times. ***P < 0.001, by 2-tailed Student’s t test (D). RNA-protein interaction scores were generated using catRAPID fragments software (33). ***P < 0.001, by 1-way ANOVA, followed by Tukey’s post-hoc test (E). Data are expressed as the mean ± SEM.

Comment in

Similar articles

Cited by

References

    1. Djebali S, et al. Landscape of transcription in human cells. Nature. 2012;489(7414):101–108. doi: 10.1038/nature11233. - DOI - PMC - PubMed
    1. Huarte M. The emerging role of lncRNAs in cancer. Nat Med. 2015;21(11):1253–1261. doi: 10.1038/nm.3981. - DOI - PubMed
    1. Uchida S, Dimmeler S. Long noncoding RNAs in cardiovascular diseases. Circ Res. 2015;116(4):737–750. doi: 10.1161/CIRCRESAHA.116.302521. - DOI - PubMed
    1. Briggs JA, Wolvetang EJ, Mattick JS, Rinn JL, Barry G. Mechanisms of long non-coding RNAs in mammalian nervous system development, plasticity, disease, and evolution. Neuron. 2015;88(5):861–877. doi: 10.1016/j.neuron.2015.09.045. - DOI - PubMed
    1. Lee JT. Epigenetic regulation by long noncoding RNAs. Science. 2012;338(6113):1435–1439. doi: 10.1126/science.1231776. - DOI - PubMed

Publication types

MeSH terms

Substances