. 2016 Dec 22;128(25):2960-2975.
doi: 10.1182/blood-2016-07-730556. Epub 2016 Oct 13.

The NLRP3 inflammasome functions as a driver of the myelodysplastic syndrome phenotype

Affiliations

The NLRP3 inflammasome functions as a driver of the myelodysplastic syndrome phenotype

Ashley A Basiorka et al. Blood. .

Abstract

Despite genetic heterogeneity, myelodysplastic syndromes (MDSs) share features of cytological dysplasia and ineffective hematopoiesis. We report that a hallmark of MDSs is activation of the NLRP3 inflammasome, which drives clonal expansion and pyroptotic cell death. Independent of genotype, MDS hematopoietic stem and progenitor cells (HSPCs) overexpress inflammasome proteins and manifest activated NLRP3 complexes that direct activation of caspase-1, generation of interleukin-1β (IL-1β) and IL-18, and pyroptotic cell death. Mechanistically, pyroptosis is triggered by the alarmin S100A9 that is found in excess in MDS HSPCs and bone marrow plasma. Further, like somatic gene mutations, S100A9-induced signaling activates NADPH oxidase (NOX), increasing levels of reactive oxygen species (ROS) that initiate cation influx, cell swelling, and β-catenin activation. Notably, knockdown of NLRP3 or caspase-1, neutralization of S100A9, and pharmacologic inhibition of NLRP3 or NOX suppress pyroptosis, ROS generation, and nuclear β-catenin in MDSs and are sufficient to restore effective hematopoiesis. Thus, alarmins and founder gene mutations in MDSs license a common redox-sensitive inflammasome circuit, which suggests new avenues for therapeutic intervention.


Figures

Figure 1.
Figure 1.
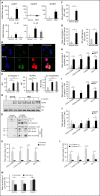
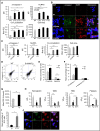
Fulminant pyroptosis is manifest in HSPCs and progeny in MDSs. (A) Quantitative polymerase chain reaction (qPCR) analyses of expression of pyroptosis-associated genes in BM-MNCs isolated from MDS patient specimens (n = 10 total, n = 5 LR-MDS, and n = 5 HR-MDS) compared with normal BM-MNCs (n = 5). (B) Representative confocal fluorescence micrograph (original magnification ×2520, 7.5 µm scale) of a–caspase-1 and NLRP3 expression in MDS vs normal BM-MNCs (DAPI, blue; a–caspase-1, green; and NLRP3, red; merged images show inflammasome formation). (C) Quantitative analysis of confocal images of BM-MNCs isolated from MDS patients (n = 7 LR-MDS, n = 3 HR-MDS) and normal donors (n = 6). (D) Binding of ASC to NLRP3 in LR-MDS BM-MNCs compared with normal donors (immunoprecipitation [IP], NLRP3; immunoblot [IB], NLRP3, ASC). Data are representative of 3 independent experiments. (E) Immunoblot following chemical crosslinking of BM-MNC lysates derived from normal donors (n = 3) and LR-MDS patients (n = 3). (F) Quantitation of inflammasome activation based on ASC oligomerization in BM-MNCs from LR-MDS (n = 5) vs normal BM-MNCs (n = 3). (G) Mean percentage of ASC specks and speck MFI in the BM plasma of LR-MDS specimens (n = 6) compared with normal BM plasma (n = 3). (H) The mean percentage of pyroptotic cells by hematopoietic lineage in LR-MDS (n = 8) vs normal donors (n = 8). (I-J) Mean percentage of (I) total a–caspase-1+ and (J) a–caspase-3/7+ cells assessed by hematopoietic lineage in LR-MDS (n = 8) and normal donors (n = 5). (K) Comparison of the mean percentage of pyroptotic vs apoptotic cells by hematopoietic lineage in LR-MDS specimens (n = 8). (L) Comparison of the mean percentage of a–caspase-1+ vs a–caspase-3/7+ cells in the same LR-MDS patients (n = 8). (M) Mean percentage of pyroptotic cells following knockdown of NLRP3, CASP1, and CASP3 by short hairpin RNA–directed silencing of LR-MDS BM-MNCs (n = 4 NLRP3, n = 3 CASP1 and CASP3). Error bars represent standard error (SE). *P < .05, ** P < .01, and ***P < .001. See also supplemental Figures 1 and 2.
Figure 2.
Figure 2.
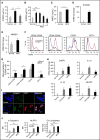
S100A9 initiates pyroptosis in MDS. (A) Enzyme-linked immunosorbent assay (ELISA) assessment of BM plasma concentration of S100A9 in normal donors (n = 12) vs MDS (n = 33 lower risk, n = 27 higher risk). (B) S100A9 BM plasma concentration analyzed according to IPSS risk score. (C) HMGB1 BM plasma concentration assessed by ELISA in normal donors (n = 11) and MDS patients (n = 55). (D) qPCR analysis of S100A9 mRNA levels in normal (n = 2) vs LR-MDS BM-MNCs (n = 8). (E) HMGB1 mRNA levels in normal (n = 6) vs MDS BM-MNCs (n = 10). (F) Representative histograms of intracellular levels of S100A9 by hematopoietic lineage in BM-MNCs isolated from MDS patients (n = 6) and normal donors (n = 5). (G) Mean percentage of S100A9+ cells by hematopoietic lineage. (H) qPCR analysis of untreated normal BM-MNCs (n = 3), normal BM-MNCs treated with 1 µg/mL rhS100A9 for 24 hours (n = 2), and MDS patient specimens (n = 5). (I) Representative micrograph (original magnification ×2520, 7.5 µm scale) depicting inflammasome formation in normal, untreated BM-MNC or normal BM-MNC treated with 5 µg/mL rhS100A9 for 24 hours (DAPI, blue; a–caspase-1, green; and NLRP3, red; merged images show inflammasome formation). (J) Quantitative analysis of confocal images of BM-MNCs from normal donors (n = 6), normal BM-MNCs treated with 5 µg/mL rhS100A9 (n = 2), and MDS patients (n = 10). Error bars represent SE. *P < .05, ** P < .01, and ***P < .001.
Figure 3.
Figure 3.
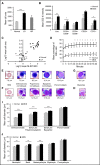
MDS precursors evidence cell swelling, a pyroptotic hallmark. (A) Mean cell area was quantified from confocal images of BM-MNCs from normal donors (n = 6) vs MDS patient specimens (n = 7 lower risk, n = 3 higher risk). (B) Flow cytometric analysis of mean SSC-A intensity of BM-MNCs isolated from normal donors (n = 6) or LR-MDS patients (n = 7). MDS BM-MNCs have mean cell area that is 2.0-fold greater than ungated BM-MNCs (P = .017), 2.2-fold greater than stem cells (CD34+CD38; P = .019), 1.5-fold greater than progenitor cells (CD34+CD38+), 1.6-fold greater than immature myeloid progenitors (CD33+), and 2.0-fold greater than erythroid progenitors (CD71+; P = .038). (C) NLRP3 MFI correlates with BM-MNC area in LR-MDS patients (r = 0.49, n = 7). (D) EtBr dye incorporation in BM-MNCs from normal donors (n = 3) and MDS patients (n = 3) was measured at 5-minute intervals by flow cytometry. (E, left to right) Photomicrograph images from normal donors illustrating normal red blood cell (RBC; 7.0 μm) followed by normal erythroid lineage maturation of nucleated BM precursors with corresponding cell diameter. (F) Corresponding images from MDS BM aspirates, demonstrating an oval macrocyte (RBC, 9.1 μm) followed by dysplastic and megaloblastic erythroid lineage maturation. (G) Normal myelocyte. (H) Enlarged dysplastic myelocyte with mild hypogranulation in MDS. (I-J) Erythroid (I) and myeloid (J) lineage maturation comparison of mean cell diameter in BM of normal donors (n = 4) vs MDS patients (n = 4). Maturation is depicted as most to least mature cell populations from left to right. Error bars represent SE. *P < .05, ** P < .01, and ***P < .001.
Figure 4.
Figure 4.
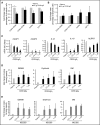
Inhibition of pyroptosis abrogates MDS HSPC death and augments CFC. (A-B) Fold change in the mean percentage of (A) pyroptotic or (B) apoptotic cells in each respective lineage in LR-MDS BM-MNCs (n = 6) incubated with autologous BM plasma and 0.5 µg CD33-IgG1 chimera for 24 hours. Values are normalized to autologous BM plasma-incubated MDS BM-MNCs. (C) qPCR analysis of BM-MNCs isolated from LR-MDS patients (n = 5) treated for 24 hours with CD33-IgG1. (D-E) CFC was assessed in BM-MNCs from LR-MDS patient specimens (n = 3) treated with increasing concentrations of CD33-IgG1 (E) or the inflammasome inhibitor MCC950 (E). Error bars represent SE.
Figure 5.
Figure 5.
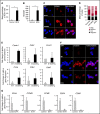
Pyroptosis is the principal mechanism of HSPC death in S100A9Tg mice. (A) Confocal image analysis of BM cells isolated from WT (n = 2), 2-month-old (n = 4), 6-month-old (n = 5), and 11-month-old (n = 4) S100A9Tg mice. (B) Representative micrograph (original magnification ×2520, 7.5 µm scale) depicting inflammasome formation in BM cells from WT cells, WT cells treated for 24 hours with 5 µg/mL rmS100A9, and BM cells from S100A9Tg mice (DAPI, blue; a–caspase-1, green; and NLRP3, red; merged images show inflammasome formation). (C) Quantitative analysis of confocal images of BM cells isolated from WT mice (n = 2), WT BM cells treated for 24 hours with 5 µg/mL rmS100A9 (n = 2), or BM cells from S100A9Tg mice (n = 13). (D) Representative scatterplots of pyroptotic and apoptotic KLS cells isolated from WT and transgenic mice. (E) Mean percentage of pyroptotic vs apoptotic KLS cells in WT (n = 6) and S100A9Tg mice (n = 6). (F) Mean percentage of total a–caspase-1+ and a–caspase-3/7+ KLS cells isolated from WT (n = 6) and S100A9Tg mice (n = 6). (G) Flow cytometric analysis of mean SSC-A intensity of BM cells isolated from WT (n = 6) and S100A9Tg mice (n = 6) (P = 1.0 × 10⁻²). (H) At 6 months of age, S100A9Tg mice were treated with 50 mg/kg ICTA. Shown are changes in hemoglobin, white blood cell (WBC), RBC, and platelet counts in WT (n = 4), S100A9Tg (n = 5), and ICTA-treated S100A9Tg mice (n = 5). (I) Mean percentage of KLS+ HSPCs in untreated vs ICTA-treated S100A9Tg mice. (J) Representative micrograph (original magnification ×2520, 7.5 µm scale) depicting inflammasome formation in BM cells harvested from untreated S100A9Tg mice or mice treated with ICTA by oral gavage for a total of 8 weeks (DAPI, blue; a–caspase-1, green; and NLRP3, red; merged images show inflammasome formation). Error bars represent SE. *P < .05, ** P < .01, and ***P < .001. See also supplemental Figure 3.
Figure 6.
Figure 6.
S100A9 induces ROS through NADPH oxidase to activate β-catenin. (A-B) The percentage of (A) ROS positive cells and (B) ROS-MFI assessed by flow cytometry in BM-MNCs isolated from MDS patients (n = 5) and normal donors (n = 2). (C) Representative micrograph (original magnification ×2520, 7.5 µm scale) of β-catenin expression in normal BM-MNCs (n = 3), normal BM-MNCs treated with 5 µg/mL rhS100A9 (n = 3), and MDS BM-MNCs (n = 6) (DAPI, blue; and β-catenin, red; merged images show nuclear β-catenin localization). (D) Quantitation and scoring of confocal images based on the presence of no, low, medium, or high nuclear β-catenin. (E) Wnt/β-catenin target gene expression in WT and S100A9Tg BM cells. (F) Representative micrograph (original magnification ×2520, 7.5 μm scale) of β-catenin expression in WT (n = 5), S100A9Tg (n = 5), and S100A9Tg mice that were treated with ICTA (n = 5) by oral gavage for 8 weeks (DAPI, blue; and β-catenin, red; merged images show nuclear β-catenin localization). (G) Wnt/β-catenin target gene expression in MDS BM-MNCs (n = 4) treated for 48 hours with ICTA. Error bars represent SE. *P < .05 and ***P < .001.
Figure 7.
Figure 7.
U2AF1 mutations manifest in MDS provoke pyroptosis and induce NOX-dependent activation of β-catenin. (A) Representative density plot of inflammasome formation based on ASC oligomerization. (B) Quantitation of ASC in WT, S34F, and S34F cells treated with DPI for 24 hours. (C) Representative scatter plots of pyroptotic cells by flow cytometry. (D) Mean percentage of pyroptotic cells in mutant and WT cells. (E-H) Mean percentage of total (E) a–caspase-1+ and (F) annexin V+ cells, as well as the MFI of (G) a–caspase-1 and (H) annexin V assessed by flow cytometry. (I) Binding of ASC to NLRP3 (IP of NLRP3, IB of NLRP3 and ASC). (J) Western blot of cleaved caspase-1 and IL-1β maturation. (K) Immunoblot of ASC monomers and higher-order ASC complexes following chemical crosslinking of cell lysates. (L) Mean cell area quantitated from confocal images. (M) Incorporation of EtBr measured by flow cytometry at 5-minute intervals. (N-O) Mean percentage of (N) ROS positive cells and (O) ROS MFI assessed by flow cytometry. (P) Representative micrograph (original magnification ×1890, 10 µm scale) of β-catenin expression in U2AF1 WT, S34F-expressing, or S34F-expressing cells treated with NAC or DPI for 24 hours prior to staining (DAPI, blue; and β-catenin, red; merged images show nuclear β-catenin localization). (Q) Quantitation and scoring of confocal images based on the presence of no, low, medium, or high nuclear β-catenin. (R) Representative density plot of inflammasome formation based on ASC oligomerization in S34F cells treated with 10 µM ICTA. (S) CFC assessed in WT, S34F, and S34F cells treated with increasing concentrations of ICTA (0.01-10 µM). The mean number of colonies is representative of 4 replicates per condition. Error bars represent SE. *P < .05, ** P < .01, and ***P < .001. Data are representative of 3 independent experiments. See also supplemental Figures 4-7.

Comment in

Similar articles

Cited by

References

    1. List A, Kurtin S, Roe DJ, et al. . Efficacy of lenalidomide in myelodysplastic syndromes. N Engl J Med. 2005;352(6):549-557. - PubMed
    1. Span LF, Rutten E, Gemmink A, Boezeman JB, Raymakers RA, de Witte T. Bone marrow mononuclear cells of MDS patients are characterized by in vitro proliferation and increased apoptosis independently of stromal interactions. Leuk Res. 2007;31(12):1659-1667. - PubMed
    1. Garcia-Manero G. Myelodysplastic syndromes: 2014 update on diagnosis, risk-stratification, and management. Am J Hematol. 2014;89(1):97-108. - PubMed
    1. Bejar R, Levine R, Ebert BL. Unraveling the molecular pathophysiology of myelodysplastic syndromes. J Clin Oncol. 2011;29(5):504-515. - PMC - PubMed
    1. Yoshida K, Sanada M, Shiraishi Y, et al. . Frequent pathway mutations of splicing machinery in myelodysplasia. Nature. 2011;478(7367):64-69. - PubMed

Publication types

MeSH terms