. 2016 Nov 1;126(11):4319-4330.
doi: 10.1172/JCI83185. Epub 2016 Oct 10.

Targeting CAG repeat RNAs reduces Huntington's disease phenotype independently of huntingtin levels

Targeting CAG repeat RNAs reduces Huntington's disease phenotype independently of huntingtin levels

Laura Rué et al. J Clin Invest. .

Abstract

Huntington's disease (HD) is a polyglutamine disorder caused by a CAG expansion in the Huntingtin (HTT) gene exon 1. This expansion encodes a mutant protein whose abnormal function is traditionally associated with HD pathogenesis; however, recent evidence has also linked HD pathogenesis to RNA stable hairpins formed by the mutant HTT expansion. Here, we have shown that a locked nucleic acid-modified antisense oligonucleotide complementary to the CAG repeat (LNA-CTG) preferentially binds to mutant HTT without affecting HTT mRNA or protein levels. LNA-CTGs produced rapid and sustained improvement of motor deficits in an R6/2 mouse HD model that was paralleled by persistent binding of LNA-CTG to the expanded HTT exon 1 transgene. Motor improvement was accompanied by a pronounced recovery in the levels of several striatal neuronal markers severely impaired in R6/2 mice. Furthermore, in R6/2 mice, LNA-CTG blocked several pathogenic mechanisms caused by expanded CAG RNA, including small RNA toxicity and decreased Rn45s expression levels. These results suggest that LNA-CTGs promote neuroprotection by blocking the detrimental activity of CAG repeats within HTT mRNA. The present data emphasize the relevance of expanded CAG RNA to HD pathogenesis, indicate that inhibition of HTT expression is not required to reverse motor deficits, and further suggest a therapeutic potential for LNA-CTG in polyglutamine disorders.


Figures

Figure 1
Figure 1. LNA-CTG preferentially binds to expanded HTT mRNA in HD fibroblasts, without inhibiting HTT protein levels.
(A) Scheme showing the binding sites of the primers used for PCR amplification in HTT exon 1 (HTT_e1* and HTT_e1 sets of primers) and HTT exons 29-30 (HTT_e29-30 set of primers). The black line represents introns. (B) HTT expression in HD fibroblasts (44_CAG repeats) transfected with different concentrations of LNA-CTG or LNA-SCB, 48 hours after transfection. Graph shows the RQ of HTT using the primer set HTT-e1* detecting WT (HTT-e1*-WT) or mutant (HTT-e1*-Mut) HTT-exon 1 and the primer set HTT_e29-30 detecting HTT-e29-30. Densitometric determinations were normalized to the β-actin PCR product and referred to the mock-transfected condition with a value of 1. Results are expressed as the mean ± SEM (n = 6). Box plot shows quartile values of the RQ of WT versus mutant HTT-e1* mRNA levels normalized to β-actin levels in HD fibroblasts transfected with LNA-CTG or LNA-SCB. A representative gel electrophoresis of the PCR products is shown. *P < 0.05, by Mann-Whitney U test with Bonferroni’s correction for multiple comparisons (n = 6 independent transfections). (C) HTT expression at different time points after transfection with 15 nM LNA-ASOs in HD fibroblasts (68_CAG repeats). The mean determinations ± SEM of HTT-e1*-WT and HTT-e1*-Mut and HTT-e29-30 relative to β-actin PCR products and a representative PCR gel electrophoresis are shown (n = 3). (D) Dot plots show Western blot densitometric analysis of WT HTT (WT-HTT) versus mutant HTT (mHTT) protein levels and total HTT (WT and mutant alleles) protein levels normalized to β-actin and expressed relative to an LNA-SCB–transfected sample with a value of 1. A representative immunoblot is shown (n = 3).
Figure 2
Figure 2. Intrastriatal injection of LNA-CTG induces rapid motor improvement in the R6/2 mouse model of HD, without affecting WT or mutant HTT expression levels.
(A) Schematic representation of pharmacological treatment administered and analyses. (B) Results from the rotarod test performed at 16, 24, and 32 rpm by mice between 5 and 15 weeks of age. Values represent the number of falls within 60 seconds as the mean ± SEM (WT n = 16; R6/2 n = 23; after surgery: WT n = 11; R6/2 LNA-SCB n = 11; R6/2 LNA-CTG n = 12). ***P < 0.001 versus WT vehicle-treated mice, as determined by 2-way ANOVA with Bonferroni’s post-hoc correction. (C) WT HTT (WT-HTT) and mutant HTT-e1 (mHTT) protein levels in the striatum of WT and R6/2 mice following intrastriatal injection of LNA-SCB or LNA-CTG, as analyzed by Western blotting. Box plots show the percentage of HTT and mHTT in the striatum of WT and/or R6/2 mice at different time points after LNA-ASO injection. Densitometric HTT and mHTT determinations were normalized using α-tubulin as an endogenous control and expressed as a percentage of a WT or R6/2 sample. Representative immunoblots are shown. WT: LNA-SCB–injected WT mice; sR6: LNA-SCB–injected R6/2 mice; aR6/2: LNA-CTG–injected R6/2 mice. Data were analyzed with Kruskal-Wallis (WT-HTT) and Mann-Whitney U (mHTT) tests (n = 4–12 animals per group). (D) HTT-e1 RNA transgene expression was analyzed by RT-PCR using the primer sets HTT_e1* or HTT_e1. Representative PCR products from animals injected with LNA-CTG or LNA-SCB are shown. β-Actin and Gdx amplification was used for internal controls. Box plots show RQ (obtained by densitometry) of HTT-e1 PCR products normalized to β-actin levels and referred to a control R6/2 LNA-SCB sample with a value of 1. *P < 0.01, when comparing LNA-SCB versus LNA-CTG–injected R6/2 mice in HTT_e1* PCR amplifications; Mann-Whitney U test with Bonferroni’s correction (n = 5–8 mice per group).
Figure 3
Figure 3. Downregulation of specific genes containing CAG repeats, detected by microarray analysis, reflects binding of LNA-CTG to the CAG stretch.
(A) Schema showing the binding site of the primers spanning the CAG repeats (p1) and primers mapping outside the CAG repeats (p2). (B) The expression levels of Crebbp, Mdh2, and Arhgap17 are shown in WT animals injected with LNA-SCB and R6/2 mice injected with LNA-SCB or LNA-CTG. A WT sample was used as a reference for RQ. Quantification was normalized to Tbp or Hprt as independent reference genes. *P < 0.01 with respect to WT LNA-SCB mice; P < 0.01 with respect to R6/2 LNA-SCB mice. Data were analyzed using a linear mixed-effects model and Bonferroni’s correction was applied for multiple comparisons (n = 5–7 mice per group).
Figure 4
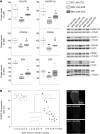
Figure 4. Intrastriatal injection of LNA-CTG recovers protein levels of several striatal markers in R6/2 mice.
(A) Levels of specific neuronal proteins 5 days after the first intrastriatal injection of LNA-SCB into WT and R6/2 mice and LNA-CTG into R6/2 mice. Box plots represent the densitometric protein quantification normalized to actin or tubulin and expressed relative to WT mice. Representative immunoblots are shown. Data were analyzed using the Kruskal-Wallis test, providing significant differences in all cases (P < 0.05). To determine statistical post-hoc differences between pairs of groups, the Mann-Whitney U test with Bonferroni’s correction was used (n = 6–8). *P < 0.05 and **P < 0.01, compared with LNA-SCB–injected WT mice; P < 0.05 and ††P < 0.01, compared with LNA-SCB–injected R6/2 mice. (B) Individual points show the fluorescence intensity of DARPP-32 staining along rostral-to-caudal striatal sections in WT LNA-SCB, R6/2 LNA-SCB, and R6/2 LNA-CTG mice 5 days after the first intrastriatal injection. IOD, integrated optical density. ANOVA was applied using a correlation structure for the repeated measures of each animal across 8 sections (8 repeated measures for four WT LNA-SCB–, two R6/2 LNA-SCB–, and three R6/2 LNA-CTG–injected animals). Representative images of DARPP-32 staining in each condition are shown. Scale bar: 500 μm.
Figure 5
Figure 5. LNA-CTGs reverse the toxicity produced by sRNAs extracted from the striatum of R6/2 mice.
(A) Workflow to evaluate the toxic effect of sRNAs isolated from mice injected with LNA-SCB or LNA-CTG, after motor performance evaluation. (B) Differentiated SH-SY5Y cells were transfected with sRNAs (20 ng or 40 ng per well) from WT or R6/2 mice injected with LNA-SCB or from R6/2 mice injected with LNA-CTG, and cell death was evaluated 40 hours later using the lactate dehydrogenase (LDH) assay. Box plot shows relative cell death in each condition referred to a control mock-transfected sample with a value of 1. *P < 0.05, by Kruskal-Wallis test, followed by a Mann-Whitney U test with Bonferroni’s correction as a post-hoc test (n = 4).

Similar articles

Cited by

References

    1. A novel gene containing a trinucleotide repeat that is expanded unstable on Huntington’s disease chromosomes The Huntington’s Disease Collaborative Research Group. Cell. 1993;72(6):971–983. doi: 10.1016/0092-8674(93)90585-E. - DOI - PubMed
    1. Cattaneo E, Zuccato C, Tartari M. Normal huntingtin function: an alternative approach to Huntington’s disease. Nat Rev Neurosci. 2005;6(12):919–930. doi: 10.1038/nrn1806. - DOI - PubMed
    1. Takahashi T, Katada S, Onodera O. Polyglutamine diseases: Where does toxicity come from? What is toxicity? Where are we going? J Mol Cell Biol. 2010;2(4):180–191. doi: 10.1093/jmcb/mjq005. - DOI - PubMed
    1. Labbadia J, Morimoto RI. Huntington’s disease: underlying molecular mechanisms and emerging concepts. Trends Biochem Sci. 2013;38(8):378–385. doi: 10.1016/j.tibs.2013.05.003. - DOI - PMC - PubMed
    1. Tsoi H, Lau TC, Tsang SY, Lau KF, Chan HY. CAG expansion induces nucleolar stress in polyglutamine diseases. Proc Natl Acad Sci U S A. 2012;109(33):13428–13433. doi: 10.1073/pnas.1204089109. - DOI - PMC - PubMed

Publication types