

Inflammatory Function of CX3CR1+ CD8+ T Cells in Treated HIV Infection Is Modulated by Platelet Interactions
- PMID: 27703039
- PMCID: PMC5142088
- DOI: 10.1093/infdis/jiw463
Inflammatory Function of CX3CR1+ CD8+ T Cells in Treated HIV Infection Is Modulated by Platelet Interactions
Abstract
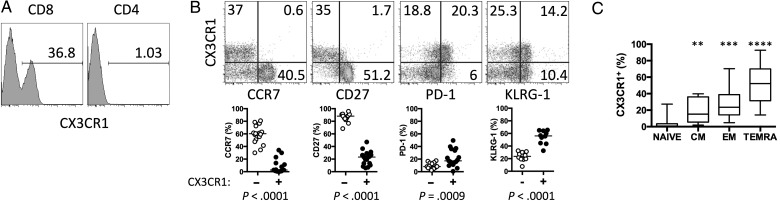
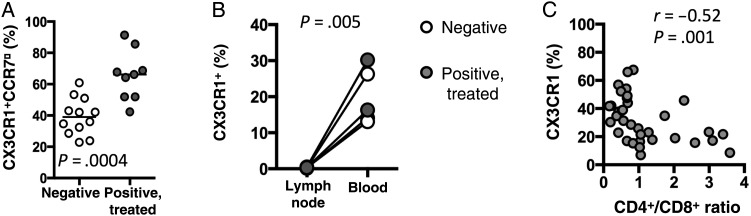
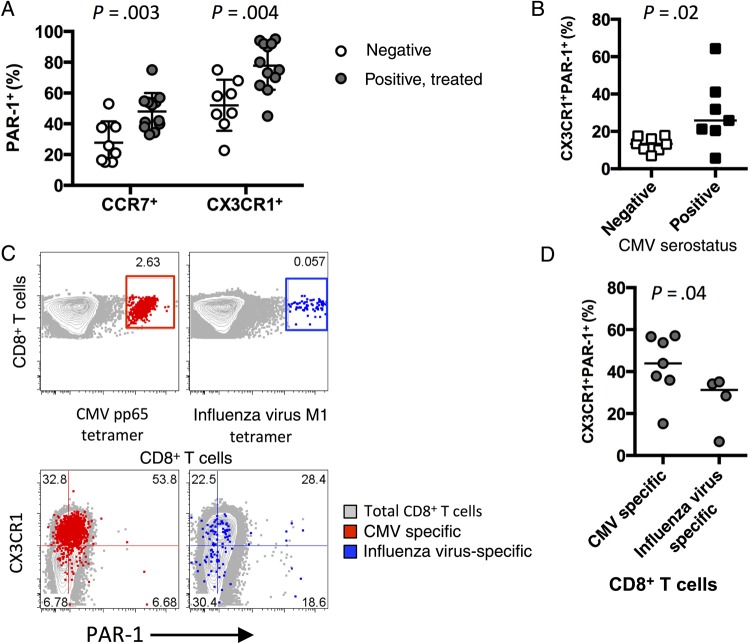
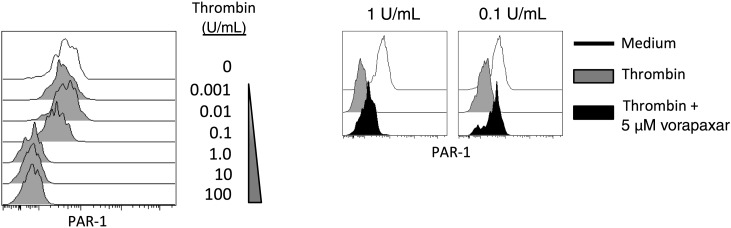
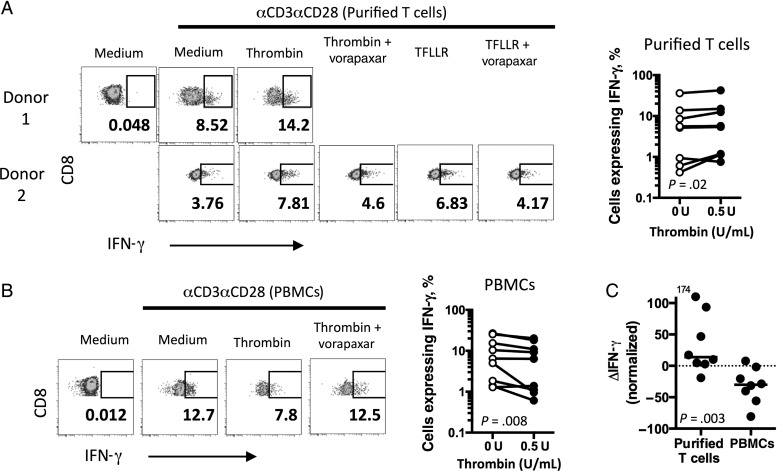
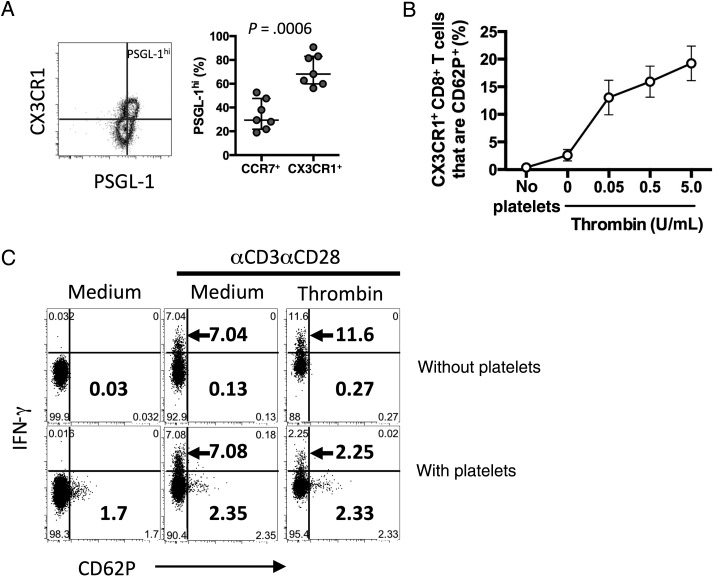
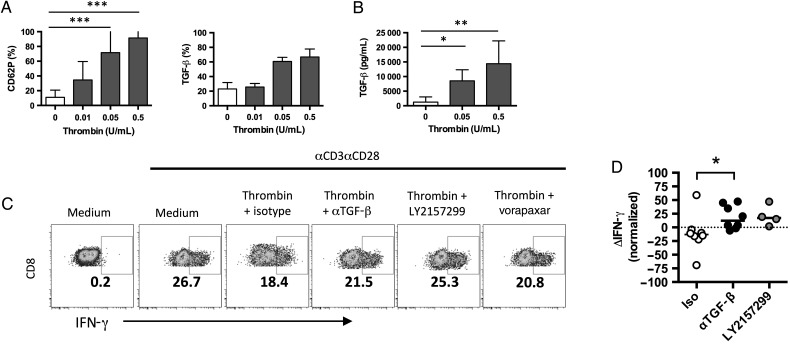
Increases in inflammation, coagulation, and CD8+ T-cell numbers are associated with an elevated cardiovascular disease (CVD) risk in human immunodeficiency virus (HIV)-infected antiretroviral therapy (ART) recipients. Circulating memory CD8+ T cells that express the vascular endothelium-homing receptor CX3CR1 (fractalkine receptor) are enriched in HIV-infected ART recipients. Thrombin-activated receptor (PAR-1) expression is increased in HIV-infected ART recipients and is particularly elevated on CX3CR1+ CD8+ T cells, suggesting that these cells could interact with coagulation elements. Indeed, thrombin directly enhanced T-cell receptor-mediated interferon γ production by purified CD8+ T cells but was attenuated by thrombin-induced release of transforming growth factor β by platelets. We have therefore identified a population of circulating memory CD8+ T cells in HIV infection that may home to endothelium, can be activated by clot-forming elements, and are susceptible to platelet-mediated regulation. Complex interactions between inflammatory elements and coagulation at endothelial surfaces may play an important role in CVD risk in HIV-infected ART recipients.
Keywords: CD8+ T-cell expansion; atherosclerosis; non–AIDS-related morbidities; platelets.
© The Author 2016. Published by Oxford University Press for the Infectious Diseases Society of America. All rights reserved. For permissions, e-mail journals.permissions@oup.com.
Figures
Similar articles
-
The chemokine receptor CX3CR1 controls homing and anti-viral potencies of CD8 effector-memory T lymphocytes in HIV-infected patients.AIDS. 2003 Jun 13;17(9):1279-90. doi: 10.1097/00002030-200306130-00002. AIDS. 2003. PMID: 12799549
-
Activated platelet-T-cell conjugates in peripheral blood of patients with HIV infection: coupling coagulation/inflammation and T cells.AIDS. 2015 Jul 17;29(11):1297-308. doi: 10.1097/QAD.0000000000000701. AIDS. 2015. PMID: 26002800 Free PMC article.
-
Identifying a Novel Role for Fractalkine (CX3CL1) in Memory CD8+ T Cell Accumulation in the Omentum of Obesity-Associated Cancer Patients.Front Immunol. 2018 Aug 13;9:1867. doi: 10.3389/fimmu.2018.01867. eCollection 2018. Front Immunol. 2018. PMID: 30150990 Free PMC article.
-
The spreading of HIV-1 infection in the human organism is caused by fractalkine trafficking of the infected lymphocytes--a review, hypothesis and implications for treatment.Virus Genes. 2007 Apr;34(2):93-109. doi: 10.1007/s11262-006-0056-x. Virus Genes. 2007. PMID: 17151939 Review.
-
Aging, inflammation, and HIV infection.Top Antivir Med. 2012 Aug-Sep;20(3):101-5. Top Antivir Med. 2012. PMID: 22954610 Free PMC article. Review.
Cited by
-
Platelet Induced Functional Alteration of CD4+ and CD8+ T Cells in HNSCC.Int J Mol Sci. 2020 Oct 12;21(20):7507. doi: 10.3390/ijms21207507. Int J Mol Sci. 2020. PMID: 33053760 Free PMC article.
-
The Dual Role of Platelets in the Cardiovascular Risk of Chronic Inflammation.Front Immunol. 2021 Apr 1;12:625181. doi: 10.3389/fimmu.2021.625181. eCollection 2021. Front Immunol. 2021. PMID: 33868242 Free PMC article. Review.
-
The coagulation system in host defense.Res Pract Thromb Haemost. 2018 May 24;2(3):549-557. doi: 10.1002/rth2.12109. eCollection 2018 Jul. Res Pract Thromb Haemost. 2018. PMID: 30046760 Free PMC article. Review.
-
BCG immunization induces CX3CR1hi effector memory T cells to provide cross-protection via IFN-γ-mediated trained immunity.Nat Immunol. 2024 Mar;25(3):418-431. doi: 10.1038/s41590-023-01739-z. Epub 2024 Jan 15. Nat Immunol. 2024. PMID: 38225437
-
[Influence of coronavirus disease 2019 on the nervous system of children].Zhongguo Dang Dai Er Ke Za Zhi. 2021 May;23(5):530-535. doi: 10.7499/j.issn.1008-8830.2012115. Zhongguo Dang Dai Er Ke Za Zhi. 2021. PMID: 34020746 Free PMC article. Review. Chinese.
References
-
- Serrano-Villar S, Gutierrez C, Vallejo A et al. . The CD4/CD8 ratio in HIV-infected subjects is independently associated with T-cell activation despite long-term viral suppression. J Infect 2013; 66:57–66. - PubMed
-
- Serrano-Villar S, Sainz T, Lee SA et al. . HIV-infected individuals with low CD4/CD8 ratio despite effective antiretroviral therapy exhibit altered T cell subsets, heightened CD8+ T cell activation, and increased risk of non-AIDS morbidity and mortality. PLoS Pathog 2014; 10:e1004078. - PMC - PubMed
MeSH terms
Substances
Grants and funding
LinkOut - more resources
Full Text Sources
Other Literature Sources
Medical
Research Materials
