. 2016 Oct 25;113(43):E6639-E6648.
doi: 10.1073/pnas.1606050113. Epub 2016 Oct 4.

Sustained antigen availability during germinal center initiation enhances antibody responses to vaccination

Affiliations

Sustained antigen availability during germinal center initiation enhances antibody responses to vaccination

Hok Hei Tam et al. Proc Natl Acad Sci U S A. .

Abstract

Natural infections expose the immune system to escalating antigen and inflammation over days to weeks, whereas nonlive vaccines are single bolus events. We explored whether the immune system responds optimally to antigen kinetics most similar to replicating infections, rather than a bolus dose. Using HIV antigens, we found that administering a given total dose of antigen and adjuvant over 1-2 wk through repeated injections or osmotic pumps enhanced humoral responses, with exponentially increasing (exp-inc) dosing profiles eliciting >10-fold increases in antibody production relative to bolus vaccination post prime. Computational modeling of the germinal center response suggested that antigen availability as higher-affinity antibodies evolve enhances antigen capture in lymph nodes. Consistent with these predictions, we found that exp-inc dosing led to prolonged antigen retention in lymph nodes and increased Tfh cell and germinal center B-cell numbers. Thus, regulating the antigen and adjuvant kinetics may enable increased vaccine potency.

Keywords: antigen retention; computational immunology; germinal center formation; humoral response; vaccination kinetics.


Conflict of interest statement

The authors declare no conflict of interest.

Figures

Fig. 1.
Fig. 1.
Exponentially increasing dosing schedules during priming durably increase antigen-specific IgG production relative to traditional bolus immunization. Groups of C57BL/6 mice (n = 5 per group) were immunized with 5 µg gp120 mixed with 25 µg MPLA according to the dosing schedules shown in A, followed by a single bolus booster injection of 5 µg gp120 + 25 µg MPLA on day 21. (B) Fold change in antibody concentration on day 14 postprime relative to bolus injection. *P < 0.05; ***P < 0.0001 compared with bolus injection determined by ANOVA with Dunnett’s test post hoc using bolus injection as the control. Shown are means ± SEM. (C) Total serum anti-gp120 IgG as measured by ELISA. Asterisk indicates statistically different from boost d21 group as determined by two-way ANOVA with Dunnett’s post hoc test using bolus injection as the control. Data are representative of two independent experiments.
Fig. 2.
Fig. 2.
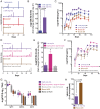
Exponentially increasing dosing profiles extended over 2 wk with an exponentially increasing boost enhance the humoral response. Groups of C57BL/6 mice were immunized with 5 µg gp120 + 25 µg MPLA following the dosing schedules shown in A and D. (B) Fold change in antibody concentration on day 21 postprime relative to bolus injection. p was determined by unpaired Mann–Whitney test. (C) Total serum anti-gp120 IgG (n = 10 per group) as measured by ELISA. Asterisk indicates statistically different from boost d21 group as determined by two-way ANOVA with Dunnett’s post hoc test using bolus injection as the control. (E) Fold change in antibody concentration on day 49 (postboost) relative to bolus injection. *P < 0.05 determined by Kruskal–Wallis test with Dunn’s multiple comparison’s test. (F) Total serum IgG (n = 5 per group) measured by ELISA. Asterisk indicates statistically different from boost d21 group as determined by two-way ANOVA with Dunnett’s post hoc test using bolus injection as the control. (G) Mice were immunized either with gp120 plus MPLA following schedules shown in D or with gp120 formulated in 100 µg alum (aluminum phosphate, prime day 0, boost day 28). Serum was collected at day 49, and anti-gp120 isotype titers were analyzed by ELISA. Asterisk indicates statistically different from boost d28 group as determined by two-way ANOVA with Dunnett’s post hoc test using bolus injection as the control. (H) ELISA for binding to gp120 for day 49 sera was performed in the presence of competing broadly neutralizing antibody VRC01. Shown is ELISA optical density as a percentage of uncompeted signal. p was calculated by unpaired Mann–Whitney test. All values shown are mean ± SEM. Data are representative of experiments done twice (AC) or once (DH), using at least five mice per group.
Fig. S1.
Fig. S1.
Extending exponential increasing dosing over 3 wk results in lower antibody titers. Groups of C57BL/6 mice (n = 5 per group) were immunized with 5 µg gp120 + 25 µg MPLA following the dosing schedules shown in A. (B) Fold change in antibody concentration on day 43 (postboost) relative to bolus prime and boost injections. P value determined by unpaired Mann–Whitney test. Data are representative of two independent experiments, using five mice per group.
Fig. S2.
Fig. S2.
Exp-inc vaccine dosing elicits substantially higher antibody titers than vaccination with alum. Groups of C57BL/6 mice (n = 5 per group) were immunized with 5 µg gp120 + 25 µg MPLA following the dosing schedules shown in Fig. 2D. The alum group received bolus immunization with 5 µg gp120 and 50 µg alum (aluminum phosphate) following the same schedule as the bolus Boost d28. Shown are serum gp120-specific IgG titers vs. time. Asterisk indicates statistically different from boost d28 group as determined by two-way ANOVA with Dunnett’s post hoc test using bolus injection as the control.
Fig. 3.
Fig. 3.
A computational model of the germinal center response predicts enhanced immune complex formation and IgG production by extended-dosing/increasing vaccination profiles. (A) Schematic of components of antigen transport, GC reaction, and antibody production model. (B) Four reactions of the model including antigen capture by ICs at initial and later stages of the immune response, coarse-grained germinal center reaction, and antibody production. CB, concentration of germinal center B cells; CAg, concentration of free Ag; CIC, concentration of ICs; CIgM, concentration of IgM; CIgG, concentration of IgG; CPC, concentration of plasma cells. (C) Kinetic profile of free antigen in lymph nodes predicted by the model with fitted k (2.56 × 10⁶ antibodies per plasma cell per day). (D) Kinetic profiles of IC, IgM, IgG, plasma cells, and total antigen in lymph node (free Ag + IC) predicted by the model. See also Germinal Center Model Calculations in Materials and Methods and Table S3 for mathematical representation of the model.
Fig. 4.
Fig. 4.
Exponentially increasing vaccine dosing leads to enhanced antigen capture and retention in draining lymph nodes. Groups of albino C57BL/6 mice received s.c. injections of 5 µg of IRDye800-labeled gp120 plus 25 µg of MPLA. Relative amounts of gp120 in the lymph nodes were quantified by fluorescence. (A) Dosing and sampling profiles used in this experiment. (B) Fluorescence detected from lymph nodes ex vivo (n = 4 per group) at 24 or 72 h post-last injection. P value was calculated by unpaired Mann–Whitney test. Data are representative of two independent experiments. (C) Groups of C57BL/6 mice (n = 2 per group) were vaccinated with 5 µg phycoerythrin and 25 µg MPLA by bolus or exp-inc dosing following the schedule in A, followed by collection of lymph nodes for imaging at 72 h after bolus or after last injection of 2 wk exp-inc dosing. FDC networks were labeled in situ by i.p. injection of anti-CD21/35 antibody 16 h before tissue collection. Collected tissues were clarified and imaged intact by confocal microscopy; shown are maximum intensity projections from z-stacks through FDC clusters. (Scale bar, 80 µm.)
Fig. 5.
Fig. 5.
Exponentially increasing vaccine dosing promotes germinal center B-cell differentiation. C57BL/6 mice were immunized with either 5 µg gp120 and 25 µg MPLA, MPLA only, or gp120 only, following the dosing schemes depicted in A. (B) Lymph node sections were stained for B cells (B220; blue) and GL7 (pink) and analyzed by confocal microscopy. (Magnification: 10×.) (CE) Draining LNs were collected at the indicated time points, and cell suspensions were analyzed by flow cytometry to detect germinal center B cells (C; GL7+PNA+IgDlow), plasmablasts (D; CD138+B220), and activated B cells (E; B220+MHCII+CD86+). Representative flow cytometry plots (Left) and cell counts (Right) are shown. *P < 0.05, **P < 0.01, and ***P < 0.001 determined by Kruskal–Wallis test with Dunn’s multiple comparison’s test. Error bars are SEM. Data are representative of four independent experiments.
Fig. 6.
Fig. 6.
Continuous vaccine release via osmotic minipumps leads to increased Tfh and GC B cells and amplified antibody responses. (AD) 129S1/SvImJ mice were immunized with 20 µg HIV-1 Env BG505 SOSIP trimer via conventional bolus injection (Bolus). A second group, 7d minipump, was immunized with 7-d minipumps continuously releasing HIV-1 Env BG505 SOSIP trimers (50 µg, 7.1 µg/d), supplemented with 20 µg BG505 SOSIP trimer via bolus injection at the end of each 7-d pump immunization. A third group, 14d minipump, was immunized with 14-d minipumps continuously releasing HIV-1 Env BG505 SOSIP trimers (100 µg, 7.1 µg/d), supplemented with 20 µg BG505 SOSIP trimer via bolus injection at the end of each 7-d pump immunization. A course of three immunizations was used, paralleling a human vaccine schedule. (BD) Draining LNs were collected at wk 24, 4 wk after the final immunization, and lymphocytes were analyzed by flow cytometry to detect (B) GC Tfh cells (CXCR5+PD-1hi), (C) Tfh cells (CXCR5+), and (D) germinal center B cells (FAShiGL7hi). Representative flow cytometry plots (Left) and cell counts (Right) are shown. (E and F) 129S1/SvImJ mice were immunized with conventional 20 µg bolus injections of HIV-1 Env BG505 SOSIP trimers (Bolus). A second group was immunized with 14-d minipumps continuously releasing HIV-1 Env BG505 SOSIP trimers (1.4 µg/d), supplemented with 20 µg BG505 SOSIP trimer via bolus injection at the end of the 14-d pump immunization (Pump). ISCOMATRIX adjuvant was used in each case. (E) Env trimer binding IgG was quantified by ELISA. Dotted line indicates time of second immunization (week 8). (F) ELISA for off-target V3 loop antibodies. Data are representative of two independent experiments. *P < 0.05; **P < 0.01. Error bars are SEM.
Fig. S3.
Fig. S3.
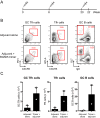
Adjuvant alone does not induce germinal center responses. (A) C57BL/6 mice were immunized with 0.2 μg ISCOMs alone or with 10 μg BG505 SOSIP trimers and 0.2 μg ISCOMs at weeks 0, 6, and 20. Germinal center responses in draining lymph nodes were analyzed at week 22. (B) Flow plots and (C) graphs of GC Tfh cells (CXCR5+PD-1hi), Tfh cells (CXCR5+BTLAhi), and germinal center B cells (FAShiGL7hi) in draining lymph nodes of mice immunized with adjuvant alone or with trimer and adjuvant.

Similar articles

Cited by

References

    1. Bärnighausen T, Bloom DE, Cafiero-Fonseca ET, O’Brien JC. Valuing vaccination. Proc Natl Acad Sci USA. 2014;111(34):12313–12319. - PMC - PubMed
    1. Nabel GJ. Designing tomorrow’s vaccines. N Engl J Med. 2013;368(6):551–560. - PMC - PubMed
    1. Correia BE, et al. Proof of principle for epitope-focused vaccine design. Nature. 2014;507(7491):201–206. - PMC - PubMed
    1. McGuire AT, et al. Engineering HIV envelope protein to activate germline B cell receptors of broadly neutralizing anti-CD4 binding site antibodies. J Exp Med. 2013;210(4):655–663. - PMC - PubMed
    1. Reed SG, Orr MT, Fox CB. Key roles of adjuvants in modern vaccines. Nat Med. 2013;19(12):1597–1608. - PubMed

Publication types

MeSH terms