. 2016 Oct 17;213(11):2315-2331.
doi: 10.1084/jem.20151193. Epub 2016 Oct 3.

Tumor macrophages are pivotal constructors of tumor collagenous matrix

Affiliations

Tumor macrophages are pivotal constructors of tumor collagenous matrix

Ran Afik et al. J Exp Med. .

Abstract

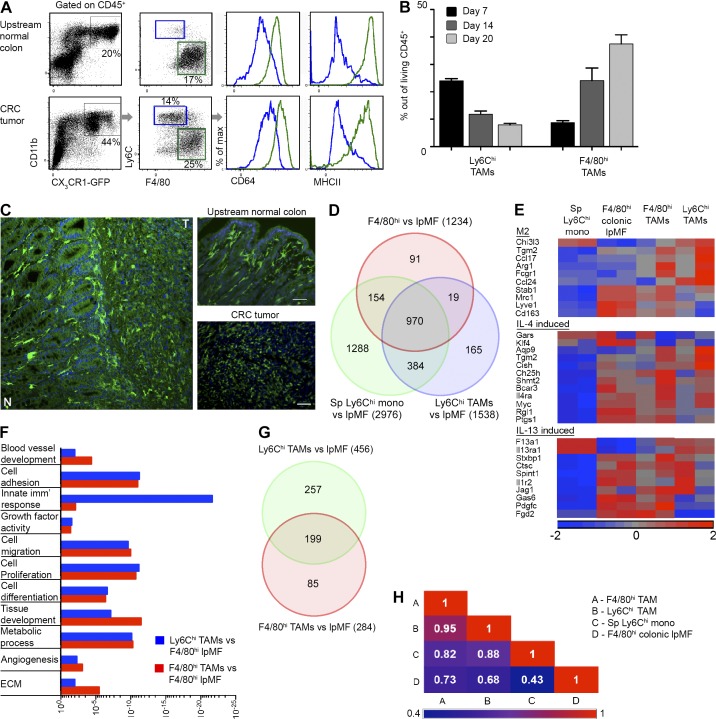
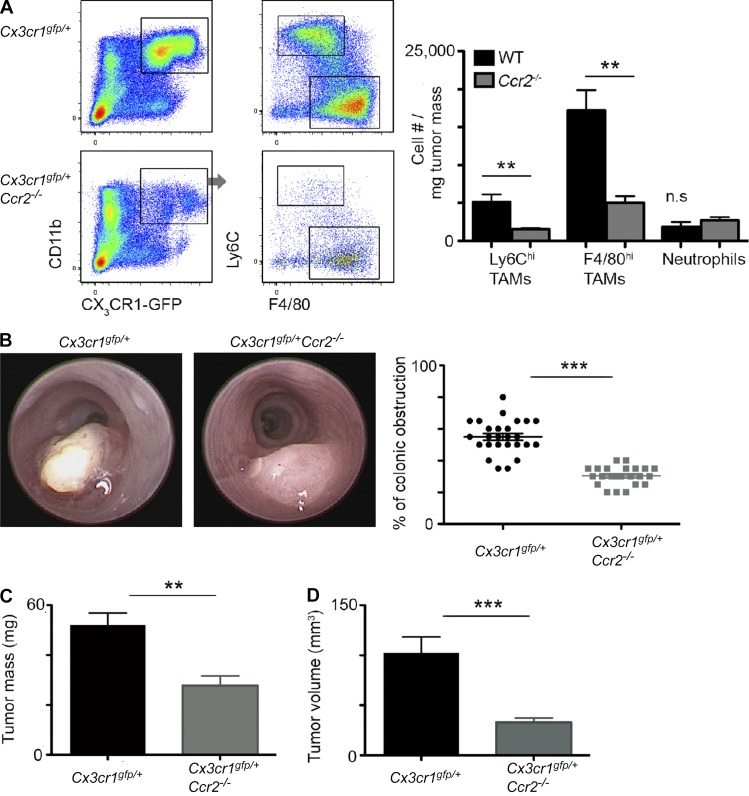
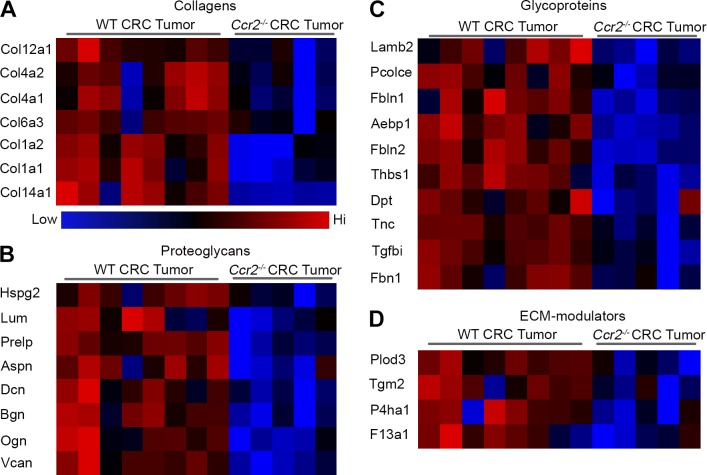
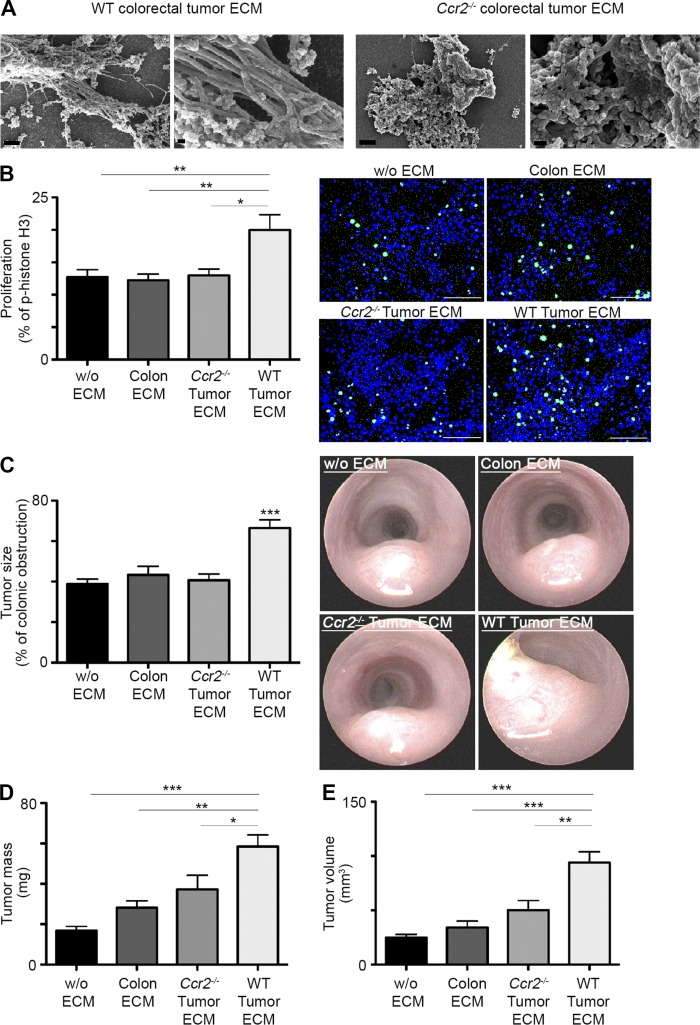
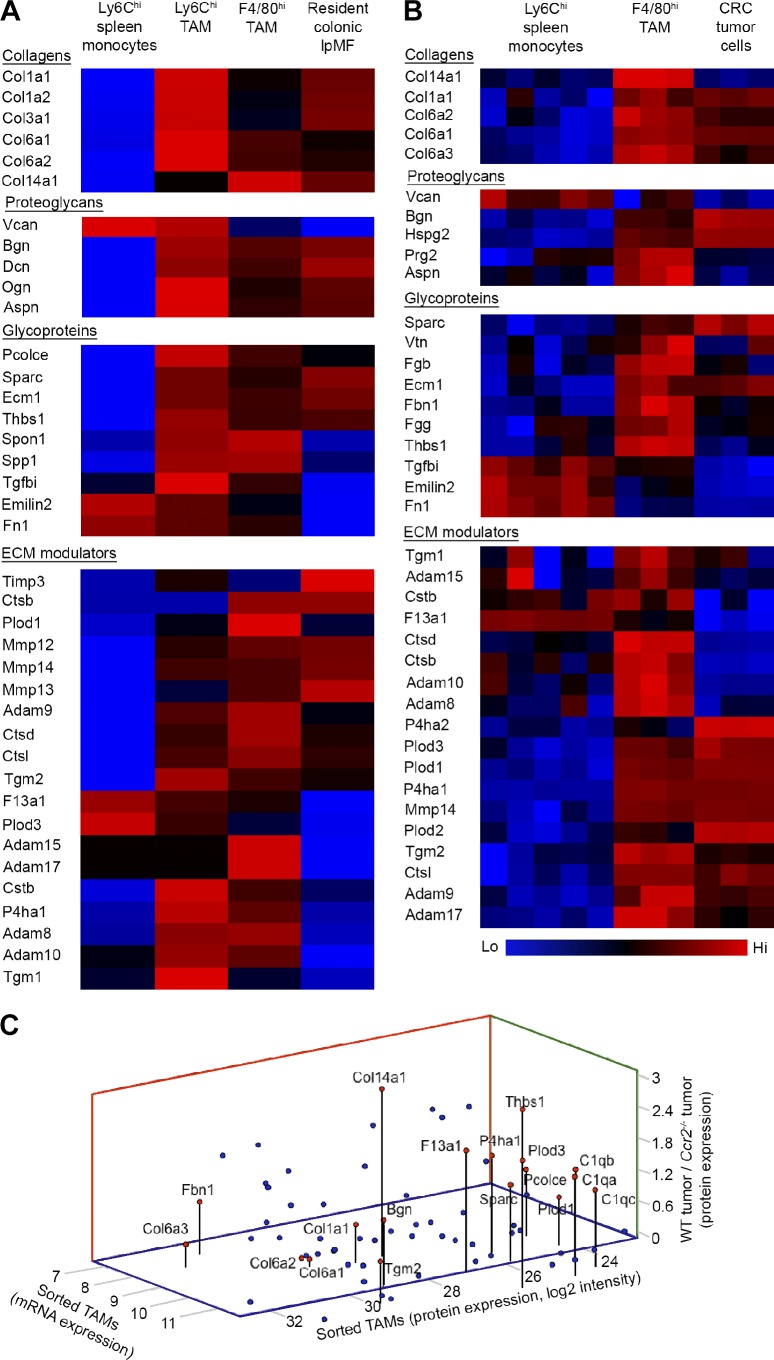
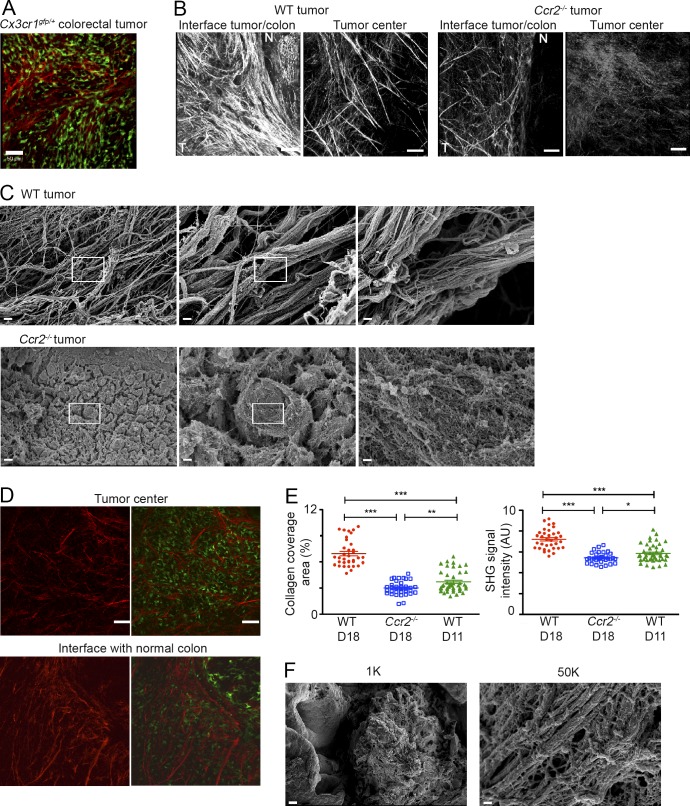
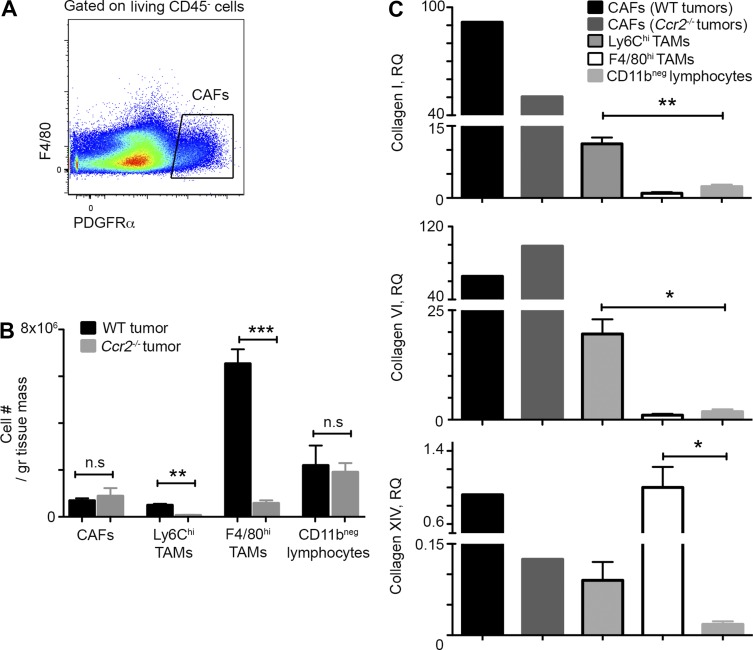
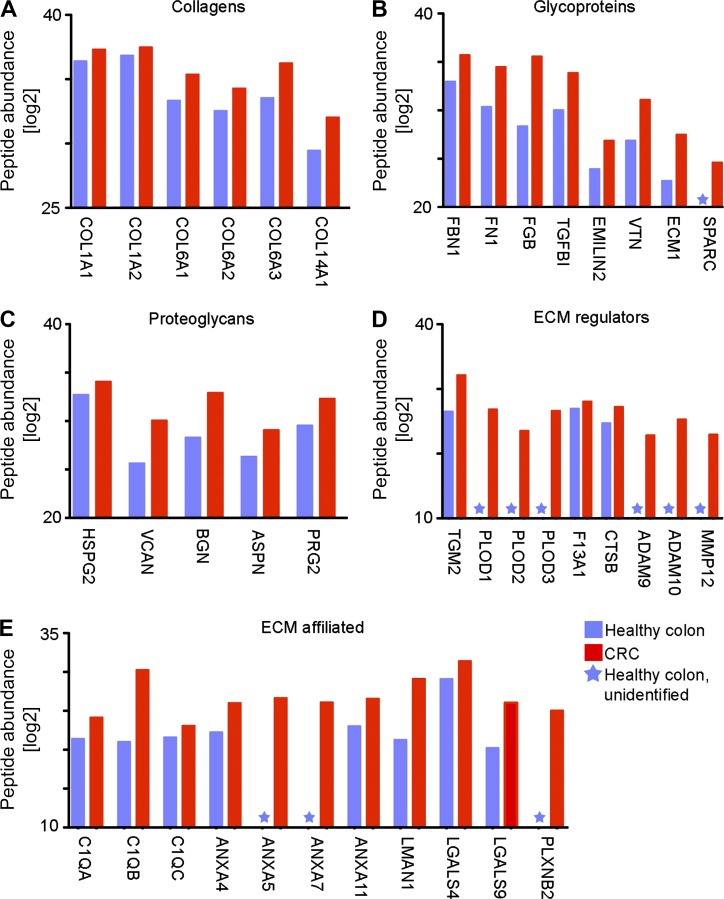
Tumor-associated macrophages (TAMs) promote tumor development, invasion, and dissemination by various mechanisms. In this study, using an orthotopic colorectal cancer (CRC) model, we found that monocyte-derived TAMs advance tumor development by the remodeling of its extracellular matrix (ECM) composition and structure. Unbiased transcriptomic and proteomic analyses of (a) TAM-abundant and -deficient tumor tissues and (b) sorted tumor-associated and -resident colonic macrophage subpopulations defined a distinct TAM-induced ECM molecular signature composed of an ensemble of matricellular proteins and remodeling enzymes they provide to the tumor microenvironment. Remarkably, many of these ECM proteins are specifically increased in human CRC versus healthy colon. Specifically, we demonstrate that although differentiating into TAMs, monocytes up-regulate matrix-remodeling programs associated with the synthesis and assembly of collagenous ECM, specifically collagen types I, VI, and XIV. This finding was further established by advanced imaging showing that TAMs instruct the deposition, cross-linking, and linearization of collagen fibers during tumor development, especially at areas of tumor invasiveness. Finally, we show that cancer-associated fibroblasts are significantly outnumbered by TAMs in this model and that their expression of collagen XIV and I is reduced by TAM deficiency. Here, we outline a novel TAM protumoral function associated with building of the collagenous ECM niche.


Figures

Figure 1.
Figure 1.
Characterization of TAM subsets in an orthotopic model of CRC. (A) Flow cytometry analysis of living CD45+ leukocytes was performed at day 14 after tumor implantation in Cx3cr1gfp/+ mice. Representative images display the definition of colonic lpMFs within the upstream normal colon (top) and Ly6Chi and F4/80hi TAM subsets within the colorectal tumors (bottom). Percentages indicate the population fraction out of CD45+ cells. (B) Graphic summary showing the fraction of Ly6Chi and F4/80hi TAMs out of CD45+ living total tumor immune cells at days 7, 14, and 20 after tumor grafts. Data are presented as mean ± standard error of the mean. (C) Confocal fluorescence microscopy imaging of colorectal tumor margins was performed at day 14 after tumor implantation in Cx3cr1gfp/+ mice. Images show the interface between the tumor (T) and its surrounding normal tissue (N). Bars, 50 µm. (D) Venn diagram of monocytes (mono) and TAM subsets showing the distribution and number of differentially expressed genes in comparison with colonic resident lpMFs. Sp, splenic. (E) Heat map analysis showing the differential raw expression level of genes associated with M2 alternative macrophage activation phenotype and with IL-4– or Il-13–induced macrophage activation. (F) Graphic presentation of the significance (p-value) for the enrichment of selected GO categories out of GOEAST analyses performed for differentially expressed genes between Ly6Chi TAMs (blue) or F4/80hi TAMs (red) versus colonic lpMFs. Imm’, immune. (G) Venn diagram showing the distribution of functions found to be significantly enriched (P < 0.05) by the DAVID tool in the differentially expressed genes of F4/80hi TAMs and Ly6Chi TAMs versus colonic lpMFs. (H) Correlation matrix with Pearson correlation coefficient performed for all genes above background and above twofold change. Results are representative of one (B and C) or tens (A) of independent experiments with three to five mice in each experimental group. (D–H) Microarray data represent the average of two biological repeats, each extracted from a pool of mice (splenic monocytes, n = 5; TAMs and colonic lpMFs, n ≥ 10). GOEAST and DAVID analyses of differentially expressed genes (greater than or equal to twofold change; P < 0.05; ANOVA) use a hypergeometric test to assess the significantly enriched GO terms among a given gene list.
Figure 2.
Figure 2.
Colorectal tumors established in Ccr2−/− mice display impaired TAM recruitment and tumor growth. (A) Flow cytometry analysis of living CD45+ leukocytes was performed at day 14 after tumor implantation in Cx3cr1gfp/+ and Cx3cr1gfp/+Ccr2−/− mice. The graph presents cell population number normalized per tumor mass of Ly6Chi and F4/80hi TAM subsets and of neutrophils in WT versus Ccr2−/− tumors. (B–D) Analysis of tumor growth was performed at day 18 after tumor implantation in WT and Ccr2−/− mice. Graphical summaries display colonic lumen obstruction as assessed by colonoscopy (B), tumor mass (C), and tumor volume (D). Results are representative of one (A) or four (B–D) independent experiments with 6 mice (A) or at least 15 mice (B–D) in each experimental group. Data were analyzed by unpaired, two-tailed Student’s t tests and are presented as mean ± standard error of the mean. **, P < 0.01; ***, P < 0.001.
Figure 3.
Figure 3.
TAM-deficient colorectal tumors display altered ECM composition. (A–D) LC-MS/MS analysis was performed on whole protein extracts from WT versus Ccr2−/− tumors. Color-coded heat maps show the differentially expressed ECM-related proteins categorized into collagens (A), proteoglycans (B), glycoproteins (C), and ECM modulators (D). Results are a summary of a single experiment with eight mice in the WT tumor group and five mice in the Ccr2−/− tumor group. Data were analyzed by unpaired, two-tailed Student’s t tests with pFDR = 0.05 and presented in z-score form.
Figure 4.
Figure 4.
TAM-mediated remodeling of core and affiliated ECM protein composition is tumorigenic. (A) SEM imaging was performed on ECM fragments extracted from decellularized WT or Ccr2−/− tumors. Bars: (left and middle left) 1 µm; (middle right and right) 200 nm. (B) MC38 CRC cells were cultured without or with decellularized 3D ECM fragments extracted from normal colon, WT, or Ccr2−/− tumors, and their proliferation was assessed by staining for p-histone H3 (green) and DAPI (blue). The graph (left) and fluorescence microscopy images (right) show the fraction of actively proliferating MC38 cells. Bars, 100 µm. (C and D) Analysis of tumor growth was performed at day 20 after orthotopic implantation of MC38 CRC cells without or with decellularized 3D ECM fragments extracted from normal colon, WT, or Ccr2−/− tumors. Graphical summaries display colonic lumen obstruction as assessed by colonoscopy (C), tumor mass (D), and tumor volume (E). Results are representative of one (B) or two (A and C–E) independent experiments with 10 repeats per group (B) or at least 7 mice in each experimental group (C– E). Data were analyzed by unpaired, two-tailed Student’s t tests, comparing each time the WT tumor ECM with one of the other groups, and are presented as mean ± standard error of the mean. *, P < 0.05; **, P < 0.01; ***, P < 0.001. w/o, without.
Figure 5.
Figure 5.
Transcriptomic and proteomic analyses of TAM’s ECM signature. (A) Color-coded Affymetrix gene array heat maps displaying the ECM-related gene expression in sorted Ly6Chi and F4/80hi TAMs (day-14 tumors) in comparison with their Ly6Chi monocyte precursors (splenic reservoir) and resident lpMFs sorted from upstream normal colon. Data were z scored and represent the average of two biological repeats; each was extracted from a pool of mice (splenic monocytes, n = 5; TAMs and colonic lpMFs, n ≥ 10). (B) Color-coded heat maps presenting ECM-related proteins found by LC-MS/MS analysis to be significantly and differentially expressed in sorted F4/80hi TAMs in comparison with their Ly6Chi monocyte precursors and colocalizing colorectal tumor cells. Ly6Chi monocytes: five biological repeats; each was extracted from a pool of three mice. F4/80hi TAMs and CRC cells: three biological repeats; each was extracted from a pool of five mice. Data were analyzed by unpaired, two-tailed Student’s t tests (pFDR = 0.05) and z scored. (C) Graphical summary showing ECM molecules that were mutually expressed (log2) at the protein level in sorted F4/80hi TAMs (x axis) and at the RNA level in sorted F4/80hi TAMs (y axis) and were higher in the TAM-sufficient (WT) versus TAM-deficient (Ccr2−/−) tumors (z axis). Each dot represents an ECM protein; red dots highlight proteins associated with fibrous ECM formation.
Figure 6.
Figure 6.
TAM-deficient colorectal tumors display aberrant deposition and organization of fibrillar collagen. (A–F) Colorectal tumors were excised and subjected to SHG and SEM imaging techniques at days 11 and 18 after their orthotopic implantation in Cx3cr1gfp/+ mice. (A) Two-photon SHG microscopy image focusing on the interface between the day 18 tumor and muscularis mucosa. SHG signal is represented as pseudocolor red (excitation: 900 nm; detection: 450 nm), and TAMs are GFP. Bar, 50 µm. (B) Representative two-photon SHG microscopy images of WT and Ccr2−/− colorectal tumor sections revealing collagen deposition and structures at the center of the tumor and at its margins. SHG signal is represented as pseudocolor white. N, normal tissue; T, tumor. Bars, 50 µm. (C) Representative SEM images of decellularized ECM scaffolds extracted from WT and Ccr2−/− colorectal tumors. Bars: (left) 10 µm; (middle) 2 µm; (right) 200 nm. (D) Representative two-photon SHG microscopy images of WT colorectal tumor sections extracted at earlier developmental stage (day 11), when tumors reach 30% of colonic obstruction as Ccr2−/− tumors at day 18. Bars, 50 µm. (E) Graphical summaries of semiquantitative SHG signal intensity (arbitrary units [AU]) and of collagen coverage area (percentage) in WT tumors extracted at days 11 and 18 and Ccr2−/− tumors extracted at day 18. Data were acquired from at least 33 images of at least 3 tumors, analyzed by unpaired, two-tailed Student’s t tests, and are presented as mean ± standard error of the mean. *, P < 0.05; **, P < 0.01; ***, P < 0.001. (F) Representative SEM images of decellularized ECM scaffolds extracted from day 11 WT tumors. Bars: (left) 10 µm; (right) 200 nm. Results are representative of three independent experiments with at least four mice in each experimental group (A–C) or of a single experiment with at least four mice in each group (D and F).
Figure 7.
Figure 7.
TAM deficiency reduces collagen XIV and I gene expression in CAFs. (A) Flow cytometry analysis was performed in day 14 tumors, and CAFs were identified as living CD45CD11bF4/80PDGFRα+ cells (Erez et al., 2010; Sharon et al., 2013). (B) Graphic summary of flow cytometry results presenting cell population number normalized for tumor mass comparing WT with Ccr2−/− tumors. n ≥ 3 tumors in each group. gr, gram. (C) Quantitative real-time PCR analysis showing the relative gene expression of collagens I, VI, and XIV in comparison with F4/80hi TAMs. CAFs were sorted out of pool of 20 WT or Ccr2−/− tumors. For the other populations, data were extracted from three biological repeats; each was extracted from pool of six to seven mice. RQ, relative quantification. Data were analyzed by unpaired, two-tailed Student’s t tests and are presented as mean ± standard error of the mean. *, P < 0.05; **, P < 0.01; ***, P < 0.001.
Figure 8.
Figure 8.
TAM-defined ECM proteins are increased in human CRC. (A–E) Graphic representation of protein expression levels of collagens (A), glycoproteins (B), proteoglycans (C), ECM regulators (D), and ECM-affiliated proteins (E). Data are presented as protein abundance (log2 modified) in normal human colon (blue) versus CRC (red) and correspond to the sum of specific peptide abundance across independent samples (three independent samples for each tissue type). Unidentified proteins are marked with a star. These results were analyzed out of a published database (Naba et al., 2014).

Similar articles

Cited by

References

    1. Bain C.C., Scott C.L., Uronen-Hansson H., Gudjonsson S., Jansson O., Grip O., Guilliams M., Malissen B., Agace W.W., and Mowat A.M.. 2013. Resident and pro-inflammatory macrophages in the colon represent alternative context-dependent fates of the same Ly6Chi monocyte precursors. Mucosal Immunol. 6:498–510. 10.1038/mi.2012.89 - DOI - PMC - PubMed
    1. Bain C.C., Bravo-Blas A., Scott C.L., Gomez Perdiguero E., Geissmann F., Henri S., Malissen B., Osborne L.C., Artis D., and Mowat A.M.. 2014. Constant replenishment from circulating monocytes maintains the macrophage pool in the intestine of adult mice. Nat. Immunol. 15:929–937. 10.1038/ni.2967 - DOI - PMC - PubMed
    1. Biswas S.K., Allavena P., and Mantovani A.. 2013. Tumor-associated macrophages: functional diversity, clinical significance, and open questions. Semin. Immunopathol. 35:585–600. 10.1007/s00281-013-0367-7 - DOI - PubMed
    1. Bogunovic M., Ginhoux F., Helft J., Shang L., Hashimoto D., Greter M., Liu K., Jakubzick C., Ingersoll M.A., Leboeuf M., et al. . 2009. Origin of the lamina propria dendritic cell network. Immunity. 31:513–525. 10.1016/j.immuni.2009.08.010 - DOI - PMC - PubMed
    1. Collighan R.J., and Griffin M.. 2009. Transglutaminase 2 cross-linking of matrix proteins: biological significance and medical applications. Amino Acids. 36:659–670. 10.1007/s00726-008-0190-y - DOI - PubMed

Publication types

MeSH terms